iii
Cláudia Coelho de Ávila Sarmento Espalha
Bachelor of Science in Biomedical Engineering
[Habilitações Académicas]
Direct Detection of Biogenic Amines from Fish
Dissertation to obtain the Master Degree in
Biomedical Engineering
Advisor: PhD. Prof. Valentina Vassilenko, Assistant Professor, FCT/UNL
Advisor: Prof. Mário Diniz, Assistant Professor, FCT/UNL
Júri:
Presidente: Doutor Jorge Alexandre de Carvalho Silva, Professor Auxiliar da Universidade NOVA de Lisboa - Faculdade de Ciências e Tecnologia Arguentes: Doutora Maria Paulina Estorninho Neves da
Mata, Professora Auxiliar da Faculdade de Ci-ências Médicas da Universidade NOVA de Lisboa
Direct Detection of Biogenic Amines from Fish
Copyright © Cláudia Coelho de Ávila Sarmento Espalha, Faculdade de Ciências e Tec-nologia, Universidade Nova de Lisboa.
Acknowledgments
To my advisor Valentina Vassilenko, for transmitted knowledge and demon-strated patience and dedication.
To my advisor Mário Diniz for the availability, commitment, motivation and ded-ication towards all my work. For providing me with the necessary resources for the de-velopment of this thesis.
To my laboratory colleagues for the availability and transmitted knowledge. Par-ticularly to Jorge Fernandes and Paulo Santos for all the help and support I received for the preparation of this work.
To my true friend Maria for always being ready to help me and always encourage me to reach my goals. For the tireless support and for helping me get through the diffi-cult times along this journey. And especially for the fun times during our laboratory nights.
Abstract
The biogenic amines content in fish products has been widely studied due to their potential toxicity and possible indication of the spoilage degree of food. One particular amine, histamine, is behind several outbreaks of food poisoning, particularly in fish products. However, histamine alone appears to be insufficient to cause intoxications, being putrescine and cadaverine, potentiators agents that contribute to its toxicity.
Several methodologies have been studied and developed for determination of bi-ogenic amines in food products. Ion Mobility Spectrometry coupled with Multi Capil-lary Columns or Gas Chromatography offers a higher sensitivity and selectivity on com-plex biological matrices analysis, providing the monitoring of trace levels of volatile compounds.
The aim of this thesis is to evaluate Gas Chromatography coupled with Ion Mobil-ity Spectrometry as a tool for monitoring non-volatile amines emission from fish tissues matrices, allowing the detection and establishment of specific patterns of biogenic amines.
Samples of histamine dihydrochloride, putrescine, cadaverine, tyramine, trypta-mine, spertrypta-mine, spermidine and phenethylamine were analysed. Samples of atlantic bo-nito, atlantic horse mackerel and sardine were collected and analysed over time of four days to allow an assessment of fish spoilage. With the exception of histamine, it was possible to obtain an identifier pattern for all analysed amines. The presence of some amines was also observed in the fish samples spectra.
Keywords: Ion Mobility Spectrometry; Gas Chromatography; Biogenic Amine;
Resumo
O conteúdo de aminas biogénicas tem sido amplamente estudado no pescado de-vido à sua potencial toxicidade e possível indicação do grau de deterioração dos alimen-tos. Uma amina particular, a histamina, encontra-se na causa de vários casos de intoxi-cação alimentar, particularmente em produtos derivados do peixe. No entanto, a hista-mina isolada parece ser insuficiente para causar intoxicações, sendo a putrescina e a ca-daverina, agentes potenciadores que contribuem para a sua toxicidade.
Diversas metodologias foram estudadas e desenvolvidas para a determinação de aminas biogénicas em produtos alimentares. A Espectrometria de Mobilidade Iónica acoplada a Colunas Multicapilares ou a Cromatografia Gasosa oferece uma maior sensi-bilidade e seletividade na análise de matrizes biológicas complexas, fornecendo a moni-torização de níveis residuais de compostos voláteis.
O objetivo desta tese é avaliar a Cromatografia Gasosa acoplada à Espectrometria de Mobilidade Iónica como ferramenta de monitorização da emissão de aminas não vo-láteis a partir de matrizes de tecidos de peixes, permitindo a deteção e o estabelecimento de padrões específicos de aminas biogénicas.
Amostras de dicloridrato de histamina, putrescina, cadaverina, tiramina, tripta-mina, espertripta-mina, espermidina e feniletilamina foram analisadas. Amostras de sarda, ca-rapau e sardinha foram recolhidas e analisadas ao longo do tempo para permitir uma avaliação da degradação dos peixes. Com exceção da histamina, foi possível obter um padrão de identificação para todas as aminas analisadas. A presença de algumas aminas foi também observada nos espectros das amostras de peixes.
Palavras-chave: Espectrometria de Mobilidade Iónica; Cromatografia Gasosa;
Contents
1. INTRODUCTION ... 1
OBJECTIVES ... 2
2. BIOGENIC AMINES ... 3
2.1 GENERAL OUTLINE OF BIOGENIC AMINES ... 3
2.2 BIOGENIC AMINES PRODUCTION BY MICROORGANISMS ... 6
2.3 FACTORS INFLUENCING THE BIOGENIC AMINES FORMATION IN FOODS ... 7
2.4 TOXICOLOGY OF BIOGENIC AMINES ... 10
2.4.1 HISTAMINE TOXICITY ... 11
2.4.2 TYRAMINE TOXICITY ... 12
2.4.3 NITROSAMINES ... 13
2.5 BIOGENIC AMINES IN FISH AND FISHERY PRODUCTS ... 14
2.5.1 HISTAMINE FISH POISONING ... 16
2.5.2 HISTAMINE REGULATORY GUIDELINES FOR FISH ... 19
3 DETERMINATION OF BIOGENIC AMINES ... 21
3.1 QUANTITATIVE ANALYSIS FOR BIOGENIC AMINES ... 21
3.1.1 HIGH PERFORMANCE LIQUID CHROMATOGRAPHY ... 22
3.1.2 CAPILLARY ELECTROPHORESIS... 22
3.1.3 GAS CHROMATOGRAPHY AND THIN LAYER CHROMATOGRAPHY ... 23
3.1.4 ULTRA PERFORMANCE LIQUID CHROMATOGRAPHY ... 23
3.2 SEMI-QUANTITATIVE AND QUANTITATIVE ANALYSIS FOR HISTAMINE ... 23
3.2.1 COLORIMETRY ... 24
3.2.2 THIN LAYER CHROMATOGRAPHY METHODS ... 24
3.2.3 ENZYMATIC METHODS ... 25
3.2.4 IMMUNOENZYMATIC METHODS ... 26
4 ION MOBILITY SPECTROMETRY ... 29
4.1 WORKING PRINCIPLES ... 29
4.2 ION FORMATION ... 31
4.2.1 FORMATION OF REACTANT IONS ... 32
4.2.2 FORMATION OF PRODUCT IONS ... 34
4.3 GAS CHROMATOGRAPHY AND MULTI CAPILLARY COLUMN ... 36
4.4 GAS CHROMATOGRAPHY COUPLED WITH ION MOBILITY SPECTROMETRY ... 37
5 MATERIALS AND METHODS ... 41
5.1 MATERIALS ... 41
5.2 SAMPLE PREPARATION ... 42
5.2.1 DETECTION OF BIOGENIC AMINES ... 43
5.2.2 FRESH FISH DECOMPOSITION ... 44
5.2.3 CONTROL FISH SAMPLES ... 45
5.3 ANALYTICAL EQUIPMENT:MCC-IMS AND GC-IMS ... 45
5.4 MEASUREMENT METHODOLOGY ... 48
5.4.1 GAS FLOW RATES ... 50
5.4.2 HEADSPACE VOLUME ... 55
5.4.3 RUNNING TIME ... 55
5.4.4 DESIGN OF MEASUREMENT PROGRAMS ... 56
6 RESULTS AND DISCUSSION ... 61
6.1 DETECTION OF BIOGENIC AMINES ... 61
6.1.2 ION MOBILITY CONSTANT:BIOGENIC AMINES ... 66
6.2 FRESH FISH DECOMPOSITION ... 67
6.2.2 ION MOBILITY CONSTANT:BIOGENIC AMINES IN FISH ... 70
6.3 FISH CONTROL SAMPLES ... 73
7 CONCLUSIONS AND FUTURE PERSPECTIVES ... 79
List of Figures
FIGURE 2.1:MOST IMPORTANT BIOGENIC AMINES IN FOODS AND THEIR RELATIVE PRECURSORS... 5
FIGURE 2.2:FORMATION AND INACTIVATION OF HISTAMINE ... 12
FIGURE 3.1:REFERENCE COLOR SCALE FOR HISTAMINE (CONCENTRATIONS IN ΜG/ML) ... 24
FIGURE 3.2:SUMMARY OF KEY STEPS IN COMPETITIVE ELISA ... 26
FIGURE 3.3:THE FOUR PHASES OF FIA ... 27
FIGURE 4.1:SCHEMATIC OF A CLASSIC ION MOBILITY SPECTROMETER ... 30
FIGURE 4.2:SCHEMATIC DIAGRAM SHOWING THE COMPONENTS AND THE IONIZATION PROCESS OF AN IMS. ... 31
FIGURE 4.3:IMSPREDOMINANT IONIZATION (POSITIVE POLARIZATION) ... 33
FIGURE 4.4:A POSITIVE POLARITY MOBILITY SPECTRUM FOR 2-PENTANONE IN AIR. ... 35
FIGURE 4.5:3-DIMENSIONAL AND 2-DIMENSIONAL CHROMATOGRAM OBTAINED BY GC-IMS ... 37
FIGURE 4.6:THE TOPOGRAPHIC VIEW OF THE LAV SOFTWARE. ... 38
FIGURE 4.7:WINDOW OF THE GALLERY PLUGIN.. ... 39
FIGURE 4.8:WINDOW OF THE REPORTER PLUGIN ... 39
FIGURE 5.1:PHASES OF THE HEADSPACE VIAL ... 42
FIGURE 5.2:SCHEMATIC OF THE GC-IMS EQUIPMENT ... 46
FIGURE 5.3:MCC-IMS AND GC-IMS DEVICES (LEFT TO RIGHT) ... 48
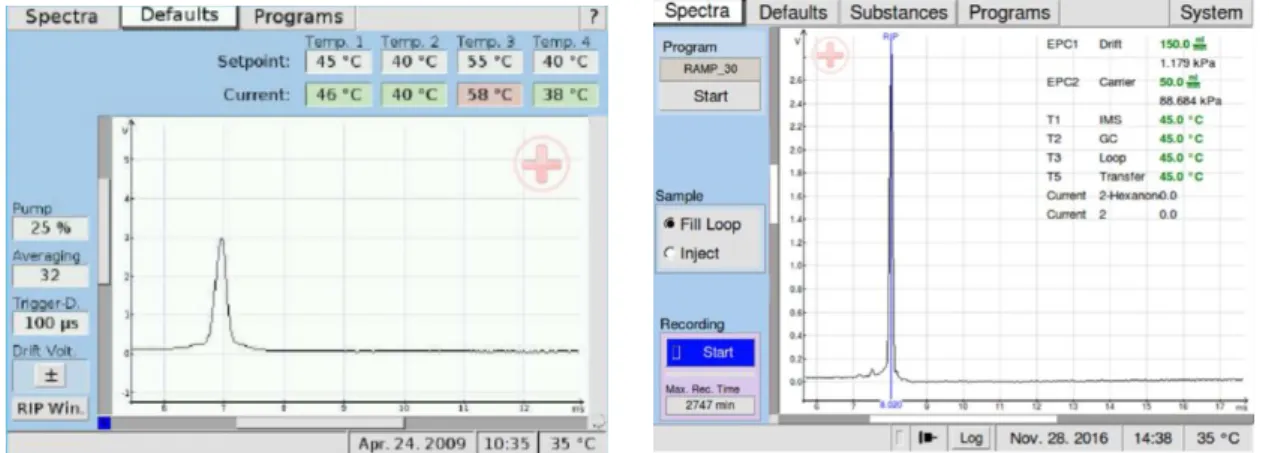
FIGURE 5.4:ZOOM IN OF THE DISPLAY OF THE DEFAULTS WINDOW FOR MCC-IMS AND GC-IMS DEVICES, RESPECTIVELY ... 48
FIGURE 5.5:ZOOMED SPECTRA OF PUTRESCINE MEASUREMENTS AT 23°C AND 40°C.VARIATION OF DRIFT GAS FLOW:(1)150 ML/MIN AND (2)500 ML/MIN.CARRIER GAS FLOW SELECTED WAS 50 ML/MIN.MEASUREMENTS ACQUIRED USING MCC-IMS DEVICE. ... 50
FIGURE 5.6:ZOOMED SPECTRA OF PUTRESCINE MEASUREMENTS AT 23°C AND 40°C.VARIATION OF DRIFT GAS FLOW:(1)150 ML/MIN AND (2)500 ML/MIN.CARRIER GAS FLOW SELECTED WAS 100 ML/MIN.MEASUREMENTS ACQUIRED USING MCC-IMS DEVICE. ... 51
FIGURE 5.8:ZOOMED SPECTRA OF CADAVERINE MEASUREMENTS AT 23°C AND 40°C.VARIATION OF
DRIFT GAS FLOW:(1)150 ML/MIN AND (2)500 ML/MIN.CARRIER GAS FLOW SELECTED WAS 50
ML/MIN.MEASUREMENTS ACQUIRED USING MCC-IMS DEVICE. ... 52
FIGURE 5.9:MEASUREMENTS OF THE ROOM AIR AND PURE CADAVERINE, AT AMBIENT TEMPERATURE
(23°C) AND 40°C FOR A DRIFT GAS FLOW OF 150 ML/MIN AND CARRIER GAS FLOW OF 50
ML/MIN.MEASUREMENTS ACQUIRED USING MCC-IMS DEVICE. ... 53
FIGURE 5.10:MEASUREMENTS OF THE ROOM AIR AND PURE PHENETHYLAMINE, AT AMBIENT
TEMPERATURE (23°C) AND 40°C FOR A DRIFT GAS FLOW OF 150 ML/MIN AND CARRIER GAS
FLOW OF 50 ML/MIN.MEASUREMENTS ACQUIRED USING MCC-IMS DEVICE. ... 54
FIGURE 5.11:MEASUREMENTS OF THE ROOM AIR AND PURE SPERMIDINE, AT AMBIENT TEMPERATURE
(23°C) FOR A DRIFT GAS FLOW OF 150 ML/MIN AND CARRIER GAS FLOW OF 50 ML/MIN.
MEASUREMENTS ACQUIRED USING MCC-IMS DEVICE. ... 54
FIGURE 6.1:MEASUREMENTS OF THE ROOM AIR AND CADAVERINE, AT AMBIENT TEMPERATURE (23°C)
AND 40°C FOR A DRIFT GAS FLOW OF 150 ML/MIN AND CARRIER GAS FLOW OF 50 ML/MIN.
MEASUREMENTS ACQUIRED USING GC-IMS DEVICE... 62
FIGURE 6.2:MEASUREMENTS OF THE ROOM AIR AND PHENETHYLAMINE, AT AMBIENT TEMPERATURE
(23°C) AND 40°C FOR A DRIFT GAS FLOW OF 150 ML/MIN AND CARRIER GAS FLOW OF 50
ML/MIN.MEASUREMENTS ACQUIRED USING GC-IMS DEVICE. ... 62
FIGURE 6.3:MEASUREMENTS OF THE ROOM AIR AND PUTRESCINE, AT AMBIENT TEMPERATURE (23°C)
AND 40°C FOR A DRIFT GAS FLOW OF 150 ML/MIN AND CARRIER GAS FLOW OF 50 ML/MIN.
MEASUREMENTS ACQUIRED USING GC-IMS DEVICE... 63
FIGURE 6.4:MEASUREMENTS OF THE ROOM AIR AND HISTAMINE, AT AMBIENT TEMPERATURE (23°C)
AND 40°C FOR A DRIFT GAS FLOW OF 150 ML/MIN AND CARRIER GAS FLOW OF 50 ML/MIN.NO
DIFFERENCES WERE OBSERVED BETWEEN ROOM AIR SPECTRUM AND HISTAMINE SPECTRUM.
THUS, IT WAS NOT POSSIBLE TO CHARACTERIZE THE BA HISTAMINE.MEASUREMENTS ACQUIRED
USING GC-IMS DEVICE. ... 63
FIGURE 6.5:MEASUREMENTS OF THE ROOM AIR AND SPERMIDINE, AT AMBIENT TEMPERATURE (23°C)
AND 40°C FOR A DRIFT GAS FLOW OF 150 ML/MIN AND CARRIER GAS FLOW OF 50 ML/MIN.
MEASUREMENTS ACQUIRED USING GC-IMS DEVICE... 64
FIGURE 6.6:MEASUREMENTS OF THE ROOM AIR AND SPERMINE, AT AMBIENT TEMPERATURE (23°C)
AND 40°C FOR A DRIFT GAS FLOW OF 150 ML/MIN AND CARRIER GAS FLOW OF 50 ML/MIN.
MEASUREMENTS ACQUIRED USING GC-IMS DEVICE... 64
FIGURE 6.7:MEASUREMENTS OF THE ROOM AIR AND TRYPTAMINE, AT AMBIENT TEMPERATURE (23°C)
AND 40°C FOR A DRIFT GAS FLOW OF 150 ML/MIN AND CARRIER GAS FLOW OF 50 ML/MIN.
MEASUREMENTS ACQUIRED USING GC-IMS DEVICE... 65
FIGURE 6.8:MEASUREMENTS OF THE ROOM AIR AND TYRAMINE, AT AMBIENT TEMPERATURE (23°C)
AND 40°C FOR A DRIFT GAS FLOW OF 150 ML/MIN AND CARRIER GAS FLOW OF 50 ML/MIN.
MEASUREMENTS ACQUIRED USING GC-IMS DEVICE... 65
FIGURE 6.9:MEASUREMENTS OF SARDA SARDA SAMPLE 1, AT AMBIENT TEMPERATURE (23°C) FOR A
RED AND WHITE RECTANGLES CORRESPOND TO AMMONIA,CAD,PEA,SPD AND SPM, AND TRP
AND TYR, RESPECTIVELY.MEASUREMENTS ACQUIRED DURING THE THREE DAYS AFTER FISH
PURCHASE, AT THE SAME TIME OF DAY, USING GC-IMS DEVICE. ... 69
FIGURE 6.10:MEASUREMENTS OF TRACHURUS TRACHURUS SAMPLE 1, AT AMBIENT TEMPERATURE
(23°C) FOR A DRIFT GAS FLOW OF 150 ML/MIN AND CARRIER GAS FLOW OF 50 ML/MIN.GREEN,
YELLOW, PINK AND RED RECTANGLES CORRESPOND TO AMMONIA,CAD,PEA AND,SPD AND SPM,
RESPECTIVELY.MEASUREMENTS ACQUIRED DURING THE THREE DAYS AFTER FISH PURCHASE, AT
THE SAME TIME OF DAY, USING GC-IMS DEVICE. ... 69
FIGURE 6.11:MEASUREMENTS OF SARDINA PILCHARDUS SAMPLE 1, AT AMBIENT TEMPERATURE (23°C)
FOR A DRIFT GAS FLOW OF 150 ML/MIN AND CARRIER GAS FLOW OF 50 ML/MIN.GREEN AND
YELLOW RECTANGLES CORRESPOND TO AMMONIA AND CAD, RESPECTIVELY.MEASUREMENTS
ACQUIRED DURING THE THREE DAYS AFTER FISH PURCHASE, AT THE SAME TIME OF DAY, USING
GC-IMS DEVICE. ... 70
FIGURE 6.12:FIRST DAY MEASUREMENTS OF ALL THREE SPECIES (SAMPLE 1), AT AMBIENT
TEMPERATURE (23°C) FOR A DRIFT GAS FLOW OF 150 ML/MIN AND CARRIER GAS FLOW OF 50
ML/MIN.THE SIGNALS OF ROOM AIR ARE IDENTIFIED BY ORANGE RECTANGLES, WHILE FISH
CHARACTERISTIC COMPOUNDS ARE WITHIN GREEN RECTANGLES.MEASUREMENTS ACQUIRED
USING GC-IMS DEVICE. ... 71
FIGURE 6.13:SECOND DAY MEASUREMENTS OF ALL THREE SPECIES (SAMPLE 1), AT AMBIENT
TEMPERATURE (23°C) FOR A DRIFT GAS FLOW OF 150 ML/MIN AND CARRIER GAS FLOW OF 50
ML/MIN.THE SIGNALS OF ROOM AIR ARE IDENTIFIED BY ORANGE RECTANGLES, WHILE FISH
CHARACTERISTIC COMPOUNDS ARE WITHIN GREEN RECTANGLES.MEASUREMENTS ACQUIRED
USING GC-IMS DEVICE. ... 72
FIGURE 6.14:THIRD DAY MEASUREMENTS OF ALL THREE SPECIES (SAMPLE 1), AT AMBIENT
TEMPERATURE (23°C) FOR A DRIFT GAS FLOW OF 150 ML/MIN AND CARRIER GAS FLOW OF 50
ML/MIN.THE SIGNALS OF ROOM AIR ARE IDENTIFIED BY ORANGE RECTANGLES, WHILE FISH
CHARACTERISTIC COMPOUNDS ARE WITHIN GREEN RECTANGLES.MEASUREMENTS ACQUIRED
USING GC-IMS DEVICE. ... 72
FIGURE 6.15:FOURTH DAY MEASUREMENTS OF ALL THREE SPECIES (SAMPLE 1), AT AMBIENT
TEMPERATURE (23°C) FOR A DRIFT GAS FLOW OF 150 ML/MIN AND CARRIER GAS FLOW OF 50
ML/MIN.THE SIGNALS OF ROOM AIR ARE IDENTIFIED BY ORANGE RECTANGLES, WHILE FISH
CHARACTERISTIC COMPOUNDS ARE WITHIN GREEN RECTANGLES.MEASUREMENTS ACQUIRED
USING GC-IMS DEVICE. ... 73
FIGURE 6.16:MEASUREMENTS OF CONTROL SAMPLES T0 AND T4 OF SARDA SARDA(SAMPLE 1), AT
AMBIENT TEMPERATURE (23°C) FOR A DRIFT GAS FLOW OF 150 ML/MIN AND CARRIER GAS FLOW
OF 50 ML/MIN.MEASUREMENTS ACQUIRED USING GC-IMS DEVICE. ... 74
FIGURE 6.17:MEASUREMENTS OF CONTROL SAMPLES T7,T11 AND T13 OF SARDA SARDA(SAMPLE 1),
AT AMBIENT TEMPERATURE (23°C) FOR A DRIFT GAS FLOW OF 150 ML/MIN AND CARRIER GAS
FIGURE 6.18:MEASUREMENTS OF THE FIRST DAY OF FRESH FISH SAMPLE AND CONTROL SAMPLES T0
OF SARDA SARDA(SAMPLE 1), AT AMBIENT TEMPERATURE (23°C) FOR A DRIFT GAS FLOW OF 150
ML/MIN AND CARRIER GAS FLOW OF 50 ML/MIN.THE COMMON SIGNALS BETWEEN BOTH
SPECTRA ARE IDENTIFIED BY GREEN RECTANGLES.MEASUREMENTS ACQUIRED USING GC-IMS
DEVICE. ... 75
FIGURE 6.19:MEASUREMENTS OF THE EIGHTH DAY OF FRESH FISH SAMPLE AND CONTROL SAMPLES T7
OF SARDA SARDA(SAMPLE 1), AT AMBIENT TEMPERATURE (23°C) FOR A DRIFT GAS FLOW OF 150
ML/MIN AND CARRIER GAS FLOW OF 50 ML/MIN.THE COMMON SIGNALS BETWEEN BOTH
SPECTRA ARE IDENTIFIED BY GREEN RECTANGLES.MEASUREMENTS ACQUIRED USING GC-IMS
List of Tables
TABLE 2.1:MOST IMPORTANT EXOGENOUS AMINES AND NATURAL POLYAMINES, AND SOME
CHARACTERISTICS. ... 4
TABLE 2.2:LEVELS (MEAN VALUE, MG/KG) OF BAS IN RAW SARDINE AND LIGHT CURED RED HORSE MACKEREL. ... 15
TABLE 2.3:SCIENTIFIC NAMES, FREE HISTIDINE LEVELS AND MEAN ANNUAL PRODUCTION LEVELS FOR SOME FISH ASSOCIATED WITH HFP OR HIGH FREE HISTIDINE LEVELS ... 17
TABLE 2.4:COMMON SYMPTOMS OF SCOMBROID FISH POISONING ... 19
TABLE 4.1:TYPICAL CHARACTERISTICS OF SINGLE AND MULTI CAPILLARY COLUMN ... 36
TABLE 5.1:MATERIALS USED IN THE EXPERIMENTAL PROTOCOL ... 41
TABLE 5.2:STRUCTURAL PROPERTIES OF THE BIOGENIC AMINES ANALYSED... 43
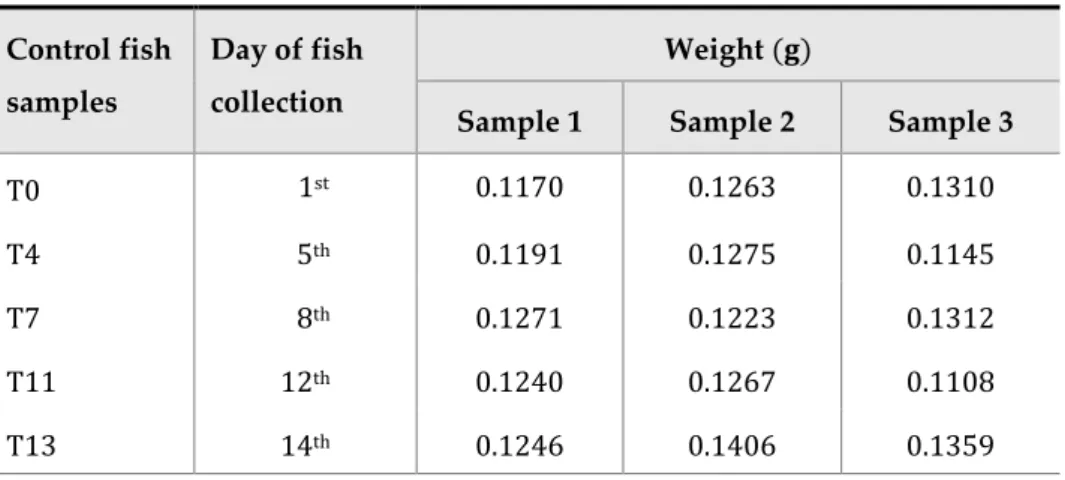
TABLE 5.3:SCIENTIFIC NAMES AND WEIGHTS OF THE FISH SPECIES ANALYSED ... 44
TABLE 5.4:WEIGHT OF ALL SAMPLES TAKEN FROM THE CONTROL SAMPLES ... 45
TABLE 5.5:DETAILED SPECIFICATIONS OF GC-IMS AND MCC-IMS ... 47
TABLE 5.6:BOILING POINTS AND VAPOUR PRESSURE OF THE ANALYSED BAS. ... 49
TABLE 5.7:DRIFT AND RETENTION TIMES OF THE PEAKS WITHIN THE YELLOW RECTANGLE OF FIGURE 5.9. ... 53
TABLE 5.8:PROGRAM USED ON MCC-IMS MEASUREMENTS FOR AMINES SAMPLES, USING PUMP ACTIVATION FOR A DRIFT GAS FLOW OF 500 ML/MIN AND CARRIER GAS FLOW OF 50 ML/MIN. .. 57
TABLE 5.9:PROGRAM USED ON MCC-IMS MEASUREMENTS FOR AMINES SAMPLES, USING PUMP ACTIVATION FOR A DRIFT GAS FLOW OF 150 ML/MIN AND CARRIER GAS FLOW OF 50 ML/MIN. .. 57
TABLE 5.10:PROGRAM USED ON MCC-IMS MEASUREMENTS FOR AMINES SAMPLES, USING SYRINGE INJECTION METHODOLOGY. ... 57
TABLE 5.11:HEADSPACE VOLUMES USED FOR BAS MEASUREMENTS ACCORDING TO EACH SAMPLE. .... 58
TABLE 5.12:PROGRAM USED ON GC-IMS MEASUREMENTS, FOR BAS SAMPLES. ... 59
TABLE 5.13:PROGRAM USED ON GC-IMS MEASUREMENTS, FOR FISH TISSUES SAMPLES. ... 59
TABLE 6.1:DRIFT AND RETENTION TIMES OF THE PEAKS WITHIN THE YELLOW RECTANGLE OF FIGURES 6.1-6.8, BEING 𝑡𝑑𝑟𝑖𝑓𝑡𝑝𝑜𝑠𝑖𝑡𝑖𝑜𝑛 THE DRIFT POSITION RELATIVE TO RIP,𝑡𝑑THE DRIFT TIME AND 𝑡𝑟 THE RETENTION TIME. ... 61
TABLE 6.3:MOLECULAR WEIGHTS AND BOILING POINTS OF AMMONIA,DMA AND TMA ... 67
TABLE 6.4:IDENTIFICATION OF PEAKS AND DRIFT AND RETENTION TIMES FOR TRACES FOUND IN FISH,
BEING 𝑡𝑑𝑟𝑖𝑓𝑡𝑝𝑜𝑠𝑖𝑡𝑖𝑜𝑛 THE DRIFT POSITION RELATIVE TO RIP,𝑡𝑑THE DRIFT TIME AND 𝑡𝑟 THE RETENTION TIME. ... 68
TABLE 6.5:ION MOBILITY CONSTANT FOR THE COMPOUNDS DETECTED IN ALL FISH SPECIES (TABLE
6.4). ... 70
TABLE 6.6:DRIFT AND RETENTION TIMES FOR TRACES FOUND IN FIGURE 6.18 WITHIN GREEN
RECTANGLES, BEING 𝑡𝑑𝑟𝑖𝑓𝑡𝑝𝑜𝑠𝑖𝑡𝑖𝑜𝑛 THE DRIFT POSITION RELATIVE TO RIP,𝑡𝑑THE DRIFT TIME AND 𝑡𝑟 THE RETENTION TIME. ... 76 TABLE 6.7:DRIFT AND RETENTION TIMES FOR TRACES FOUND IN FIGURE 6.19 WITHIN GREEN
RECTANGLES, BEING 𝑡𝑑𝑟𝑖𝑓𝑡𝑝𝑜𝑠𝑖𝑡𝑖𝑜𝑛 THE DRIFT POSITION RELATIVE TO RIP,𝑡𝑑THE DRIFT TIME AND 𝑡𝑟 THE RETENTION TIME. ... 76 TABLE 6.8:ION MOBILITY CONSTANT FOR THE COMMON COMPOUNDS DETECTED IN FRESH FISH SAMPLE
AND CONTROL SAMPLES T0(TABLE 6.6). ... 77
TABLE 6.9:ION MOBILITY CONSTANT FOR THE COMMON COMPOUNDS DETECTED IN FRESH FISH SAMPLE
Abbreviations
BA Biogenic Amine
CAD Cadaverine
CE Capillary Electrophoresis
DAO Diamine Oxidase
DMA Dimethylamine
FIA Flow Injection Analysis
GC Gas Chromatography
GC-IMS Gas Chromatography coupled with Ion Mobility Spectrometry
GC-MS Gas Chromatography coupled with Mass Spectrometry
HDC Histidine Decarboxylase
HFP Histamine Fish Poisoning
HIS Histamine
HMT Histamine N-methyltransferase
HPLC High-performance Liquid Chromatography
HRP Horseradish Peroxidase
IMS Ion Mobility Spectrometry
LAB Lactic Acid Bacteria
MAO Monoamine Oxidase
MCC Multi Capillary Column
MCC-IMS Multi Capillary Column coupled with Ion Mobility Spectrometry
NDMA Nitrosodimethylamine
PEA Phenethylamine
PUT Putrescine
RIP Reactant Ion Peak
SPD Spermidine
SPM Spermine
TLC Thin Layer Chromatography
TRP Tryptamine
TYR Tyramine
UPLC Ultra Performance Liquid Chromatography
VOC Volatile Organic Compound
TLC Thin Layer Chromatography
Chapter
1
1.
Introduction
In the last decades the demand for foods of animal origin has been growing, forc-ing the suppliers to implement improved measures of control to guarantee the quality and safety of the consumer. The presence of biogenic amines (BAs) in food is of great concern to the food industry as, given the potential risk to health, there is a growing demand from consumers and control authorities to reduce the permitted limits of BAs in food and beverages.
To reduce risks to consumer’s health, the control of these compounds in food ma-trices has moved the scientific community to develop increasingly analytical techniques that enable them to be unambiguously identified and quantified and, therefore to enable the correct evaluation of the risk factors correlated with the intake of the product.
BAs are non-volatile amines formed through the decarboxylation of amino acids and are present in food, originating in food processing or storage, or naturally.
Many BAs have been found in fish, however only histamine, cadaverine, and pu-trescine have been found to be significant in fish safety and quality control. Usually the concentrations of BAs increase during spoilage, as a result of microbial concentrations and deterioration of sensory quality. Although important in many physiological func-tions, BAs’ consumption in high concentrations should be avoided given the toxicologi-cal problems that may arise [1].
Despite the reported association between histamine and scombroid food poison-ing, histamine alone is insufficient to cause toxicity. Other BAs such as putrescine and cadaverine also contribute to potentiate histamine toxicity. Cadaverine however also plays a role on the index of the initial stage of fish decomposition [2].
producing BAs to study some of their formation pathways [3]. Along with the develop-ment of these techniques, the separation and quantification of BAs has been studied and reported. Their analysis in foods is usually performed by chromatographic techniques. However, the analytical determination of these amines is not simple due to the enor-mous complexity of the matrices to be analysed.
Objectives
The main objective of this work was to validate the experimental method and pro-tocol to analyse the volatile organic compounds (VOCs) of biological origin. More pre-cisely BAs present in fish. This protocol was previously developed in the project “3Qs for quality - Development of new devices and techniques for seafood quality assess-ment”, PTDC/MAR-BIO/6044/2014, financed by Foundation for Science and Technology of Portugal.
Chapter
2
2.
Biogenic Amines
2.1
General outline of biogenic amines
Biogenic amines are nitrogenous organic bases characterized by the presence of at least one amino group in their molecular structure, which can be formed and degraded during the normal metabolism of microorganisms, animals and plants. Hence, are usu-ally produced by the decarboxylation of amino acids, having two possible biochemical pathways. BAs can be either catalysed by exogenous enzymes produced by several dif-ferent microorganisms under favourable conditions or by endogenous amino acid de-carboxylases that naturally occur in animal or vegetable cells [4].
Being amines, they can be derived from ammonia, NH3, in which the three
hydro-gen atoms can be replaced by one, two or three radicals, resulting, respectively, in pri-mary, secondary or tertiary amines. The carboxylic group, characteristic of amino acids, is absent in amines so that they behave as cations when in physiological pH values [5]. BAs can be aliphatic (putrescine, cadaverine, spermine, spermidine), aromatic (tyra-mine, phenethylamine) or heterocyclic (hista(tyra-mine, tryptamine) [6].
The BAs histamine, tyramine, tryptamine, putrescine and cadaverine play an im-portant role in metabolic activity and growth of living cells. They are mainly formed from the bacterial decarboxylation of precursor amino acids, respectively from the free amino acids histidine, tyrosine, tryptophan, ornithine and lysine [12]. Tyramine, putres-cine and cadaverine can also be used as indicators of the degree of food spoilage and biological decomposition [6].
In food, the most biologically active amines and the relative precursors are hista-mine, tyrahista-mine, tryptahista-mine, putrescine, cadaverine and phenethylahista-mine, and are known as exogenous BAs (Table 2.1 and Figure 2.1). Natural polyamines spermidine and spermine represent the physiologically natural endogenous amines, being associ-ated not with the microbial decarboxylase activity as expected but with the incorpora-tion of aminopropyl groups into their precursor putrescine. Both exogenous BAs and polyamines are present in several types of foods with a variable range of concentrations [11].
Table 2.1: Most important exogenous amines and natural polyamines, and some characteristics. BA/Natural
polyamine
Precursor Chemical structure Molecular
Formula
Molecular
Weight/g mol-1
Histamine Histidine C5H9N3 111.148
Tyramine Tyrosine C8H11NO 137.182
Tryptamine Tryptophan C10H12N2 160.216
Putrescine Ornithine C4H12N2 088.154
Cadaverine Lysine C5H14N2 102.181
Spermidine Putrescine C7H19N3 145.250
Spermine Putrescine C10H26N4 202.346
Phenethyla-mine
2.2
Biogenic amines production by microorganisms
Biogenic amines can be found in a variety of foods, beverages and fermented foods such as fish and fish products, meat and meat products, eggs, cheeses, fermented vege-tables, fruits, beers and wines, and are mainly formed by microbial decarboxylation of amino acids and transamination of aldehyde and ketones [6].
Amines and related compounds are constantly present in food either naturally or as a product of storage or processing. Their concentrations generally increase during spoilage, which can be associated with increases in microbial concentrations and there-fore deterioration of sensorial quality. However, BAs can also be produced by the decar-boxylase activity of certain microorganisms, which will influence the type and amount of BAs formed in each type of food [1]. Amino acid decarboxylases have been found in species of the genera Bacillus, Pseudomonas, Photobacterium, as well as in genera of the
family Enterobacteriaceae, such as Citrobacter, Klebsiella, Escherichia, Proteus, Salmonella
and Shigell, and Micrococcaceae, such as Staphylococcus, Micrococcus and Kocuria. Lactic
acid bacteria (LAB) belonging to the genera Lactobacillus, Enterococcus, Carnobacterium, Pediococcus, Lactococcus and Leuconostoc are also able to decarboxylate amino acids, being
producers of tyramine, phenethylamine, cadaverine and putrescine [13]. Tyramine is also associated with Gram-positive microorganisms where species belonging to the ge-nus Enterococcus are recognized as the most efficient tyramine producers [11].
The production of histamine, being one of the most biological active amines and thus with the major impact in food’s spoilage, is of highest interest. Histamine formation results generally from microbial growth and proliferation of histamine-producing bac-teria, being the family Enterobacteriaceae reported as the most significant. Other micro-organisms such as Clostridium perfringens, Vibrio alginolyticus, Vibrio anguillarum, Acineto-bacter lowffi, Plesiomonas shigelloides, Pseudomonas spp., Aeromonas spp., Photobacterium
spp., Stenotrophomonas maltophilia, Morganella morganii, Klebsiella pneumoniae, Raoultella
planticola and Hafnia alvei also play an active role as histamine producers [14][15][16].
2.3
Factors influencing the biogenic amines formation in foods
Several intrinsic and extrinsic factors have a significant role in the formation of BAs. In food products, the content of BAs depends strongly on the nature of the product, the availability of free amino acids, the environmental conditions and the microorgan-isms present.
Being BAs mainly formed by microbial decarboxylation of amino acids and the corresponding amino acids precursors, essentially three conditions are necessary: fa-vourable conditions for bacterial growth, decarboxylase synthesis and decarboxylase ac-tivity; presence of decarboxylase-positive microorganisms; and availability of free amino acid, not necessarily leading to amine formation [18].
Free amino acids can either occur in foods or be formed through proteolysis, a process characterized by the breakdown of proteins by proteolytic enzymes, if partial into peptides, and complete, into amino acids. Hence, microorganisms with high prote-olytic enzyme activity increase the risk of BAs production in foods, by increasing the availability of free amino acids [18].
BAs content and accumulation in food may vary depending on various factors such as temperature, pH, salt (NaCl) concentration, oxygen supply and redox potential, water activity (𝑎𝑤), storage time, preservatives, and preservation processes. However,
the first four have the major impact affecting microbial activities in foods by influencing the metabolisms of microbial cells and the activity of decarboxylase enzymes [11].
Temperature
Each decarboxylating microorganism and microbial species have an ideal temper-ature that leads to optimum growth values, and hence increasing cell metabolism and proliferation. Consequently, also the production and accumulation of BAs is verified. However, the optimum conditions for cell growth and proliferation do not necessarily match the conditions for BAs production [19].
A temperature between 20°C and 37°C is ideal for the growth of most decarboxy-lating microorganism and decreased temperature stops their growth [18]. For example, a strain characteristic of a tyramine producer of Enterococcus faecalis was inoculated in
20°C, the optimum activity of the decarboxylating enzyme was detected at 37°C. Such facts indicate that under the severe cells conditions the tyrosine decarboxylase is more active and thus requires additional energy to induce tyrosine production under stress conditions [20]. Other example involves a study conducted on histidine decarboxylase of a Streptococcus thermophilus which reached its maximum activity at 40°C, while the BA
accumulation was insignificant at 20°C and at 25°C within the incubation period applied [21].
Regarding raw material such as milk and cheese, thermal treatments can be ap-plied to help eliminate the wild decarboxylating microbiota. While LAB are more resili-ent and require additional thermal treatmresili-ents, the Gram-negative BA producers (resili-enter- (enter-obacteria and pseudomonads) are quickly inactivated by temperatures higher than 60°C. Hence, typically cheeses made from pasteurized milk are characterized by presenting a lower BA amount [21].
pH
The decarboxylase activity is usually induced by the presence of precursor amino acids and at an acidic (low) pH, being the optimum pH between 4.0 and 5.5 [18]. There-fore, the higher the content of precursors in foods, the more susceptible they are to BA accumulation, and a decrease of pH leads to an increasing decarboxylase activity of bteria. However, although an acidic pH may contribute to the bacterial decarboxylase ac-tivity, an acidification in food fermentation can prevent contaminant bacteria and con-sequently the formation of biogenic amines [11][22].
For example, in two tyrosine decarboxylases from strains of Enterococcus faecalis
and Enterococcus faecium the optimum pH value for the decarboxylase activity was 5.5
and 6, respectively [23]. Other study reports that the histidine decarboxylase of a strain of Streptococcus thermophilus reached its optimum pH at 4.5 [24].
Salt concentration
In foods, increasing salt concentrations contribute significantly to the reduction of the metabolic activities of decarboxylating microorganisms and therefore decrease the production and accumulation of BAs. However, the amount of NaCl used for a better control of BAs production is often too high [21][24].
The tyramine production was studied in Enterococcus faecium and Enterococcus fae-calis strains in buffered systems containing tyrosine. While the enzymatic activity of
En-terococcus faecium strain remained constant independently of salt concentration, in
Enter-ococcus faecalis the same activity did not change significantly until an increase of NaCl
concentration up to 15% [20].
In fermented sausages inoculated with an Enterococcus faecalis strain, even in the
presence of low salt amounts, the production of cadaverine and putrescine by entero-bacteria was limited, resulting in a reduced accumulation of BAs. Also, an increase in salt concentrations reduced the concentration of tyramine and phenethylamine pro-duced by enterococci [25][26].
Several reports stablished that the presence of NaCl strongly inhibits the amine-forming microorganisms, however studies on specific decarboxylase activities report op-posing effects: while NaCl inhibits histidine decarboxylase, tyrosine decarboxylase ac-tivity is activated under salt concentrations [6][27].
Oxygen supply and redox potential
The presence of oxygen plays a significant role on BAs biosynthesis. Under anaer-obic conditions, Enterobacter cloacae only produces about half the quantity of putrescine
obtained under aerobic conditions and Klebsiella pneumoniae reduces significantly the
amount of cadaverine produced obtaining however the ability to synthesize putrescine [4].
The redox potential also appears to affect BAs production by some microorgan-isms [27]. Studies reported that histamine formation is also affected by the oxygen avail-able, where reducing the redox potential of the medium contributes to the production of histamine. Histidine decarboxylase activity of Proteus morganii appears to be inactivated
or destroyed in the presence of oxygen and is inhibited in atmospheres of 80% CO2
Usually, the production of BAs in food can be controlled by a strict use of good hygiene in both handling and processing of raw materials with the inhibition of spoiling microorganisms [6]. Specifically, fish decomposition can be avoided by correct handling practices such as icing or rapid immersion in water chilled to -1°C followed by nonstop frozen storage [30].
2.4
Toxicology of biogenic amines
The consumption of food containing high amounts of some BAs can have toxico-logical effects leading to several health issues due to toxicity, making it critical to moni-tor these compounds in foods [31].
Amino oxidases are the enzyme responsible for BAs detoxification, inducible in the presence of mono or diamines. The enzymes monoamine oxidase (MAO) and dia-mine oxidase (DAO) play a significant role in the detoxification process [6].
The mammals own an efficient detoxification system in the intestinal tract capable to metabolize the normal daily ingestion of BAs. In humans, under normal conditions, exogenous amines, absorbed from food and produced by the intestinal bacteria, are quickly converted in degradation products physiologically inactive by the action or con-jugation of amine oxidases. However, in allergic individuals, in the presence of amino oxidases (MAO and DAO) inhibitors or upon intake of high amounts of BAs in food, the detoxification process is interrupted, and biogenic amines accumulate in the organism, entering the bloodstream and hence, causing the body intoxication [6][32].
The toxicological levels of BAs are not easily established as they depend on several factors such as individual allergy, intake with food, presence of other amines and con-sumption of MAO inhibiting drugs and alcohol [6][21].
Based on histamine amounts found in food products involved in histamine poi-soning, levels above 500-1000 mg/kg of food are considered potentially hazardous to human health. However, some studies have suggested for histamine a legal upper limit of 100mg/kg of food and 2 mg/l of alcoholic beverage. Tyramine values of 100-800 mg/kg and phenethylamine values of 30 mg/kg have also been reported as toxic for the inges-tion of a normal poringes-tion of food (≈200 g) [4][33].
important to be aware that not all amines are equally toxic, being histamine, tyramine and phenethylaminethe BAs with higher levels of toxicity [6][32].
2.4.1
Histamine Toxicity
The most serious foodborne intoxications caused by BAs are usually related with high concentrations of histamine. Several outbreaks of histamine poisoning have oc-curred after ingesting different food products characterized by containing high levels of histamine such as fish and fish products, dairy products, meat and meat products, and alcoholic beverages such as wine and beer [32].
The main cause of the occurrence of histamine intoxication after food intake seems to lie in the inhibition of the enzymes responsible for histamine inactivation at the diges-tive tract, specifically DAO [17]. The gastro-intestinal tract is occupied of enzymes capa-ble of metabolizing the resulting histamine from food intake, preventing its absorption in its intact form and consequently blocking its entry into the circulatory chain. Hista-mineis formed by decarboxylation of L-histidine, catalysed by histidine decarboxylase (HDC), and is primarily metabolized by two major enzymes (Figure 2.1): the above-men-tioned DAO which converts the compound by deamination into imidazole acetaldehyde and histamine N-methyltransferase (HMT), which consequently converts histamine to methylhistamine, a compound that is subsequently metabolized by MAO with the for-mation of 1,4-methylimidazolacetic acid [34][35][36][37].
Figure 2.2: Formation and inactivation of histamine. Histamine is formed by decarboxylation of L-Histidine catalysed by HDC and can be inactivated by two major routes: methylation of the imidazole ring, catalysed by HMT, or oxidative deamination of the primary amino group, cata-lysed by DAO. Adapted from [34].
Histamine is considered the most toxic amine in food, exerting its toxicity through three types of receptors (H1, H2 and H3) present in cellular membranes. This amine acts
primarily on the cardiovascular system. Through the dilatation of peripheral blood ves-sels, high levels of histamine can cause hypotension, urticaria, flushing, and headache. Symptoms of histamine poisoning are in some cases similar to allergy symptoms includ-ing difficult breathinclud-ing, vomitinclud-ing, rash, itchinclud-ing, fever and hypertension [39][40]. In gen-eral, histamine intoxication has a relatively short incubation period, minutes to few hours after ingestion [41].
2.4.2
Tyramine Toxicity
The amines tyramine, tryptamine and phenethylamine are essentially vasoactive amines, causing peripheral vasoconstriction and an increase in the cardiac output, re-sulting in increased blood pressure [32].
implications when reacting with monoamine oxidase inhibitor (MAOI) leading to hy-pertensive crisis, also known as tyramine pressor response. The consumption of foods with high histamine content, such as fish and fish products, also contribute to this re-sponse. Although fresh fish contains low or no concentration of tyramine, high levels can be found in spoiled or fermented fish. Hypertensive crisis is characterized by an increased systolic blood pressure of 30 mmHg or more. It is believed that the cause for vasoconstriction and increased heart rate and blood pressure is the displacement of norepinephrine from neuronal storage vesicles due to the acute tyramine ingestion [42]. Norepinephrine, also called noradrenaline, is a catecholamine that functions predomi-nantly from the ends of sympathetic nerve fibers and acts to increase the rate and force of contraction of the heart, resulting in increased systemic blood pressure and coronary artery blood flow [43].
For adults, dietary tyramine levels of 100–800 mg/kg have been suggested as sat-isfactory, while higher than 1080 mg/kg is considered toxic [12]. Ingestions of 60 mg/kg of tyramine can cause migraine headache for patients receiving MAOI drugs, while 100– 250 mg/kg will originate a hypertensive crisis [6].
2.4.3
Nitrosamines
Although much less toxic than histamine and tyramine, some BAs such as putres-cine, cadaverine, spermine and spermidine, can react with nitrite to form nitrosamines and produce carcinogenic compounds [4]. Nitrosamines usually result from the interac-tion of secondary and tertiary amines with nitrite and nitrogen oxides during thestorage and conservation of foods [44].
Studies have reported that secondary amines such as dimethylamine (DMA) and tertiary amines such as trimethylamine (TMA) appear to be implicated in nitrosamine formation in fish and fish products [45]. It has been widely reported the production of nitrosodimethylamine (NDMA) due to reactions of DMA with nitrite in products such as salted, smoked, fermented, and canned fish [46][47].
involving foods contaminated with nitrosamines was reported. Domestic animals fed with fish meals preserved with nitrite were suffering from severe liver disorders. NDMA was later stated as the cause and it was suggested a possible reaction of the nitrite with DMA and TMA present in fish which resulted in NDMA production [44].
Concentrations of nitrosamines have been reported in several types of food. Amounts of nitrosamines of DMA, diethylamine, pyrrolidine and piperidine were found in fried foods. Under heating conditions, the BAs putrescine and cadaverine are con-verted to pyrrolidine and piperidine, respectively, from which N-nitroso-pyrrolidine and N-nitrosopiperidine are produced. Hence, several food processes, such as salting and smoking, appear to induce nitrosamines formation, while cooking (frying) rein-forces their formation [32].
Secondary amines such as agmatine and the polyamines spermine and spermidine contribute to the formation of carcinogenic nitrosamines, which occur widely in fish, meat and vegetable products.
2.5
Biogenic amines in fish and fishery products
The predominant factors in the production of BAs, after purchasing the fish, are the duration and temperature of storage. The temperature affects not only the formation of free amino acids post mortem, but also their fast decarboxylation. Thus, long storage
periods at high temperatures induce the production of BAs, ammonia and other result-ing compounds of fish degradation [10]. Other factors such as microflora and muscle type also influence the presence of BAs in fish [48].
During decomposition of fishery products, especially during storage at elevated temperatures (48˚C), various amounts of selected BAs are produced, depending on the fish species. Histamine, tyramine, putrescine and cadaverine are the most common BAs found in seafood associated with spoilage, in which histamine and tyramine are the most biologically active [39].
Most bacterial food pathogens from fishery products are aerobic and gram-nega-tive bacteria and belong to the genera Pseudomonas, Moraxella, Acinetobacter, Shewanella,
Aeromonadaceae (Aeromonas spp.), Flavobacterium and the Vibrionaceae families (Vibrio
and Photobacterium). The aforementioned microorganisms are the most common in fish,
Upon death, the defence mechanisms of fish are no longer preventing bacterial growth in the muscle tissue, and histamine forming bacteria may start to grow, resulting in the production of histidine and a subsequent increase of histamine levels above the al-lowable maximum level (set to 50 ppm by Food and Drug Administration) [2][49]. Therefore, during spoilage, certain bacteria produce decarboxylase enzymes, which act on free histidine in the fish muscle to form histamine. For instance, although Shewanella
putrefaciens and Pseudomonas aeruginosa are the prominent spoilage bacteria of fresh fish,
the mesophilic Vibrionaceae dominates at ambient temperature (25˚C) and fresh water. However, in polluted waters, the dominant spoilage bacteria family is the Enterobacte-riaceae[50].
Although many BAs have been found in fish produced post-mortem, such as
hista-mine, putrescine, cadaverine, spermidine and sperhista-mine, only the trio, histahista-mine, cadav-erine and putrescine, has been acknowledged as significant concerns regarding fish safety and quality, being histamine used as marker for the degradation of fish (Table 2.2). Trimethylamine, also identified during fish spoilage, is one of the main volatile amines produced by spoilage bacteria and is responsible by the characteristic fishy odour [49][51].
Table 2.2: Levels (mean value, mg/kg) of BAs in raw sardine and light cured red horse
macke-rel. Adapted from [2].
Fish Temperature/
time
Histamine Cadaverine Putrescine Spermidine Spermine Tyramine
Sardine 4˚C/0 days 19.5 3.9 13.4 1.2 0.0 0.0
4˚C/15 days 203.0 100.4 114.0 7.6 2.9 16.3
Light cured
horse
mackerel
- 21.3 244.4 64.5 0.2 0.0 62.8
Although some studies do not observe obvious differences in BAs levels in muscle from different parts of the fish, some have reported higher levels of spermidine in dark muscle and high levels of amines in the intestinal walls [52].
The levels of histidine and histamine spoilage were studied in 21 aquatic species. The conclusions reported that there was a higher histamine production in the red-mus-cled species, such as tuna and mackerel, than in white-musred-mus-cled species, such as rockfish. Also, higher concentrations of histidine were found in white when comparing with red muscle [48].
2.5.1
Histamine Fish Poisoning
Histamine fish poisoning (HFP), also known as scombroid fish poisoning, was first described in 1799 as a chemical intoxication caused by the consumption of bacterially contaminated or spoiled fish [53]. This intoxication is usually associated with large amounts of histamine in spoiled fish, levels equal to or greater than 50 mg/100g of fish, and possibly other BAs [39].
The term scombroid is derived from the Scomberesocidae and Scombridae fami-lies, which includes several fish species such as bonito, mackerel and tuna. Although histamine formation is mainly associated with the Scombridae family, certain types of non-scombroid fish are also implicated in fish poisoning, such as anchovies, herring, sardines and salmon. These fish species are characterized by a high level of free histidine in muscle tissues [54][55]. Table 2.5.1.1 lists fish species that have been associated with HFP or elevated levels of free histidine as well as the respective mean annual global production and levels of free histidine.
Although histamine is the main toxin involved in HFP, exogenous histamine from spoiled fish can be potentiated by the presence of other BAs such as cadaverine, putres-cine and tyramine. In scombroid species and other marine fish containing abundant en-dogenous histidine, histamine is manly formed by microbial action and not by endoge-nous histidine decarboxylase activity as expected [56]. The histidine can be catabolized by two metabolic pathways in the fish muscle: degradation via the urocanic acid path-wayor through decarboxylation to form histamine. The first is the main pathway under normal physiological conditions, but in post mortem conditions and in the case of
Table 2.3: Scientific names, free histidine levels and mean annual production levels for some
fish associated with HFP or high free histidine levels. Adapted from [42].
Market name Scientific name Histidine
levels
(mg/kg)
Mean annual
production
(tonne,
2006–2010) Family Genus and species
Anchovy Engraulidae
European Engraulis encrasicholus 6 210 534 483
South African Engraulis capensis 209 250
Japanese Engraulis japonicus 4 810 1 287 215
Stolephorus spp. 279 139
Bonito Scombridae
Dogtooth Tuna Gymnosarda unicolor 669
Plain Orcynopsis unicolor 759
Sarda spp. 62 215
Herring Clupeidae
Herring, Atlantic Clupea harengus 1 230-2 950 2 356 990
Herring, Araucanian Clupea bentincki 624 528
Herring, Pacific Clupea pallasii pallasii 306 839
Mackerel Scombridae
Mackerel, Atlantic Scomber scombrus 2 000-4 500 664 231 Mackerel, Chub Scomber japonicus 1 063-8 020 1 767 202 Mackerel, Blue Scomber australasicus 2600 10 364 Mackerel, Horse Trachurus japonicus 172-3 680 278 404 Pilchard or Sardine Clupeidae
Sardine, European Sardina pilchardus 2 888 1 101 842 Pilchard, Japanese or
South American or
Californian
Market name Scientific name Histidine
lev-els (mg/kg)
Mean annual
production
(tonne,
2006–2010) Family Genus and species
Salmon Salmonidae
Atlantic Salmon Salmo salar 130–300
Coho Salmon Oncorhynchus kisutch 219–970 Cherry Salmon Oncorhynchus masou 387–2 362 Pink Salmon Oncorhynchus gorbusvha 408–1 557 Tuna (Small) Scombridae
Bonito Auxis thazard 4 330–10 100
Skipjack Katsuwonus pelamis 13 400–20 000 2 529 408
Longtail Tuna Thunnus tonggol 11 540 239 661
Tuna (Large) Scombridae
Yellowfin Thunnus albacares 2 123–12 200 1 113 954
Southern Bluefin Thunnus maccoyi 6 670
Big-eye Tuna Thunnus obesus 7 450 412 616
Pacific Bluefin Tuna Thunnus orientalis 6 850–7 110
The increase in histamine production is also related to poor conservation condi-tions after fish capture, particularly when the fish is not conserved at low temperature, allowing the bacterial metabolism of histidine into histamine [52][58].
Some of the bacteria associated with histamine production are halotolerant (salt tolerant) or halophilic (salt loving). Other bacteria are more capable of forming histamine at an elevated acidity (low pH). As a result, histamine formation is possible through processes such as brining, salting, smoking, drying and fermenting. Refrigeration may contribute to the inhibition of histamine production during these processes [59].
minutes to 2 hours after the ingestion of the contaminated fish with scombroid toxins. Although symptoms may persist from 8 hours to several days, long-term sequelae are not known (Table 2.4). Thus, HFP is not considered to be fatal [42].
Although there are similarities regarding some symptoms caused by HFP and his-tamine intolerance, there are differences. Unlike hishis-tamine intolerance, in HFP other toxic decomposition products or components unique to fish may be involved in addition to histamine [55]. Furthermore, HFP may occur in individuals with a normal histamine degradation capacity and not only in histamine intolerant individuals [42].
Table 2.4: Common symptoms of scombroid fish poisoning [42].
Type Symptoms
Cardiovascular Flushing, rash (urticaria), hypotension, headache, tachycardia
Gastrointestinal Abdominal cramps, diarrhoea, vomiting
Neurological Pain, itching
Other Oral burning sensation, peppery taste, nausea, swelling of tongue
According to data from the period of 1998 to 2002 from the United States Centers for Disease Control and Prevention (CDC), 463 cases and no deaths were reported [60]. According to data from 1998 to 2008 from the Japanese Ministry of Health, Labour and Welfare, there were 1577 cases reported, 89 incidents and no deaths [42].
2.5.2
Histamine Regulatory Guidelines for Fish
Based on HFP cases reports, certain guidelines needed to be established regarding the acceptable histamine content of fish. Thus, essentially four thresholds have been sug-gested: <50 mg/kg for normal and safe consumption; 50–200 mg/kg, mishandled and possibly toxic, 200–1000 mg/kg, unsatisfactory and probably toxic; and >1000 mg/kg toxic and unsafe for human consumption [54].
Some BAs present in food such as putrescine and cadaverine inhibit histamine-detoxifying enzyme. Hence, there is a discrepancy in the toxic level of histamine in food due to the absence or presence of these. The European Community has proposed that the average content of histamine should not surpass 10-20 mg/100g of fish [6]. For regu-lation purposes, in fish and fish products, a limit of 300 mg/kg was stablished for the sum of histamine, putrescine and cadaverine [32].
In the European Union, under Commission Regulation (EC) No 1441/2007 of 5 De-cember 2007, was stablished that the average histamine content should be between 100-200 mg/kg for 9 samples per batch, and only two samples can present values within this range. These limits apply to fish species associated with a high histidine content, such as the families Scombridae, Clupeidae, Engraulidae, Coryfenidae, Pomatomidae and Scombresosidae [62].
Regarding fishery products which have undergone enzyme maturation treatment in brine, manufactured from the same fish species above listed, the same regulation es-tablished a range between 200-400 mg/kg for nine samples, where only two samples can present values within this range [62].
Chapter
3
3
Determination of Biogenic Amines
In the past few decades, the identification of BAs has been and remains one of the greatest challenges in food analysis. The development of analytical techniques for exam-ining and understanding the degradation of BAs is extremely important due to their potential toxicity and their possible use as food quality markers.
3.1
Quantitative analysis for biogenic amines
Several fluorometric techniques have been developed to analyse and measure his-tamine and with their evolution new procedures were studied and tested. However the detection and quantitative analysis of bioactive amines is not simple for several reasons: mainly because of their greater solubility in water than in the often-used organic solvents (as a result of the strong polar character of the compounds); the simultaneous presence of structurally different amines in the same extract; the extreme complexity of the matrix sample; the low concentrations of these compounds in the samples; the potential pres-ence of interfering compounds, such as various amino acids with structural similarities to amines; the absence of intrinsic properties of the compounds that enable their detec-tion directly by physicochemical methods of current applicadetec-tion (spectrophotometric, fluorometric or electrochemical methods) [63][64].
(HPLC). Due to the high number and variety of methods there is a need for methods better suited to high-speed screening [64].
3.1.1
High Performance Liquid Chromatography
Among these methods, HPLC is by far the mostly frequently reported technique for BAs separation and quantification. Over the years several different HPLC methods have been studied and proposed. After the amines extraction a derivatization is required which can be performed before or after the column separation, being the principal de-rivatives used dansylchloride and o-phthaldialdehyde (OPA). Afterwards the detection is done by fluorimetry. However not all HPLC methods require derivatization, using instead an ionic chromatography followed by an electrochemical detection or a diode array detector [65].
Due to low volatility and lack of chromophores, the HPLC method with Reversed-Phase separation makes use of detection schemes based on pre-column or post-column derivatization to produce strong chromophores [2][63].
Compared to GC and CE, HPLC offers disadvantages on the lack of efficiency due to low diffusion coefficients in liquid phase, causing slower diffusions of analytes in the stationary phase [66].
3.1.2
Capillary Electrophoresis
3.1.3
Gas Chromatography and Thin Layer Chromatography
Amines are difficult to analyse by GC due to their lack of volatility and their inter-action with the GC column which consequently, leads to significant tailing and poor reproducibility. However, GC methods can be cheaper and simpler to apply than HPLC equipment in some cases [49]. It is a reproducible and fast method where one extract analysis requires only 10 minutes without derivatization [65]. Although TLC is relatively simple and requires no special equipment, published methods take an excessive time for analysis and/or inaccuracy of the obtained results (semi-quantitative) [63].
3.1.4
Ultra Performance Liquid Chromatography
Since 2004, a new generation of stationary phases has emerged, capable of with-standing pressures (over 1000 bar), which when integrated into LC systems, the system is called Ultra Performance Liquid Chromatography (UPLC). UPLC systems, when com-pared to conventional HPLC equipment, are considered advantageous because of their ability for faster analysis with better efficiency, reduced solvents consumption and a bet-ter peaks resolution, without detriment to efficiency [68][69].
Along with chromatographic methods, also biochemical assays and immunoas-says are used in determination of BAs and have the advantage of being cheap, fast, sim-ple to perform and can be used outside the laboratory. However, semi-quantitative re-sults might be obtained and are often associated with a lack of specificity [10].
Despite the wide range of analytical methodologies already published and ap-plied, new methodologies are continuously being developed with the goal of achieving even higher levels in the double stranded quality of results versus ease and speed of execution.
3.2
Semi-quantitative and quantitative analysis for histamine
sensitive organ [65]. However, the analysis of this amine suffered an evolution in the applied methods for simpler and more convenient techniques such as colorimetry, TLC, enzymatic and immunoenzymatic methods, and flow injection analysis (FIA).
3.2.1
Colorimetry
To identify quickly and at low cost the presence of histamine in food, several meth-ods of colorimetry have been developed and applied. However, until 2004 the colori-metric assays then reported involved numerous steps such as extraction processes and the use of chromatographic purification of histamine and further coupling with diazo-nium salts [65]. The new colorimetric assay proposed has a simpler extraction procedure involving an interaction with the reaction of imidazole, a heterocyclic organic com-pound, which produces a quantitative colour reagent. From there, it is possible to estab-lish a reference colour scale (Figure 3.1) for a rapid estimation of histamine in food, par-ticularly on detection of histamine toxicity levels in fish [70]. This method has a quanti-tation limit of 10 mg/kg [65].
Figure 3.1: Reference colour scale for histamine (concentrations in μg/ml) [64].
3.2.2
Thin Layer Chromatography methods
TLC is considered a rapid method, with a migration time of only 2 hours allowing the analysis up to 8 samples per plate at a time, where two plates can be simultaneously placed in a migration container. This method does not require expensive material, being only needed a basic equipment for extraction, chromatographic plates, migration con-tainer and a densitometer for a quantitative determination [65].
certain reagents can be used such as ninhydrin, fluorescamine and o-diacetylbenzene [73]. Through comparison of the colour intensity of the revealed histamine in the sam-ples with histamine standards run at the same time on the chromatographic plate, a semi-quantitative detection is obtained. Histamine detection can also be quantitative with the use of a densitometer [65]. The detection threshold using TLC is of 100 mg/kg [74].
3.2.3
Enzymatic methods
This technique is based on the deamination of histamine. In the presence of oxy-gen, DAO deaminates histamine to form imidazole acetaldehyde, with a simultaneous production of hydrogen peroxide (H2O2) and ammonia (NH3). The released hydrogen
peroxide is then used to convert a reduced dye to its oxidized form with a colour devel-opment associated, through the action of the enzyme horseradish peroxidase (HRP) [75][76]. This reaction is the oxidation of leuco crystal violet, a colourless compound, to crystal violet, a purple compound [77].
Histamine + O2 DAO → H2O2+ NH3+ imidazole acetaldehyde (3.1) H2O2+ reduced dye HRP → H2O + oxidized dye (3.2)
The colour intensity is proportional to the amount of histamine and can be evalu-ated visually (qualitative detection) or by spectrometry (quantitative detection) [65]. The detection limit is 0.5 mg/kg and quantification limit is 1.5 mg/kg [74].
Several enzyme biosensors have been developed to simplify and reduce the dura-tion of the analytical measurements [78][79][80][81]. Also, a solid phase assay (test strip) was developed, based on the coupling of DAO to a peroxidase/dye system [76][82].
Although enzymatic assays are rapid methods with an incubation time ranging from 20 minutes to 2 hours, allowing the simultaneous analysis of several samples, the DAO enzyme can react with other BAs such as agmatine, putrescine and cadaverine when present at high levels [65]. Studies have also reported that these methods tend to overestimate histamine content at levels < 10 mg/kg [83].
3.2.4
Immunoenzymatic methods
Several immunoassays using monoclonal antibodies have been developed for his-tamine assessment in biological fluids. However, the application of such tests in food products is not easy due to lack of specificity and inadequate sensitivity. Thus, an im-munoassay using antibodies was developed for histamine determination in food. Anti-histamine monoclonal antibodies were produced and used to perform a competitive in-hibition ELISA (Figure 3.2) [84].
Figure 3.2: Summary of key steps in competitive ELISA. (1) Control antigen is absorbed onto well and a buffer containing an unrelated protein is used to block free sites in the wells; (2) Sample and detection antibody mix is added to wells; (3) Addition of enzyme conjugated with secondary detection antibody; (4) Substrate is catalysed by enzyme to generate coloured readout.The colour intensity is inversely proportional to the antigen amount in the sample. Adapted from [85].
More recently, numerous ELISA assays have been developed by companies which produce commercial kits for qualitative and/or quantitative analysis of histamine. Such analysis follows the successive steps: 1) Histamine extraction from the fish sample using an acidic solution or water followed by a filtration; 2) Reagents (which differ according to the kit) are added to form a histamine conjugate; 3) Competitive binding of histamine conjugate to the antibodies coated onto reaction tubes wells during the incubation time, followed by a washing; 4) Enzymatic reaction that causes a colour change, being the reaction duration dependent on the test used; 5) Quantitative results can be determined directly using a standard curve and qualitative results can be visually obtained by com-parison with standard colour charts [65].
3.2.5
Flow Injection Analysis
FIA is an analytical technique based on the injection of a liquid sample into a mov-ing, continuous carrier stream of a suitable liquid. The sample zone is then transported into a detector, responsible for recording the changes in absorbance, electrode potential, or other physical parameters resulted from the sample passage through the flow cell (Figure 3.3). A calibration curve is then produced to quantify the analyte in study [65][87].
Figure 3.3: The four phases of FIA [87].
The most rapid method for selective determination of histamine is based on FIA and is capable of screening 60 sample extracts/hour [88].
FIA methods using a fluorometric detection were developed to provide a fast screening of fish samples for histamine determination [89]. Although no sample prepa-ration is needed, FIA require a cautious selection of reagent concentprepa-rations and pumps control in order to assure specificity for the histamine derivative [90]. More recent FIA procedures have been developed for this screening, having a detection limit of 0.8 mg/kg and quantitation limit of 2.4 mg/kg [91].
Chapter
4
4
Ion Mobility Spectrometry
4.1
Working Principles
In the last decade new and innovative ion mobility spectrometry (IMS) applica-tions have emerged and have been used in quality control of toxic contaminants, bever-ages and food products. Among these are assessment of food freshness or the degree of spoilage of food products and detection of pathogenic micro-organisms or toxins such as the determination of volatile organic compounds of fish spoilage.
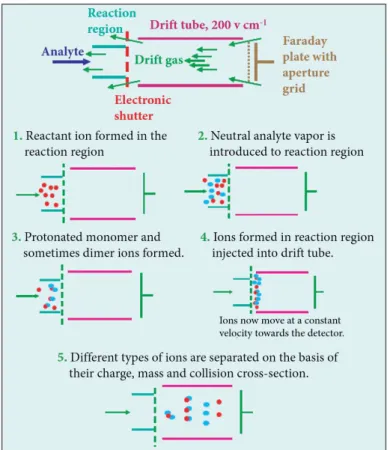
Being used for detection, identification and monitoring of trace levels of chemical compounds in different matrices, IMS is an analytical technique of ion separation based on the differences of ion mobilities in a drift tube with a defined electric field. This sep-aration is based on the specific drift times, that ionized compounds take to travel a fixed distance under an electric field (𝐸) [95]. When reaching the equilibrium, the ions move with a constant drift velocity (𝑣𝑑) proportional to the electric field and in the same
direc-tion. Due to the relation between these two components it is possible to extract an inde-pendent component for each ion, ion mobility 𝐾 (Equation 4.1) [96].
𝐾 =𝑣𝐸 =𝑑 𝑡𝐿 𝑑𝐸 =
𝐿2
𝑡𝑑𝑈 (4.1)
Drift velocity is expressed in cm2s−1 and the electric field is in Vcm−1, hence the
ion mobility 𝐾 is expressed in cm2V−1s−1. 𝐿 is the length of the drift tube, expressed in cm, 𝑡𝑑 the drift time expressed in s and 𝑈 the drift potential difference in V.
Ion mobility depends on the collision frequency, being susceptible to both pressure and temperature. Therefore, by normalizing to the standard pressure and temperature we get the reduced ion mobility 𝐾0 (Equation 4.2).
𝐾0= 𝐾 (𝑃𝑃 0) (
𝑇0
𝑃 and 𝑇 represent the values of pressure and temperature during the experiment and in standard conditions 𝑃0= 760 Torrand 𝑇0= 273.15 K. Thus the reduced ion
mo-bility 𝐾0is a substance’s specific value, being independent of instrumental or
environ-mental parameters [96].
The classic ion mobility spectrometer consists of a segmented drift tube, con-structed of alternating insulating and conducting rings, along which an electric field is applied (Figure 4.1). As the ions travel through the tube, they interact with a drift gas, mainly air at atmospheric pressure or pure nitrogen. The slow collisions with the drift gas molecules are more frequent for sterically demanding structures. Therefore, the drift time of each substance is determined by its geometric structure and ion mass in the drift. Thus, ions are separated not only according to their mass but also due to their size, spa-tial structure and internal charge distribution. The resulting ion current is measured by an electrometer as a function of time [95][97].
IMS technology has the advantage of being easily coupled to other analytical de-vices such as gas chromatograph or liquid chromatography for pre-separation of com-plex sample matrices. IMS systems are equipped with gas chromatographic columns, providing compound selectivity. IMS is an extremely sensitive technique that can ana-lyse a multiplicity of compounds at low concentrations with detection limits typically in the low ppb-range or even ppt-range [97].

![Table 4.1: Typical characteristics of single and multi capillary column. Adapted from [107]](https://thumb-eu.123doks.com/thumbv2/123dok_br/16547358.737003/56.892.194.653.679.945/table-typical-characteristics-single-multi-capillary-column-adapted.webp)
![Figure 4.5: 3-dimensional and 2-dimensional chromatogram obtained by GC-IMS. Adapted from [109]](https://thumb-eu.123doks.com/thumbv2/123dok_br/16547358.737003/57.892.161.757.703.1052/figure-dimensional-dimensional-chromatogram-obtained-gc-ims-adapted.webp)