ABSTRACT: Introduction: Functionality in aging is associated with the autonomy and independence of older people. Objective: To identify and hierarchize the difficulties reported by older adults in performing activities of daily living. Method: This is a cross-sectional, descriptive, household-based study that used the Health, Well-being, and Aging Study (Saúde, Bem-Estar e Envelhecimento - SABE) database of 2000, 2006, and 2010. We evaluated the functionality using reports on the difficulty in performing basic and instrumental activities of daily living (ADL and IADL, respectively). The Guttman scaling assessed the hierarchy of functional impairment. Results: The prevalence of reported difficulty in performing one or more IADLs was 35.4, 45.8, and 41.0%; while for ADLs, it was 16.3, 13.3, and 17.5%, in 2000, 2006, and 2010, respectively. In ten years of follow-up, the variability in prevalence among women ranged from 42.3 to 54.6% for IADL impairment, and 17.0 to 20.4% for ADL. For men, it varied from 25.6 to 33.1% for IADL impairment, and 8.0 to 13.7% for ADL. In the three waves, the activities with the highest reported difficulty were using transportation, performing heavy tasks, and managing finances, while feeding was the least prevalent. Conclusion: The prevalence of functional impairment increased in ten years, with higher variability among women and with advancing age. These results contribute to the planning of services and adequate distribution of existing resources as they reveal the needs and care required.
Keywords: Aged. Activities of daily living. Frail elderly.
Performance pattern of activities
of daily living for older adults in the city
of São Paulo in 2000, 2006, and 2010
Padrão do desempenho nas atividades de vida diária em
idosos no município de São Paulo, nos anos 2000, 2006 e 2010
Daniella Pires NunesI , Tábatta Renata Pereira de BritoII, Karla Cristina GiacominIII,
Yeda Aparecida de Oliveira DuarteIV, Maria Lúcia Lebrão (in memoriam)V
ISchool of Nursing, Universidade Federal do Tocantins – Palmas (TO), Brazil. IISchool of Nutrition, Universidade Federal de Alfenas – Alfenas (MG), Brazil. IIIMunicipal Secretariat of Health of Belo Horizonte – Belo Horizonte (MG), Brazil. IVSchool of Nursing, Universidade de São Paulo – São Paulo (SP), Brazil. VSchool of Public Health, Universidade de São Paulo – São Paulo (SP), Brazil.
Corresponding author: Daniella Pires Nunes. Laboratório de Fundamentos de Enfermagem, Complexo Laboratorial IV, Universidade Federal do Tocantins, sala 2, Avenida NS 15, Norte, 109, Plano Diretor Norte, CEP: 77001-090, Palmas, TO, Brasil. E-mail: [email protected]
Conflict of interests: nothing to declare – Financial support: Research Support Foundation of the State of São Paulo (Fundação de Amparo à Pesquisa do Estado de São Paulo - FAPESP).
INTRODUCTION
Functional capacity or functionality can be defined as a set of behavioral compe-tencies related to the administration and management of daily life, involving physi-cal integrity, cognitive status, self-regarding actions, emotional state, and running of everyday life in the performance of activities and social roles1. In practice, the
func-tionality of older people is assessed, in most cases, based on their difficulty (reported or observed) in performing basic and instrumental activities of daily living (ADL and IADL, respectively).
ADLs relate to an individual’s self-care capacity, involving the performance of activities such as bathing/showering, dressing, toileting, transferring, ambulating, and feeding from a plate placed in front of the person. IADLs require the active participation of older adults in the community and/or their ability to live alone, including activities such as preparing meals, taking medicines, shopping, managing finances, using the telephone, performing light and heavy household tasks, and using transportation2.
The proper performance of these activities involves cultural and learning aspects, and demands organized locomotor skills and preserved neurological function3,4. The more
com-plex the activity, the greater the need for adjustment, integration, and harmony between the main functional domains (cognition, mood, mobility, and communication)4.
Therefore, beyond the control of chronic conditions, functional capacity must guide the development and adequacy of public policies aimed at this age group5.
ReSUMO: Introdução: A funcionalidade no envelhecimento está associada à autonomia e independência das pessoas idosas. Objetivo: Identificar e hierarquizar as dificuldades referidas no desempenho das atividades de vida diária de idosos. Método: Estudo transversal e descritivo, de base domiciliar, que utilizou a base de dados do Estudo SABE (Saúde, Bem-Estar e Envelhecimento) nos anos de 2000, 2006 e 2010. A funcionalidade foi avaliada por meio do relato de dificuldade no desempenho das atividades básicas (ABVD) e instrumentais de vida diária (AIVD). A hierarquização do comprometimento funcional foi avaliada pelo escalonamento de Guttman. Resultados: A prevalência de dificuldade referida no desempenho de uma ou mais AIVDs foi de 35,4; 45,8 e 41,0% e para as ABVDs foi de 16,3; 13,3 e 17,5%; respectivamente nos anos de 2000, 2006 e 2010. Em dez anos de acompanhamento observa-se, entre as mulheres, variabilidade na prevalência de 42,3 a 54,6% de comprometimento nas AIVDs e de 17,0 a 20,4% nas ABVDs e, entre os homens, de 25,6 a 33,1% em AIVDs e de 8,0 a 13,7% em ABVDs. Nas três ondas, as atividades com maior relato de dificuldade foram utilizar transporte, realizar tarefas pesadas e cuidar das finanças, enquanto o ato de comer foi a menos prevalente. Conclusão: Houve aumento na prevalência de comprometimento funcional no período de dez anos, com maior variabilidade entre as mulheres e com o avançar da idade. Esses resultados contribuem para o planejamento dos serviços e a distribuição adequada dos recursos existentes por desvelar as necessidades e os cuidados necessários.
In turn, functional impairment and disability constitute multifactorial conditions that can affect individuals in different ways and vary in cause, nature, appearance, rhythm, and social implications6,7.
When Katz et al.3 designed the original instrument of functional assessment– worldwide
known and used –, they identified the existence of a certain hierarchy in functional acquisition and loss regarding ADLs. According to the authors, functional reconditioning of older adults fol-lowed a sequence comparable to that observed in child development. Also, these functions might have some similarities to the behavior in primitive societies, giving them primary biological and psychological conditions, and reflecting a hierarchy of neurological and locomotor responses3,8.
Identifying the progression pattern of difficulties in performing activities can be critical for the development of effective interventions that prevent or delay functional decline, in addition to allowing the recognition of subgroups of individuals who could benefit from a targeted intervention9. In this scenario, the purpose of the present study was to identify
and hierarchize the difficulties reported by older adults residing in the city of São Paulo in performing activities of daily living in 2000, 2006, and 2010.
METHOD
This is a cross-sectional study that used data from the Health, Well-being, and Aging Study (Saúde, Bem-Estar e Envelhecimento - SABE), collected in 2000, 2006, and 2010.
SABE started as a multicenter survey (2000), at the time coordinated by the Pan American Health Organization, with the purpose of profiling the living and health conditions of older people (≥ 60 years) living in seven urban centers in Latin America and the Caribbean (Buenos Aires in Argentina, Bridgetown in Barbados, Havana in Cuba, Mexico City in Mexico, Montevideo in Uruguay, Santiago in Chile, and São Paulo in Brazil). In São Paulo, a proba-bility sample of 2,143 older people (cohort A00) of both genders was selected, assessed, and interviewed. Silva10 brings the sample design details of the initial study.
Since 2006, the cohort A00 was located, and out of the initial total, 1,115 older people were interviewed and reevaluated. The observed difference consisted of deaths (30.3%), refusals (8.2%), relocation (2.4%), institutionalization (0.5%), and people not found (6.5%). A new probability sample of individuals aged 60 to 64 years (a non-existent age range at that moment) was drawn to compose cohort B06 (n = 298), totaling 1,413 older people (≥ 60 years) of both genders interviewed in that year.
In 2010, a third data collection was conducted with 990 older people located, interviewed, and reevaluated, who belonged to cohorts A and B. As in 2006, a new probability sample of individuals aged 60 to 64 years was drawn to compose cohort C10 (n = 355), totaling 1,345 older adults interviewed in that year.
The probability samples of each data collection were constructed to represent the older population living in the city of São Paulo, in their respective years. To accomplish that, sample weights related to the variability between the number of interviews in each sector and some sociodemographic conditions (gender and age) were used, according to the year in question.
Each data collection used the following variables:
• Sociodemographic: gender, age, marital status (married, widower, divorced, separated, single), years of schooling (illiterate; 1 to 3 years; 4 to 7 years; and 8 or more years);
• Health condition: number of self-reported illnesses and cognitive decline measured by the modified Mini-Mental State Examination11 (< 13 points);
• Functional status:
• ADLs: feeding (eating a prepared meal), dressing, toileting, bathing/showering, transferring (from bed to chair and vice-versa), and ambulating (crossing a room walking);
• IADLs: taking medicines, using the telephone, shopping, managing finances, using transportation, preparing meals, and performing light and heavy household tasks.
The hierarchy of the emergence of reported difficulties in performing activities was based on the scaling proposed by Guttman12, which first described the
propor-tion of these difficulties reported by older adults, sorting them in descending order. In this scaling, each answer can predict the performance of the previous activity. When the answers do not follow this logic, they are considered “errors,” which this study expressed in proportions. The coefficient of reproducibility (CR) determines the validity of the scaling, measuring the relative fitting degree used to scale the order of activity distribution. We considered CR ≥ 0.9 (90%) as ideal, with the “error” corre-sponding to 10%, that is, only 10% or fewer errors identified, a proportion regarded as small12. This scaling was repeated in the three data collections and subsequently
compared between them.
In 2000, SABE was submitted to and approved by the National Committee for Ethics in Research (Comissão Nacional de Ética em Pesquisa - CONEP) (report No. 315/99). In 2006 and 2010, it was submitted to and approved by the Committee for Ethics in Research (Comitê de Ética em Pesquisa - COEP) of Faculdade de Saúde Pública da Universidade de São Paulo (reports No. 83/06 and No. 2.044/10, respectively).
RESULTS
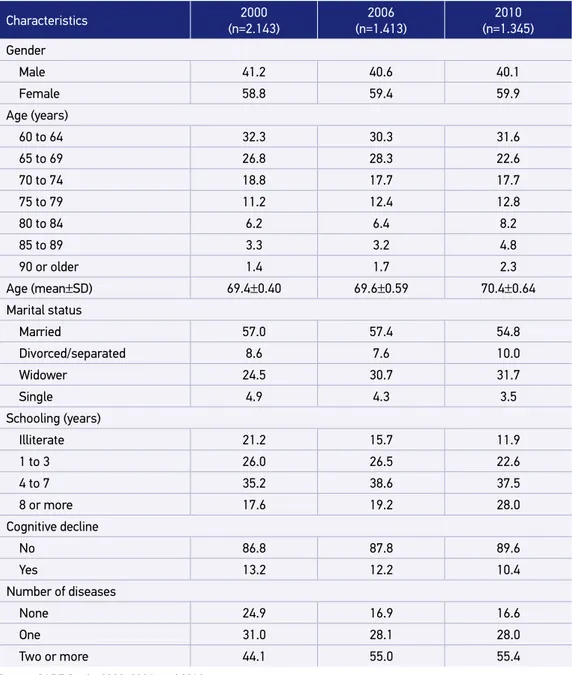
prevalence of women, age between 60 to 69 years, married people, reported schooling from 4 to 7 years, and two or more chronic diseases (Table 1).
The prevalence of reported difficulty in performing one or more IADLs was 35.4% (2000), 45.8% (2006), and 41.0% (2010); while for ADLs, it was 16.3% (2000), 13.3% (2006),
Characteristics 2000
(n=2.143)
2006 (n=1.413)
2010 (n=1.345)
Gender
Male 41.2 40.6 40.1
Female 58.8 59.4 59.9
Age (years)
60 to 64 32.3 30.3 31.6
65 to 69 26.8 28.3 22.6
70 to 74 18.8 17.7 17.7
75 to 79 11.2 12.4 12.8
80 to 84 6.2 6.4 8.2
85 to 89 3.3 3.2 4.8
90 or older 1.4 1.7 2.3
Age (mean±SD) 69.4±0.40 69.6±0.59 70.4±0.64
Marital status
Married 57.0 57.4 54.8
Divorced/separated 8.6 7.6 10.0
Widower 24.5 30.7 31.7
Single 4.9 4.3 3.5
Schooling (years)
Illiterate 21.2 15.7 11.9
1 to 3 26.0 26.5 22.6
4 to 7 35.2 38.6 37.5
8 or more 17.6 19.2 28.0
Cognitive decline
No 86.8 87.8 89.6
Yes 13.2 12.2 10.4
Number of diseases
None 24.9 16.9 16.6
One 31.0 28.1 28.0
Two or more 44.1 55.0 55.4
Table 1. Distribution (%) of older adults according to sociodemographic characteristics and health conditions. City of São Paulo, 2000, 2006, and 2010.
and 17.5% (2010). In ten years of follow-up, the variability in prevalence among women ranged from 42.3 to 54.6% for IADL impairment, and 17.0 to 20.4% for ADL. For men, it varied from 25.6 to 33.1% for IADL impairment, and 8.0 to 13.7% for ADL.
In all periods analyzed, advancing age was associated with a worse functional perfor-mance for both genders (Table 2).
Table 3 demonstrates the proportion of reported difficulties in performing activities of daily living in 2000, 2006, and 2010. In the three periods, functional decline started with IADL impairment, progressing steadily to ADL. The CR and probability of error found in each year were within limits established as ideal (CR > 0.9). The proportions of
Difficulty with basic activities of daily living
Age group (years)
Women Men
2000 2006 2010 2000 2006 2010
60 to 64 28.6 41.2 37.5 17.0 24.9 18.1
65 to 69 34.5 46.6 32.9 17.9 25.5 24.3
70 to 74 45.2 54.4 51.7 32.0 32.8 34.5
75 to 79 54.0 70.4 55.5 34.4 51.3 33.9
80 to 84 67.6 78.4 75.0 52.1 57.5 52.1
85 to 89 88.8 93.7 89.9 61.0 75.1 58.1
≥90 92.5 96.5 84.3 92.0 82.4 58.2
Total 18.1 17.0 20.4 13.7 8.0 13.1
Difficulty with instrumental activities of daily living
Age group (years)
Women Men
2000 2006 2010 2000 2006 2010
60 to 64 12.1 11.5 11.7 8.6 5.2 9.3
65 to 69 13.2 9.5 11.2 11.3 1.3 11.2
70 to 74 17.3 14.4 17.9 15.4 6.9 12.1
75 to 79 22.6 21.9 25.3 19.0 19.3 14.2
80 to 84 29.6 34.9 37.3 25.8 21.1 32.2
85 to 89 47.8 44.8 43.6 27.5 38.2 24.4
≥90 71.8 69.9 78.2 62.6 42.0 20.4
Total 42.3 54.6 48.8 25.6 33.1 29.3
Table 2. Distribution (%) of older adults according to difficulty with basic and instrumental activities of daily living, gender, and age group. City of São Paulo, 2000, 2006, and 2010.
difficulty varied between activities: using transportation (17.6–22.7%), performing heavy household tasks (17.7–28.8%), shopping (13.4–17.4%), taking medicines (11.3–14.0%), dressing (9.1–12.9%), using the telephone (8.2–12.4%), managing finances (8.4–25.0%), bathing/showering (6.2–7.8%), performing light tasks (5.9–13.2%), preparing meals (5.5–7.2%), ambulating (3.6–5.7%), transferring (4.6–8.8%), toileting (4.5–8.6%), and feeding (2.9–3.6%).
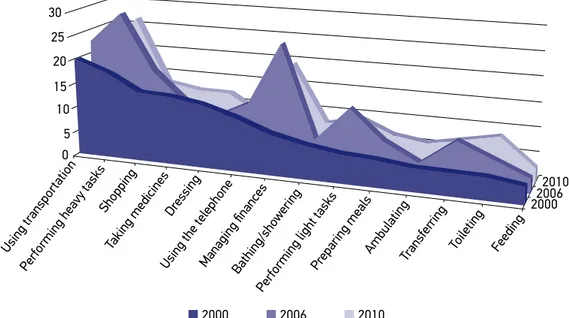
Figure 1 presents the evolution of the functional performance of activities of daily liv-ing analyzed in the three cohorts. There were variations in the performance of all activities.
Activities 2000(%)
(n=2.143) Activities
2006(%)
(n=1.413) Activities
2010(%) (n=1.345)
Using
transportation 19.9
Performing
heavy tasks 28.8
Performing
heavy tasks 26.7
Performing
heavy tasks 17.7
Managing
finances 25.0 Managing finances 19.6
Shopping 14.3 Using
transportation 22.7
Using
transportation 17.6
Taking medicines 14.0 Shopping 17.4 Shopping 13.4
Dressing 12.9 Performing
light tasks 13.2
Taking
medicines 12.3
Using the
telephone 10.9
Using the
telephone 12.4 Dressing 12.2
Managing
finances 8.4
Taking
medicines 11.3
Performing
light tasks 9.5
Bathing/
showering 6.9 Dressing 9.1 Toileting 8.6
Performing
light tasks 5.9 Transferring 8.8
Using the
telephone 8.2
Preparing meals 5.5 Preparing
meals 7.2
Bathing/
showering 7.8
Ambulating* 4.7 Bathing/
showering 6.2 Transferring 7.2
Transferring** 4.6 Toileting 5.8 Preparing meals 6.7
Toileting 4.5 Ambulating 3.6 Ambulating 5.7
Feeding 3.6 Feeding 2.9 Feeding 2.9
Table 3. Proportion (%) of older adults residing in the city of São Paulo according to difficulty with activities of daily living. SABE Study, 2000, 2006, and 2010.
Source: SABE Study, 2000, 2006, and 2010.
*Crossing a room walking; **getting from bed to chair;
Managing finances and performing light tasks had the greatest variations, while feeding had the lowest.
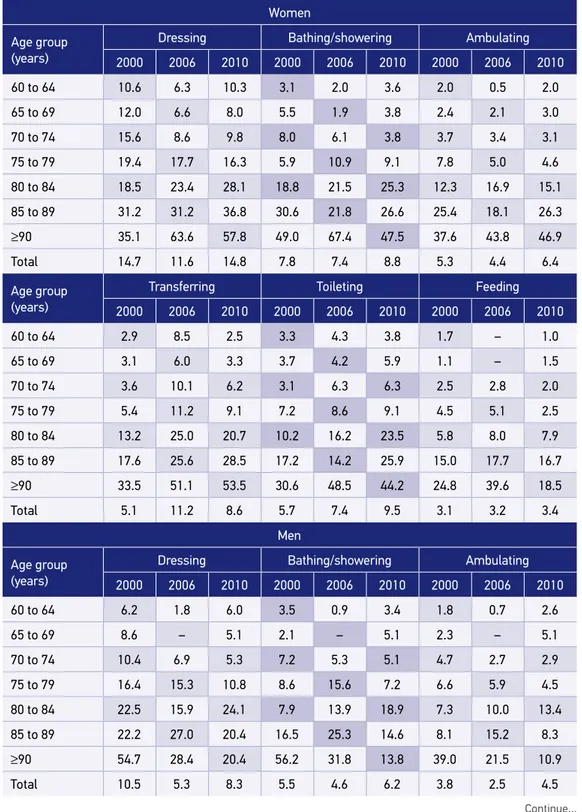
Regarding ADLs, there was an overall worsening in functional impairment for both gen-ders, happening in all activities analyzed among women and in all but feeding and dressing among men (Table 4).
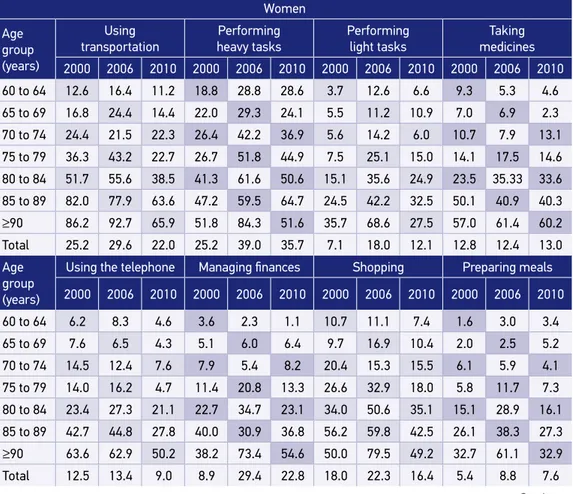
Table 5 shows the prevalence of difficulties with functional performance of IADLs in each period analyzed, stratified by activity, gender, and age. In ten years of follow-up, higher functional impairment was present for most IADLs in the different age groups. Out of the eight activities evaluated, women had a worse performance in 50% of them, and men, in 37.5%.
DISCUSSION
In the present study, the proportion of interviewees with IADL limitations was con-sistently higher than of those with ADL limitations in all age groups, and for both gen-ders. This result corroborates the expected impairment of functional skills during the aging process: first, physical functional limitations (less serious and more common); then, activities considered more complex (IADLs); and later, the most basic ones related to self-care (ADLs)13.
Figure 1. Evolution of difficulty with activities of daily living for older adults. City of São Paulo.
SABE Study, 2000, 2006, and 2010. 30
25
20
15
10
5 0
Using tr ansportation
Performing heavy tasks Shopping
Taking medicines
Dressing
Using the telephoneManaging financesBathing/sho
wering
Performing light tasks
Preparing meals
AmbulatingTransfer
ring
Toileting Feeding
2000 2006 2010
Continue... Table 4. Distribution (%) of older adults according to difficulty with basic activities of daily living, gender, and age group. City of São Paulo, 2000, 2006, and 2010.
Women
Age group (years)
Dressing Bathing/showering Ambulating
2000 2006 2010 2000 2006 2010 2000 2006 2010
60 to 64 10.6 6.3 10.3 3.1 2.0 3.6 2.0 0.5 2.0
65 to 69 12.0 6.6 8.0 5.5 1.9 3.8 2.4 2.1 3.0
70 to 74 15.6 8.6 9.8 8.0 6.1 3.8 3.7 3.4 3.1
75 to 79 19.4 17.7 16.3 5.9 10.9 9.1 7.8 5.0 4.6
80 to 84 18.5 23.4 28.1 18.8 21.5 25.3 12.3 16.9 15.1
85 to 89 31.2 31.2 36.8 30.6 21.8 26.6 25.4 18.1 26.3
≥90 35.1 63.6 57.8 49.0 67.4 47.5 37.6 43.8 46.9
Total 14.7 11.6 14.8 7.8 7.4 8.8 5.3 4.4 6.4
Age group (years)
Transferring Toileting Feeding
2000 2006 2010 2000 2006 2010 2000 2006 2010
60 to 64 2.9 8.5 2.5 3.3 4.3 3.8 1.7 – 1.0
65 to 69 3.1 6.0 3.3 3.7 4.2 5.9 1.1 – 1.5
70 to 74 3.6 10.1 6.2 3.1 6.3 6.3 2.5 2.8 2.0
75 to 79 5.4 11.2 9.1 7.2 8.6 9.1 4.5 5.1 2.5
80 to 84 13.2 25.0 20.7 10.2 16.2 23.5 5.8 8.0 7.9
85 to 89 17.6 25.6 28.5 17.2 14.2 25.9 15.0 17.7 16.7
≥90 33.5 51.1 53.5 30.6 48.5 44.2 24.8 39.6 18.5
Total 5.1 11.2 8.6 5.7 7.4 9.5 3.1 3.2 3.4
Men
Age group (years)
Dressing Bathing/showering Ambulating
2000 2006 2010 2000 2006 2010 2000 2006 2010
60 to 64 6.2 1.8 6.0 3.5 0.9 3.4 1.8 0.7 2.6
65 to 69 8.6 – 5.1 2.1 – 5.1 2.3 – 5.1
70 to 74 10.4 6.9 5.3 7.2 5.3 5.1 4.7 2.7 2.9
75 to 79 16.4 15.3 10.8 8.6 15.6 7.2 6.6 5.9 4.5
80 to 84 22.5 15.9 24.1 7.9 13.9 18.9 7.3 10.0 13.4
85 to 89 22.2 27.0 20.4 16.5 25.3 14.6 8.1 15.2 8.3
≥90 54.7 28.4 20.4 56.2 31.8 13.8 39.0 21.5 10.9
Source: SABE Study, 2000, 2006, and 2010.
Table 4. Continuation.
Men
Age group (years)
Transferring Toileting Feeding
2000 2006 2010 2000 2006 2010 2000 2006 2010
60 to 64 1.4 4.3 3.2 1.8 2.5 4.5 2.5 0.9 0.6
65 to 69 2.8 1.3 3.9 0.9 – 6.3 3.4 – 1.7
70 to 74 6.6 5.3 3.1 4.8 3.9 5.6 3.4 4.0 2.4
75 to 79 4.7 11.1 6.9 6.7 5.8 8.6 6.4 6.6 5.5
80 to 84 6.3 11.0 16.5 6.6 7.8 20.7 6.8 4.8 3.6
85 to 89 10.6 20.7 10.3 10.6 23.3 13.4 12.9 13.6 3.5
≥90 29.6 28.4 10.0 43.3 25.0 10.5 41.5 10.2 3.3
Total 3.9 5.4 5.0 3.8 3.4 7.1 4.3 2.4 2.1
Table 5. Distribution (%) of older adults according to difficulty with instrumental activities of daily living, gender, and age group. City of São Paulo, 2000, 2006, and 2010.
Continue... Women
Age group (years)
Using transportation
Performing
heavy tasks
Performing
light tasks
Taking medicines
2000 2006 2010 2000 2006 2010 2000 2006 2010 2000 2006 2010
60 to 64 12.6 16.4 11.2 18.8 28.8 28.6 3.7 12.6 6.6 9.3 5.3 4.6
65 to 69 16.8 24.4 14.4 22.0 29.3 24.1 5.5 11.2 10.9 7.0 6.9 2.3
70 to 74 24.4 21.5 22.3 26.4 42.2 36.9 5.6 14.2 6.0 10.7 7.9 13.1
75 to 79 36.3 43.2 22.7 26.7 51.8 44.9 7.5 25.1 15.0 14.1 17.5 14.6
80 to 84 51.7 55.6 38.5 41.3 61.6 50.6 15.1 35.6 24.9 23.5 35.33 33.6
85 to 89 82.0 77.9 63.6 47.2 59.5 64.7 24.5 42.2 32.5 50.1 40.9 40.3
≥90 86.2 92.7 65.9 51.8 84.3 51.6 35.7 68.6 27.5 57.0 61.4 60.2
Total 25.2 29.6 22.0 25.2 39.0 35.7 7.1 18.0 12.1 12.8 12.4 13.0
Age group (years)
Using the telephone Managing finances Shopping Preparing meals
2000 2006 2010 2000 2006 2010 2000 2006 2010 2000 2006 2010
60 to 64 6.2 8.3 4.6 3.6 2.3 1.1 10.7 11.1 7.4 1.6 3.0 3.4
65 to 69 7.6 6.5 4.3 5.1 6.0 6.4 9.7 16.9 10.4 2.0 2.5 5.2
70 to 74 14.5 12.4 7.6 7.9 5.4 8.2 20.4 15.3 15.5 6.1 5.9 4.1
75 to 79 14.0 16.2 4.7 11.4 20.8 13.3 26.6 32.9 18.0 5.8 11.7 7.3
80 to 84 23.4 27.3 21.1 22.7 34.7 23.1 34.0 50.6 35.1 15.1 28.9 16.1
85 to 89 42.7 44.8 27.8 40.0 30.9 36.8 56.2 59.8 42.5 26.1 38.3 27.3
≥90 63.6 62.9 50.2 38.2 73.4 54.6 50.0 79.5 49.2 32.7 61.1 32.9
A possible analysis of these results involves the effects of age, period, and cohort14.
The three periods investigated showed a positive gradient between the increase in age and prevalence of difficulty in performing IADLs and ADLs. This finding agrees with another study conducted in high-, middle-, and low-income countries15. In the United States, IADL
impairment increased over 27 years (1982 to 2009) among younger cohorts after adjustments for the effects of time/age, while ADL remained stable14. According to the authors, the trend
found can be explained, on the one hand by technological advances in health care, which is associated with a higher survival of more vulnerable older people; and, on the other, by a possible information bias related to the need to use social insurance, available for the more debilitated in this country.
Similarly to a work by Lin et al.14, the present study shows that the older people in our
midst also have an increasing trend in IADL impairment and stability in ADL for both gen-ders, associated with birth cohorts.
Men
Age group (years)
Using transportation
Performing
heavy tasks
Performing
light tasks
Taking medicines
2000 2006 2010 2000 2006 2010 2000 2006 2010 2000 2006 2010
60 to 64 5.4 6.1 5.8 3.0 9.7 9.6 1.9 5.3 3.9 11.7 2.4 8.3
65 to 69 6.4 4.4 5.4 4.5 9.7 9.5 1.5 3.0 5.2 11.4 8.0 4.6
70 to 74 14.6 15.7 14.5 10.5 12.1 11.8 7.4 5.5 2.4 20.5 15.0 8.5
75 to 79 19.2 25.8 12.4 10.9 22.5 17.2 5.8 9.2 7.4 15.8 11.8 19.4
80 to 84 37.8 33.5 32.0 15.7 33.9 21.3 8.5 13.1 9.7 25.0 22.7 25.1
85 to 89 46.9 50.1 20.5 19.2 38.8 29.3 15.1 25.5 15.6 41.5 34.5 27.5
≥90 85.2 59.7 42.6 47.7 46.1 61.0 34.9 29.0 21.2 63.5 55.1 36.5
Total 12.5 12.6 10.9 7.2 14.0 13.3 4.3 6.2 5.5 15.7 9.7 11.2
Age group (years)
Using the telephone Managing finances Shopping Preparing meals
2000 2006 2010 2000 2006 2010 2000 2006 2010 2000 2006 2010
60 to 64 3.0 6.3 2.5 2.5 3.5 2.5 2.3 6.5 4.1 2.4 1.9 3.7
65 to 69 4.9 6.6 3.0 4.5 3.7 2.9 6.7 6.6 6.7 3.0 2.8 4.1
70 to 74 12.2 14.5 12.0 12.1 10.8 14.6 13.4 10.5 12.4 7.8 6.7 7.1
75 to 79 11.5 12.9 9.8 9.5 15.4 7.9 12.6 15.2 5.3 8.8 6.8 5.4
80 to 84 28.9 23.5 13.4 22.0 17.4 20.5 23.2 23.1 22.6 11.0 13.2 7.4
85 to 89 29.3 42.8 17.0 26.7 26.0 19.5 27.0 42.5 23.0 21.3 21.5 8.2
≥90 51.5 47.8 35.4 42.4 46.7 19.9 56.5 39.3 42.6 44.8 21.2 23.5
Total 8.7 10.8 7.0 7.6 18.6 14.8 9.0 10.3 8.9 5.7 4.8 5.4
Table 5. Continuation.
According to Christensen et al.16, two opposing processes could affect the health of
succes-sive cohorts. On the one hand, a later cohort would benefit from the progress in health care resulting in more effective prevention of diseases, better treatments, and benefits of higher living standards, including greater access to education and healthier lifestyles. Such prog-ress would help later cohort members to reach a more advanced age in better health con-ditions, representing the “success of success”: health improvements earlier in life resulting in healthier cohorts at a more advanced age. On the other hand, due to the lives saved, this later cohort would be larger than the previous.
However, these additional survivors could have relatively weak health and even have died, if they lived in previous cohorts with less favorable living conditions and less access to medical care. This process would be the “failure of success,” as it would reduce the average health of the population after allowing very fragile individuals to reach a more advanced age. For instance, when comparing a Danish cohort born in 1915 with another born in 1905, these authors demonstrated that the younger cohort had better survival rates and performance in cognitive tests and ADLs than the previous one, despite being two years older at the time of evaluation. This finding suggests that more people are aging with better overall performance. If this development continues, future functional issues and care needs of very old people could be lower than expected based on the cur-rent load of disability16.
In addition, César et al.17 pointed out that the measure of functional impairment in
pop-ulation surveys would catch only the most important losses of functional capacity, while the more discreet ones could go unnoticed by the interviewees. In this regard, Cella et al.18
suggest the application of measuring scales of greater extension in investigations includ-ing individuals with different levels of functional impairment. These scales should have a broader spectrum of activities with increasing difficulty, involving mobility, strength, endur-ance, and cognition.
Bleijenberg et al.19 investigated a prospective Dutch cohort regarding its performance
in 15 activities, and found that the advanced ones, which demand a proper physical exe-cution – e.g., traveling –, declined sooner than ADLs, while difficulties with IADLs, which require cognitive abilities – e.g., using the telephone, taking medicines, and man-aging finances –, developed later than with ADLs – e.g., bathing/showering, dressing, and transferring.
In all waves of the present study, difficulties in carrying out activities directly related to the locomotor system – using transportation, performing household tasks, and shopping – were the most prevalent. It is noteworthy that the second most prevalent illness among older adults in the city of São Paulo is joint disease20, which is directly related to the
perfor-mance of these activities and a worse quality of life, as it restricts their independence and, over time, could compromise their autonomy.
The hierarchy observed in the ten years of follow-up of the SABE Study remains from IADLs to ADLs, despite some variability. Bendayan et al.9 found a similar hierarchical
(ELSA Study) samples, with a 10-year gap. In both cohorts, feeding had the lowest preva-lence and variation over the years, as in the present study.
Progressive functional decline leads to an increase in health care demands, specifically for care needs. Nunes et al.21 proposed a classification of care needs related to older people
based on the hierarchy of activities of daily living, stratified into minimum, moderate, and maximum, to adjust the planning and manage healthcare resources.
Care is closely associated with the socioeconomic context – both at micro (families) and macro (funded by society or country) levels –, traditions, politics, and culture22, which
rein-forces the urgent need for establishing long-term care policies.
In the period analyzed, women presented a greater functional impairment when com-pared to men, which could be due to their longer life expectancy and different health, social, cultural, and economic conditions, as corroborated by other studies23-25.
The World Health Organization, in the publication “Active ageing,” establishes as funda-mental goals maintaining autonomy and independence, controlling multiple diseases, pro-viding care, and reducing inequalities during aging26. In this context, in 2006, the reprint of
the National Health Care Policy for Older People brought a paradigm shift by considering functional capacity as the great divide in the evaluation of older people, classifying them as independent and vulnerable to frailty or frail. Thus, states and cities would have this classi-fication as a basis to reorder and readjust existing services.
A limitation of the present study was the use of self-reported questions in the per-formance assessment of activities of daily living, which could result in information bias. However, it brings important considerations regarding older people and the organization of public health and social policies.
Due to the fast increase in the older population, maintaining their autonomy and inde-pendence should be a priority for the health system and society. The results of the present study show that a standard intervention approach that focuses on older adults’ ADL and/ or IADL impairment might not work since functional performance varies with advancing age, between genders, and in different cohorts.
CONCLUSION
The prevalence of difficulty reported by older people in performing ADLs and IADLs increased in the period of ten years (2000 to 2010). The variability in the prevalence of func-tional ADL and IADL impairment was greater among women when compared to men, and with advancing age. Regarding hierarchy, the activities with the highest reported difficulty were using transportation, performing heavy tasks, and managing finances, while feeding was the least prevalent.
1. Guariento ME, Neri AL. Assistência Ambulatorial ao Idoso. Campinas: Alínea; 2010.
2. Brasil. Ministério da Saúde. Política Nacional de Saúde da Pessoa Idosa. Portaria MS/GM nº 2.528, de 19 de outubro de 2006. Aprova a Política Nacional de Saúde da Pessoa Idosa [Internet]. Brasília: Ministério da Saúde; 2006 [acesso em 5 dez. 2017]. Disponível em: http://www.saude.mg.gov.br/ atos_normativos/legislacao-sanitaria/estabelecimentos-de-saude/atencao-ao-idoso/Portaria_2528.pdf 3. Katz S, Ford AB, Moskowitz RW, Jackson BA, Jaffe
MW. Studies of illness in the aged. The index of ADL: a standardized measure of biological and psychosocial function. JAMA. 1963; 185(21): 914-9.
4. Moraes EN. Atenção à saúde do Idoso: Aspectos Conceituais. Brasília: Organização Pan-Americana da Saúde; 2012.
5. Pereira JK, Giacomin KC, Firmo JOA. A funcionalidade e incapacidade na velhice: ficar ou não ficar quieto. Cad Saúde Pública. 2015; 31(7): 1451-9. http://dx.doi. org/10.1590/0102-311X00046014
6. Iezzoni L. Using administrative data to study persons with disabilities. Milbank Q. 2002; 80: 347-79. 7. Alves LC, Leite IC, Machado CJ. Conceituando e
mensurando a incapacidade funcional da população idosa: uma revisão de literatura. Ciên Saúde Colet. 2008; 13(4): 1199-207. http://dx.doi.org/10.1590/ S1413-81232008000400016
8. Duarte YAO, Andrade CL, Lebrão ML. O Índex de Katz na avaliação da funcionalidade dos idosos. Rev Esc Enferm USP. 2007; 41(2): 317-25. http://dx.doi. org/10.1590/S0080-62342007000200021
9. Bendayan R, Cooper R, Wloch EG, Hofer SM, Piccinin AM, Muniz-Terrera G. Hierarchy and speed of loss in physical functioning: A comparison across older US and English men and women. J Gerontol A Biol Sci Med Sci. 2017; 72(8): 1117-22. https://doi.org/10.1093/ gerona/glw209
10. Silva NN. Processo de amostragem. In: Lebrão ML, Duarte YAO, eds. O projeto SABE no Brasil: uma abordagem inicial. Brasília: Organização Pan-Americana da Saúde; 2003.
11. Icaza MC, Albala C. Minimental State Examination (MMSE) del Studio de dementia en Chile: Análisis estadístico. Genebra: OPAS; 1999. p. 1-18.
12. Guttman L. The basis of scalogram analysis. In: Stouffer SA, ed. Measurement and prediction. Nova York: Princeton University Press; 1950. p. 60-90. 13. Chatterji S, Byles J, Cutler D, Seeman T, Verdes E. Health,
functioning, and disability in older adults—present status
and future implications. Lancet. 2015; 385(9967): 563-75. https://doi.org/10.1016/S0140-6736(14)61462-8 14. Lin SF, Beck AN, Finch BK, Hummer RA, Master RK.
Trends in US older adult disability: exploring age, period, and cohort effects. Am J Public Health. 2012; 102(11): 2157-63. https://doi.org/10.2105/AJPH.2011.300602 15. Beard JR, Officer A, Carvalho IA, Sadana R, Pot AM, Michel
JP, et al. The World report on ageing and health: a policy framework for healthy ageing. Lancet. 2016; 387(10033): 2145-54. https://doi.org/10.1016/S0140-6736(15)00516-4 16. Christensen K, Thinggaard M, Oksuzyan A, Steenstrup T, Andersen-Ranberg K, Jeune B, et al. Physical and cognitive functioning of people older than 90 years: a comparison of two Danish cohorts born 10 years apart. Lancet. 2013; 382(9903): 1507-13. https://doi. org/10.1016/S0140-6736(13)60777-1
17. César CC, Mambrini JVM, Ferreira FR, Lima-Costa MF. Capacidade funcional de idosos: análise das questões de mobilidade, atividades básicas e instrumentais da vida diária via Teoria de Resposta ao Item. Cad Saúde Pública. 2015; 31(5): 931-45. http://dx.doi. org/10.1590/0102-311X00093214
18. Cella D, Riley W, Stone A, Rothrock N, Reeve B, Yount S, et al. The Patient-Reported Outcomes Measurement Information System (PROMIS) developed and tested its first wave of adult selfreportes health outcome item banks: 2005-2008. J Clin Epidemiol. 2010; 63: 1179-94. https://doi.org/10.1016/j.jclinepi.2010.04.011 19. Bleijenberg N, Zuithoff NPA, Smith AK, Wit NJ,
Schuurmans MJ. Disability in the individual ADL, IADL, and mobility among older adults: A prospective cohort study. J Nutr Health Aging. 2017; 21(8): 897-903. https://doi.org/10.1007/s12603-017-0891-6 20. Bettiol CHO, Dellaroza MSG, Lebrão ML, Duarte
YAO, Santos EG. Fatores preditores de dor em idosos do Município de São Paulo, Brasil: Estudo SABE 2006 e 2010. Cad Saúde Pública. 2017; 33(9): e00098416. https://doi.org/10.1590/0102-311X00098416 21. Nunes DP, Brito TRP, Corona LP, Alexandre
TS, Duarte YAO. Idoso e demanda de cuidador: proposta de classificação da necessidade de cuidado. Rev Bras Enferm. 2018; 71(Supl. 2). http://dx.doi. org/10.1590/0034-7167-2017-0123
22. Sjölund BM, Wimo A, Engström M, Von Strauss E. Incidence of ADL Disability in Older Persons, Physical Activities as a Protective Factor and the Need for Informal and Formal Care– Results from the SNAC-N Project. PLoS One. 2015; 10(9): e0138901. http:// dx.doi.org/10.1371/journal.pone.0138901
23. Zunzunegui MV, Alvarado BE, Béland F, Vissandjee B. Explaining health differences between men and women in later life: A cross-city comparison in Latin America and the Caribbean. Soc Sci Med. 2009; 68: 235-42. https://doi.org/10.1016/j.socscimed.2008.10.031 24. World Health Organization. World report on ageing and health. Genebra: World Health Organization; 2015. 25. Biritwum RB, Minicuci N, Yawson AE, Theou O, Mensah GP, Naidoo N. Prevalence of and factors associated with frailty and disability in older adults from
China, Ghana, India, Mexico, Russia and South Africa. Maturitas. 2016; 91: 8-18. https://doi.org/10.1016/j. maturitas.2016.05.012
26. World Health Organization. Envelhecimento ativo: uma política de saúde. Brasília: Organização Pan-Americana da Saúde; 2005.
Received on: 04/19/2018
Final version presented on: 05/08/2018 Accepted on: 06/20/2018