Inequalities in basic activities of
daily living among older adults:
ELSI-Brazil, 2015
Fabíola Bof de AndradeI,II, Yeda Aparecida de Oliveira DuarteIII, Paulo Roberto Borges de Souza
JuniorIV, Juliana Lustosa TorresI, Maria Fernanda Lima-CostaI,II, Flavia Cristina Drumond AndradeV
I Fundação Oswaldo Cruz. Instituto René Rachou. Núcleo de Estudos em Saúde Pública e Envelhecimento. Belo Horizonte, MG, Brasil
II Fundação Oswaldo Cruz. Instituto René Rachou. Programa de Pós-Graduação em Saúde Coletiva.
Belo Horizonte, MG, Brasil
III Universidade de São Paulo. Escola de Enfermagem. São Paulo, SP, Brasil
IV Fundação Oswaldo Cruz. Instituto de Comunicação e Informação Científica e Tecnológica em Saúde. Rio de Janeiro, RJ, Brasil
V University of Illinois at Urbana-Champaign. Kinesiology and Community Health. Champaign, IL, USA
ABSTRACT
OBJECTIVE: To evaluate the magnitude of wealth-related inequalities in basic activities of daily living among community-dwelling Brazilian older adults and to determine the contribution of demographic, socioeconomic, and health conditions to the inequality.
METHODS: We used data from the 2015 Brazilian Longitudinal Study of Aging (ELSI-Brazil) with a nationally representative sample of adults aged 50 years or older. We assessed wealth-related inequalities in basic activities of daily living by the concentration index. Concentration index was decomposed to determine the contribution of demographic, health, and socioeconomic factors to wealth-related inequalities in basic activities of daily living.
RESULTS: The prevalence of disability in the sample was 15.7% (95%CI 14.9–17.6). The concentration index was -0.145 (95%CI -0.194– -0.097), which indicates that disability is concentrated in the poorest individuals in Brazil. Inequalities in basic activities of daily living disability are primarily explained by socioeconomic status (wealth and own education) not by demographic or health factors.
CONCLUSIONS: There are avoidable wealth-related inequities for those with a disability in Brazil. The strong contribution of the socioeconomic status highlights the need for new public health policies that promote equity, universality, and integrality, in addition to the expansion of home nursing public services.
DESCRIPTORS: Aged. Activities of Daily Living. Disabled Persons. Socioeconomic Factors. Health Inequalities.
Correspondence: Fabíola Bof de Andrade
Av. Augusto de Lima, 1715 Barro Preto 30190-002 Belo Horizonte, MG, Brasil E-mail: [email protected]
Received: Dec 13, 2017 Approved: Apr 20, 2018
How to cite: Bof de Andrade F, Duarte YAO, Souza-Junior PRB, Torres JL, Lima-Costa MF, Andrade FCD. Inequalities in basic activities of daily living among older adults: ELSI-Brazil, 2015. Rev Saude Publica. 2018;52 Suppl 2:14s
Copyright: This is an open-access article distributed under the terms of the Creative Commons Attribution License, which permits unrestricted use, distribution, and reproduction in any medium, provided that the original author and source are credited.
INTRODUCTION
Brazil is among the largest countries in the world and the aging process of its population is occurring at a very fast pace1. With a higher proportion of individuals reaching older ages,
disability becomes a more prevalent health problem. According to the Brazilian National Health Survey conducted in 2013, 30.1% of the Brazilian older adults (60 years or older)
reported having difficulty performing basic activities of daily living (BADL), which are related
to survival activities such as eating and dressing, or performing instrumental activities of daily living (IADL), which are related to community activities such as managing money and taking medications. Moreover, prevalence levels increase dramatically with age – 16.4% among the older adults aged 60–64 years reported having ADL disability compared to 48.3% among those aged 75 and older2. Although most persons will experience health declines
in later life, disability is not equally distributed across social groups and individuals from higher socioeconomic status (SES) often experience better functional health3,4.
Health disparities by region, education, income, wealth, and social background are evident in Brazil among adults5–7 and older adults3,4,8–10. These disparities emerge despite the fact that
Brazil has a national health system [Sistema Único de Saúde (SUS)] guided by the principle
of social equity. Despite expansions in the SUS, there is evidence that health inequalities related to disability have increased among Brazilian older adults from 1998 to 20088. Among
older adults aged 60–64 years, these inequalities almost doubled during this period8.
Previous research has found social inequalities for disability among older adults in Brazil3,4,7–9,
particularly across educational groups3,4, household income4, and wealth3. Even though
these studies have been critical in identifying demographic, socioeconomic, and health determinants of disability, the contribution of these determinants to the socioeconomic inequalities in disability need to be better understood. Understanding which factors are stronger contributors to inequalities is critical to advance policies as some factors are amenable to these policies, such as education, but others, such age and sex, are not.
In this study, we focus on the concentration index (CI) to describe the magnitude of inequality.
The CI is now widely used in studies focusing on socioeconomic inequalities in health around the world, but it has only just now started being used in Brazil. The CI has the advantage of
describing the socioeconomic inequality using the entire socioeconomic distribution11 rather
than focusing on comparisons between extreme groups (e.g. highest versus lowest wealth
quintile). We believe that using the entire distribution is a better way to assess the social gradients in disability12. In addition, previous studies have not attempted to decompose the
determinants of health inequalities. This study fills this gap and estimates the magnitude
of wealth-related inequalities in BADL among community-dwelling Brazilian older adults using the CI. In addition, it uses decomposition analyses to determine the contribution of demographic, socioeconomic, and health determinants to the overall inequality.
METHODS
Data Source
This study used data from the baseline of the Brazilian Longitudinal Study of Aging
(ELSI-Brazil), which is a nationally representative, population-based cohort study of persons aged 50 years or older conducted between 2015 and 2016.
The ELSI-Brazil used a probabilistic sample and applied a sampling procedure that combined geographical stratification and clustering in three stages. The municipalities were the
primary sample units, followed by census tracts and households. All residents in the selected
households aged 50 years or older were eligible for interview. The final sample comprised 10,000 older adults (9,412 participated) residing in 70 municipalities from different Brazilian
regions. Further details of the ELSI-Brazil can be seen elsewherea,13.
a Fundação Oswaldo Cruz.
The 2015 ELSI-Brazil followed the standards set by the Declaration of Helsinki and was
approved by the ethics board of the Oswaldo Cruz Foundation, Minas Gerais (CAAE 34649814.3.0000.5091). All participants signed an informed consent form.
Measures
Self-reported disability in six BADL measures – walking across a room, dressing, bathing, eating, getting in and out of a bed (transferring), and toileting – was used to measure disability. First, we dichotomized each BADL measure with a score of “0” indicating that the respondent did not have any disability and a score of “1” indicating that the respondent had
any difficulty (little, great, unable) to perform the activity. Next, we created a dichotomous
variable in which a score of “0” was given to the individuals who did not have any limitations
and a score of “1” was assigned to those who reported having difficulty performing at least
one of the six BADL measures.
The wealth index was used to describe the socioeconomic status of the older adults. The
index was constructed using principal component analysis with information on household ownership of durable goods and housing characteristics according to the following variables: household assets (internet, television, cable tv, refrigerator, washing machine, dishwasher, clothes dryer, computer, desk phone, cell phone, microwave, motorcycle, car) and household
characteristics (maid, wall of masonry or wood, piped water, paved street, bathroom). The
wealth index was categorized into quintiles.
Determinants of disability were classified into the groups of demographic, health, and
socioeconomic determinants. Demographic determinants included age (50–59, 60–69, and 70 years or older) and sex (female or male). Health determinants included the number of chronic conditions. Health conditions included self-reported hypertension, diabetes, cardiovascular disease, chronic obstructive pulmonary disease, arthritis, stroke, asthma,
cancer, and renal insufficiency. Individuals were categorized as having no or one chronic
condition or having two or more. Socioeconomic determinants included wealth, own education (0–3, 4–7, 8–11, and 12 or more years of schooling), and parental education (no formal education; incomplete primary school; complete primary school or more).
Statistical Methods
Descriptive statistics were calculated for the sample. Given the complex survey design, associations between categorical variables and disability were assessed using the Rao-Scott chi-square test, which is a design-adjusted version of a Pearson chi-square test. Statistical
inferences were considered significant at the p < 0.05 level.
We then estimated the CI to quantify the degree of wealth-related inequality in disability. The
CI provides a summary measure of the relative inequality in disability that uses the entire socioeconomic distribution rather than just comparing the extremes11 of the distribution, such
as the difference in prevalence between the highest and lowest wealth quintiles. The CI is based
on the concentration curve that plots the cumulative percentage of the population ranked by wealth quintiles on the horizontal axis and the cumulative percentage of disability on the vertical axis. If there is no wealth-related inequality, CI will be zero and the concentration curve will be along the 45o line (equality line). When the concentration curve lies below the equality line, the
CI is positive, which indicates a disproportionate concentration of disability among the wealthier. When the curve is above the equality line, the CI is negative, which indicates a disproportionate concentration of disability among poor individuals12,14–16. The CI is bound between -1 and 1. We
decomposed the CI to assess the contribution of each determinant to wealth-related inequality.
The contribution of each determinant depends on the sensitivity (elasticity) of disability with
respect to that factor and the degree of wealth-related inequality associated with that factor.
The greater the sensitivity and the more unequal the factor is distributed in relation to wealth,
The horizontal inequity index (HI) was used to assess whether individuals with similar
demographic and health characteristics have the same levels of disability irrespective of their socioeconomic status12. The HI is a measure of health inequity and was estimated
based on the difference between CI and the contribution to the concentration index (CCI)
from demographic and health characteristics. A positive HI means that there are inequities favoring the wealthier older adults, whereas a negative HI means that inequities are more common among poor older adults.
All analyses accounted for the complex survey design and included survey weights. Descriptive analyses were carried out using Stata 13 SE (Stata-Corp., College Station, Texas, USA), and the software ADePT was used for estimating the HI and the CI and its decomposition17.
RESULTS
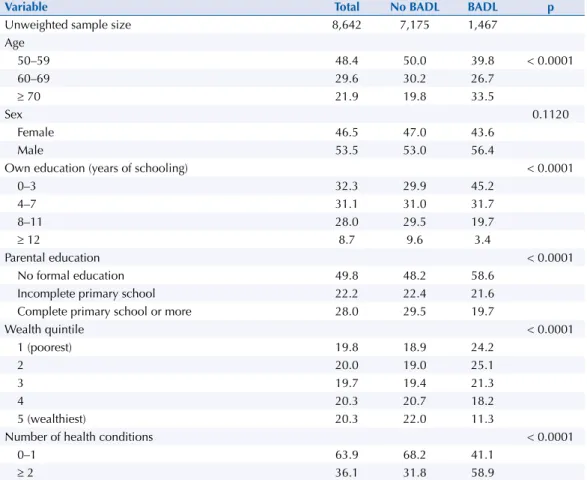
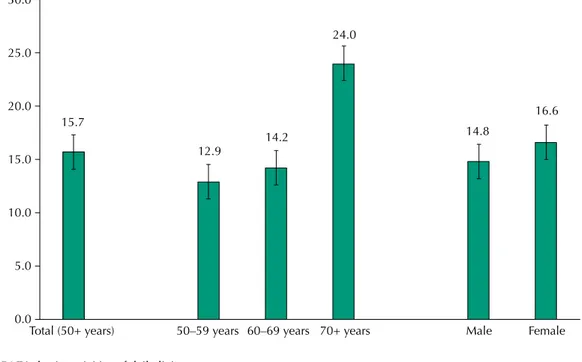
The prevalence of disability in the sample was 15.7% (95%CI 14.9–17.6). The characteristics
of the participants and results of bivariate analyses are presented in Table 1. Most of the participants are aged 50–59 years (48.4%) and male (53.5%) and they have no or one chronic condition (63.9%). Age, education (own and parental), wealth, and chronic conditions
are statisticaly associated with BADL disability. The Figure shows the proportion of the participants with BADL disabilities by age group and sex. Differences across age groups were statistically significant with disability increasing with age, particularly after age 70 (p < 0.0001). Prevalence of BADL did not differ by sex.
Table 2 shows the values of CI and HI and the contributions to the concentration index (CCI)
based on the decomposition analyses. The negative value for CI (-0.145, 95%CI -0.194– -0.097)
demonstrates that BADL is concentrated among poor older adults in Brazil. In addition, the
Table 1. Descriptive and bivariate analysis by disability status. Brazilian Longitudinal Study of Aging (ELSI-Brazil), 2015–2016.
Variable Total No BADL BADL p
Unweighted sample size 8,642 7,175 1,467
Age
50–59 48.4 50.0 39.8 < 0.0001
60–69 29.6 30.2 26.7
≥ 70 21.9 19.8 33.5
Sex 0.1120
Female 46.5 47.0 43.6
Male 53.5 53.0 56.4
Own education (years of schooling) < 0.0001
0–3 32.3 29.9 45.2
4–7 31.1 31.0 31.7
8–11 28.0 29.5 19.7
≥ 12 8.7 9.6 3.4
Parental education < 0.0001
No formal education 49.8 48.2 58.6
Incomplete primary school 22.2 22.4 21.6
Complete primary school or more 28.0 29.5 19.7
Wealth quintile < 0.0001
1 (poorest) 19.8 18.9 24.2
2 20.0 19.0 25.1
3 19.7 19.4 21.3
4 20.3 20.7 18.2
5 (wealthiest) 20.3 22.0 11.3
Number of health conditions < 0.0001
0–1 63.9 68.2 41.1
≥ 2 36.1 31.8 58.9
BADL: basic activities of daily living
Figure. Proportion of BADL disability according to age group and sex. Brazilian Longitudinal Study of Aging (ELSI-Brazil), 2015–2016.
Total (50+ years) 50–59 years 60–69 years 70+ years Male Female 0.0
15.7
12.9
14.2
24.0
14.8
16.6
5.0 10.0 15.0 20.0 25.0 30.0
Table 2. Estimates of the concentration index (CI), horizontal index (HI), and decomposition of the concentration index. Brazilian Longitudinal Study of Aging (ELSI-Brazil), 2015–2016.
Variable Disability
CCI % CI
Age (years) 50–59 (reference)
60–69 0.000 -0.1 -0.005
≥ 70 -0.006 4.2 -0.095
Female 0.000 -0.3 -0.032
(1) Total demographic factors -0.006 3.8
Number of health conditions 0–1 (reference)
≥ 2 0.003 -2.0 0.010
(2) Total health factors 0.003 -2.0
(3) Total demographic and health (1) + (2) -0.003 1.8
Wealth
1 – poorest (reference)
2 -0.002 1.4 -0.405
3 0.000 -0.1 -0.009
4 -0.010 7.1 0.391
5 – wealthiest -0.064 43.9 0.797
Parental education
No formal education (reference)
Incomplete primary school 0.000 0.1 0.023
Complete primary school or more -0.007 5.1 0.304
Own education (years) 0–3 (reference)
4–7 0.003 -1.9 -0.043
8–11 -0.026 17.9 0.272
≥ 12 -0.027 18.7 0.581
(4) Total SES -0.134 92.2
(5) Total (3) + (4) -0.137 94.0
(6) Error -0.009 6.0
(7) Total CI (5) + (6) 100 -0.145
95%CI (-0.194– -0.097)
HI (7) - (3) -0.143
95%CI (-0.189– -0.097)
negative value for HI (HI = -0.143, 95%CI -0.189– -0.097) highlights that poor older adults are
more likely to have BADL even after accounting for differences in demographic and health
determinants. Older age, female sex, and lower education have negative CI, which means that these determinants are more concentrated among the poor. In contrast, having two or more health conditions and higher parental and own education have positive CI, which implies that these determinants are more concentrated among the wealthier. Overall, the results indicate that the aggregate contribution of demographic and health factors was only 1.8%, whereas socioeconomic factors, particularly wealth and own education, were the main contributors (92.2%) to the inequality in BADL disability.
DISCUSSION
Based on a nationally representative sample, this article shows that disabilities in activities
of daily living affect approximately 16% of the Brazilian older adults. It also demonstrates
the existence of wealth-related inequalities in BADL disabilities among adults aged 50 years
or older in Brazil. To our knowledge, this is the first study to provide estimates of the CI and to decompose wealth-related inequalities in disability in Brazil. The study revealed that
BADL disabilities are concentrated among poor older adults. Additionally, the inequalities in BADL disability were mainly explained by SES (wealth and own education), and a smaller percentage was explained by demographic and health factors. Analyses controlling for demographic and health factors highlighted the inequities in disability among older adults in Brazil. Even though the burden of disability is greater among poor older adults in Brazil, the Family Health Strategy, a government program aimed at improving access to health services, still lacks coverage for nearly 30% of the poorest individuals in Brazil18.
Socioeconomic inequalities in disabilities have been consistently reported in Brazilian studies3–6,8,9. These studies provide important information about the social determinants
of disability in Brazil and, in general, they indicate that individuals with lower education
and income have worse health indicators than those who are better off3,4,7–9. However, the
comparison of our study with these previous studies is difficult given the different measures of inequality used, and they also have not provided the varying contributions of different
factors to that inequality. Our study addressed some of the limitations in the existing literature and examined the contributions of demographic, health, and socioeconomic determinants to inequality.
The decomposition of the concentration index distinguished the contributions of each
determinant related to wealth-related inequality in BADL. Some factors, such as age and sex, are not amenable to changes in policy, whereas socioeconomic conditions can respond to these changes. Identifying which determinant contributes to a larger share of wealth-related inequalities in disability is important as socioenomic inequalities are avoidable14,19. Despite
the differences in the prevalence of disability by age and sex, we found that demographic
factors explain only a small percentage of BADL disparities. In fact, SES explained most BADL inequalities. Wealth contributed to more than half of the total inequality, while own
education contributed to nearly 35% of that total inequality. These findings reinforce the
importance of examining the various determinants of health inequalities in old age, as each determinant can carry unique contributions20.
The fact that SES determinants explain most of the inequalities in disability highlights the
need for changes in policies related to improving educational levels, reducing economic inequalities, and improving health care access. Evidence from longitudinal data shows that individuals with no schooling not only have higher rates of disability onset, but they also have lower rates of recovery21. Given that educational levels are typically established by early
adulthood and are relatively constant among older persons22, investiments in education
worse off tend to have less opportunities to obtain higher education levels, because of factors such as workload, difficulty in paying for private school6, and overall lower prestige, status,
and control23. Nonetheless, current socioeconomic circumstances matter as well24. Persons
with lower SES may have a higher likelihood of a health condition resulting in activity limitation. Poor health conditions and disability may lead to additional expenditures (such as health care, transportation, assistive devices, personal assistance, and house adaptation)6
that can overwhealm families and individuals at the bottom of the social gradient. Persons
who are wealthier in old age can afford a wider range of facilities to either improve or keep
good physical functioning. Under these circumstances, a possible way to reduce inequalities in disability at older ages may be providing more equitable, universal, and better care to
those who cannot afford it. There is some evidence that access to health care and doctor
visits have been increasing in Brazil25, which in turn may be reducing the gap in health levels
between SES groups. Therefore, expanding public health care and rehabilitation services6
and improving accessibility26 and home care are important ways to reduce the inequalities3.
Even though chronic conditions contributed to a small share of the inequality, they were more concentrated among the wealthiest individuals. However, information on chronic
conditions is based on self-reported data, in which knowledge and reporting can differ across
SES groups. Wealthier individuals are more likely to have a diagnosed chronic condition as they have more access to healthcare27. Often, healthier lifestyles such as engaging in
physical activity are also concentrated among wealthier individuals. As a result, wealthier individuals can live longer with diseases and may be less likely to experience disability.
This study has important strengths. First, the findings of this study are based on data from
a nationally representative sample of older adults in the largest country in Latin America. Second, the data also included several socioeconomic indicators that were used to examine their contribution to wealth-related inequalities in disability. Finally, to the best of our
knowledge, this was the first study to measure wealth-related inequality using CI and to
decompose the contribution of its determinants. Nonetheless, the study is based on cross-sectional data that prevents us from analyzing how changes in socioeconomic conditions
influence disability trends. In addition, the socioeconomic ranking was derived from a
measure of wealth that was based on an index of household assets and characteristics, which does not include other wealth domains, such as savings, that can be associated with living standards. Moreover, the data were collected from community-dwelling individuals,
thus excluding the ones in institutions who are more likely to be disabled. This in turn has
the potential to increase the prevalence of BADL disability. However, less than 1% of the older adults in Brazil are in long-term care institutions28.
This study showed that avoidable wealth-related inequities persist in BADL disability. The
strong contribution of SES factors highlights the need for improvements in public health policies that promote equity, universality, and integrality, such as the Family Health Strategy,
and improve home nursing public services. To increase the effectiveness of preventive and
rehabilitation strategies, which reduce activity limitations, it is necessary to go beyond the determinants of disability, fostering health-related behaviors and promoting mental health. It is necessary to combine those actions with interventions focused on social determinants, particularly among the poorest individuals in the country.
REFERENCES
1. World Health Oranization; National Institutes of Health, National Institute of Aging. Global health and aging. Bethesda: NIH; 2011 [cited 2018 Jun 7]. (NIH Publication, 11-7737). Available from: http://www.who.int/ageing/publications/global_health.pdf
2. Lima-Costa MF, Peixoto SV, Malta DC, Szwarcwald CL, Mambrini JVM. Informal and paid care
for Brazilian older adults (National Health Survey, 2013). Rev Saude Publica. 2017;51 Supl 1:6s.
3. Lima-Costa MF, Mambrini JV, Peixoto SV, Malta DC, Macinko J. Socioeconomic inequalities in activities of daily living limitations and in the provision of informal and formal care for
noninstitutionalized older Brazilians: National Health Survey, 2013. Int J Equity Health.
2016;15(1):137. https://doi.org/10.1186/s12939-016-0429-2
4. Lima-Costa MF, De Oliveira C, Macinko J, Marmot M. Socioeconomic inequalities in
health in older adults in Brazil and England. Am J Public Health. 2012;102(8):1535-41.
https://doi.org/10.2105/AJPH.2012.300765
5. Hosseinpoor AR, Stewart Williams JA, Gautam J, Posarac A, Officer A, Verdes E, et al. Socioeconomic inequality in disability among adults: a multicountry
study using the World Health Survey. Am J Public Health. 2013;103(7):1278-86.
https://doi.org/10.2105/AJPH.2012.301115
6. Mitra S, Posarac A, Vick B. Disability and poverty in developing countries: a multidimensional
study. World Dev. 2013;41:1-18. https://doi.org/10.1016/j.worlddev.2012.05.024
7. Leite IC, Valente JG, Schramm JMA, Oliveira AF, Costa MFS, Campos MR, et al. National and regional estimates of disability-adjusted life-years (DALYs) in Brazil, 2008: a systematic analysis.
Lancet. 2013;381 Spec Nº:S83. https://doi.org/10.1016/S0140-6736(13)61337-9
8. Lima-Costa MF, Facchini LA, Matos DL, Macinko J. [Changes in ten years of social inequalities
in health among elderly Brazilians (1998-2008)]. Rev Saude Publica. 2012;46 Supl 1:100-7.
Portuguese. https://doi.org/10.1590/S0034-89102012005000059
9. Lima ALB, Lima KC. Activity limitation in the elderly people and inequalities in Brazil. Open
Access Libr J. 2014;1(4):1-9. https://doi.org/10.4236/oalib.1100739
10. Fillenbaum GG, Blay SL, Pieper CF, King KE, Andreoli SB, Gastal FL. The association of
health and income in the elderly: experience from a southern state of Brazil. PloSOne.
2013;8(9):e73930. https://doi.org/10.1371/journal.pone.0073930
11. Konings P, Harper S, Lynch J, Hosseinpoor AR, Berkvens D, Lorant V, et al. Analysis of
socioeconomic health inequalities using the concentration index. Int J Public Health.
2010;55(1):71-4. https://doi.org/10.1007/s00038-009-0078-y
12. Wagstaff A, Paci P, Doorslaer E. On the measurement of inequalities in health. SocSci Med.
1991;33(5);545-57. https://doi.org/10.1016/0277-9536(91)90212-U
13. Lima-Costa MF, Andrade FB, Souza Jr PRB, Neri AL, Duarte YAO, Castro-Costa E et al.
The Brazilian Longitudinal Study of Aging (ELSI-Brazil): objectives and design. Am J
Epidemiol.2018;187(7):1345-53. https://doi.org/10.1093/aje/kwx387.
14. O’Donnell O, Doorslaer E, Wagstaff A, Lindelow M. Analyzing health equity using household survey data: a guide to techniques and their implementation. Washington (DC): The World Bank; 2008 [cited 2018 Jun 7]. Available from: http://siteresources.worldbank.org/INTPAH/Resources/ Publications/459843-1195594469249/HealthEquityFINAL.pdf
15. Kakwani N, Wagstaff A, Doorslaer E. Socioeconomic inequalities in health:
measurement, computation, and statistical inference. J Econom. 1997;77(1):87-103.
https://doi.org/10.1016/S0304-4076(96)01807-6
16. Doorslaer E, Wagstaff A, Calonge S, Christiansen T, Gerfin M, Gottschalk P, et al. Equity in the
delivery of health care: some international comparisons. J Health Econ. 1992;11(4):389-411.
https://doi.org/10.1016/0167-6296(92)90013-Q
17. World Bank. ADePT: software platform for automated economic analysis. Washington (DC); 2016.
18. Macinko J, Lima-Costa MF. Horizontal equity in health care utilization in Brazil, 1998–2008. Int
J Equity Health. 2012;11(1):33. https://doi.org/10.1186/1475-9276-11-33
19. Devaux M, Looper M. Income-related inequalities in health. Paris: OECD; 2012 [cited 2018 Jun 7]. (Health Working Papers, 58).
20. Darin Mattsson A, Fors S, Kreholt I. Different indicators of socioeconomic position and their
relative importance as determinants of health in old age. Int J Equity Health. 2017;16(1):173.
https://doi.org/10.1186/s12939-017-0670-3
21. Beltrán-Sánchez H, Andrade FC. Educational and sex differentials in life expectancies and
disability-free life expectancies in São Paulo, Brazil, and urban areas in Mexico. J Aging Health.
2013;25(5):815-38. https://doi.org/10.1177/0898264313491425
22. Camelo LV, Figueiredo RC, Oliveira-Campos M, Giatti L, Barreto SM. [Healthy behavior
patterns and levels of schooling in Brazil: time trend from 2008 to 2013]. CiencSaude Coletiva.
23. Kawachi I, Adler NE, Dow WH. Money, schooling, and health:
mechanisms and causal evidence. Ann N Y Acad Sci. 2010;1186(1):56-68.
https://doi.org/10.1111/j.1749-6632.2009.05340.x
24. Toge AG, Bell R. Material deprivation and health: a longitudinal study. BMC Public Health.
2016;16:747. https://doi.org/10.1186/s12889-016-3327-z
25. Mullachery P, Silver D, Macinko J. Changes in health care inequity in Brazil between 2008 and
2013. Int J Equity Health. 2016;15(1):140. https://doi.org/10.1186/s12939-016-0431-8
26. Castro SS, Cieza A, Cesar CL. Problems with accessibility to health services by
persons with disabilities in São Paulo, Brazil. Disabil Rehabil. 2011;33(17-18):1693-8.
https://doi.org/10.3109/09638288.2010.541542
27. Louvison MCP, Lebrão ML, Duarte YAO, Santos JLF, Malik AM, Almeida ES. [Inequalities in
access to health care services and utilization for the elderly in São Paulo, Brazil]. Rev Saude
Publica. 2008;42(4):733-40. Portuguese. https://doi.org/10.1590/S0034-89102008000400021
28. Camarano AA, Kanso S. As instituições de longa permanência para idosos no Brasil. Rev Bras
Estud Popul. 2010;27(1):232-5. https://doi.org/10.1590/S0102-30982010000100014
Funding: The ELSI-Brazil baseline study was supported by the Brazilian Ministry of Health (DECIT/SCTIE —
Department of Science and Technology from the Secretariat of Science, Technology, and Strategic Inputs (Grant
404965/2012-1), COSAPI/DAPES/SAS — Healthcare Coordination of Older Adults, Department of Strategic and
Programmatic Actions from the Secretariat of Health Care) (Grants 20836, 22566, and 23700), and the Brazilian Ministry of Science, Technology, Innovation, and Communication.
Authors’ Contribution: FBA, JLT, FCDA participated on the study concept and design, data analysis and
interpretation, drafting of manuscript. YAOL, MFLC, PRBJ participated on data analysis and interpretation,
drafting of manuscript. All authors approve the final submitted version.