Faculdade de Ciências do Mar e do Ambiente
Ecological indicators and gear-based
management of Algarve coastal fisheries
(dissertação para a obtenção do grau de mestre em Aquacultura e Pescas)
Telma Lúcia Pereira dos Santos Coelho Conduto
Faro
2007
Nome: Telma Lúcia Pereira dos Santos Coelho Conduto.
Faculdade de Ciências do Mar e do Ambiente da Universidade do Algarve.
Orientador: Doutor Karim Erzini, Professor Associado com Agregação da Faculdade de
Ciências do Mar e do Ambiente da Universidade do Algarve.
Data: 25 de Julho de 2007, pelas 10 horas.
Título da Dissertação: “ECOLOGICAL INDICATORS AND GEAR-BASED MANAGEMENT OF
ALGARVE COASTAL FISHERIES”.
Júri:
Presidente:
Doutor Adelino Vicente Mendonça Canário, Professor Catedrático da Faculdade de Ciências do Mar e do Ambiente da Universidade do Algarve.
Vogais:
Doutor Kostantinos Stergiou, Associate Professor, Aristotle University, Grécia;
Doutor Karim Erzini, Professor Associado com Agregação da Faculdade de Ciências do Mar e do Ambiente da Universidade do Algarve;
Doutora Maria Teresa Calvinho Cerveira Borges, Professora Auxiliar da Faculdade de Ciências do Mar e do Ambiente da Universidade do Algarve.
I thank Professor Dr. Karim Erzini for all his support and valuable comments on this report.
I thank Professor Dr. Karim Erzini and Professor Dr. Teresa Borges and everyone involved in the projects that allowed carrying out this study for all the planning, execution and database building of the fishing operations.
I thank the Erasmus program for the scholarship and Kiel University for welcoming me at Kiel, a beautiful city.
I thank Dr.Uwe Piatkowski and IFM-Geomar at Kiel, for all the logistics provided during the study period in Kiel.
I thank Margit for her point of view of many aspects of living in Kiel.
I thank my parents for all the financial help that allowed me to go to Kiel.
I thank my colleagues at Servisair. The good advices during the last two years gave me motivation to go on.
I am very grateful to my husband for his support during all the time of this study. Without him it would have been impossible to participate in this course and this thesis.
A number of ecological indicators were used to study the impact of fishing gear on the Algarve marine ecosystem. Catch composition, species richness, diversity, mean length, trophic level, percentage of mature and optimum sized fish and percentage of megaspawners were determined for the fish catches of each gear type. Four types of static gears (gill nets, trammel nets, bottom longline and semi-pelagic longline) with different mesh sizes or hook sizes represented the small-scale fisheries and were studied using data from experimental fishing trials, while commercial catches of two trawling types, crustacean trawling and fish trawling exemplified the industrial fisheries. Different species dominated the catches of the different main gears. Gill nets were clearly differentiated by the low trophic levels. Semi-pelagic longline caught larger fish with high trophic levels. Trammel nets also had high percentage of mature individuals in the catches, but also more non-target species. The trawlers affected juveniles of many species. Larger mesh sizes caught larger individuals, though not necessarily mature. The ordination procedure revealed how gear catches are best characterized by the different indicators and catch composition. Technical interactions were apparent when some gears affected juveniles of target species of other gears. Management recommendations such as minimum legal size, closed areas, gear restrictions and modifications are provided. Fishers participation in management can be enhanced by explanations of these simple indicators. Public participation can be extremely important for supporting unpopular management measures.
Resumo
Diversos indicadores ecológicos foram aplicados na avaliação do impacto das diferentes artes de pesca no ecossistema da costa algarvia. Composição das capturas, riqueza específica, diversidade, comprimento médio, nível trófico, percentagens de peixes maduros, de comprimento óptimo e altamente fecundos foram determinados para as capturas de peixe de cada tipo de arte. Quatro tipos de artes fixas (redes de emalhar, redes de tresmalho, palangre de fundo e palangre semi-pelágico) com diferentes malhagens ou anzóis representaram a pequena pesca e foram estudados através de experiências de pesca, enquanto as capturas comerciais de dois tipos de arrasto, o arrasto de crustáceos e o arrasto de peixe, exemplificaram as pescas industriais. Diferentes espécies dominaram as capturas das diferentes artes. A rede de emalhar foi diferenciada pelo baixo nível trófico das capturas. O palangre semi-pelágico capturou indivíduos com maior tamanho, mais altas percentagens de adultos e com alto nível trófico. As redes de tresmalho capturaram também altas percentagens de adultos mas também afectaram muitas espécies acessórias. Os arrastos afectaram juvenis de muitas espécies. Maiores malhagens capturaram maiores indivíduos mas não necessariamente adultos. A ordenação revelou como as capturas de cada arte eram caracterizadas pelos diferentes indicadores e pela composição especifica. Interacções técnicas foram aparentes quando algumas artes afectaram juvenis de espécies alvo de outras artes. Recomendações de gestão foram providenciadas como o tamanho mínimo, áreas restritas ou limitações e modificações nas artes. A participação dos pescadores na gestão pode ser acentuada por explicações destes simples indicadores. O envolvimento dos consumidores pode ser muito importante para forçar medidas de gestão menos populares.
Keywords: ecological indicators; gear-based management; fisheries sustainability; scientific
Index
1. INTRODUCTION ...1
2. MATERIALS AND METHODS...6
2.1 Data sources ...6
2.2 Study site ...6
2.3 Fishing gears and sampling procedure...7
2.4 Analysis methodology...12
2.4.1 The data ...12
2.4.2 Species relative composition of catches ...12
2.4.3 Indicators ...13
2.4.3.1 Size-based indicators ...13
2.4.3.2 Species-based indicators...14
2.4.3.3 Trophodynamics indicator...15
2.4.4 Multivariate analysis ...17
2.4.5 The ecological indicators at the species level...19
3. RESULTS ...20
4. DISCUSSION...46
5. CONCLUSIONS...57
Table Index
Table 1.1 Examples of application of ecological indicators 5 Table 2.1. Gear size designations, fishing location and depth ranges, main target species for
each gear and reference publications. 8 Table 2.2. Types of ecological indicators used for evaluating fishing impact. 16
Table 3.1 Relative abundance and cumulative abundance of the most important species. For
description of species designations see Table 3.3. 21 Table 3.2 Results of the one way ANOVA and a pair wise comparisons (Tukey HSD) of each
main gear types studied for (a) mean length of fish, (b) trophic level of fish, (c) diversity index Shannon-Wiener for fish, (d) number of fish species, (e) mature fish, (f) optimum
length and (g) megaspawners. 27 Table 3.3 Most abundant invertebrate and fish species caught by the gill nets, longlines,
trammel nets and trawls. 32 Table 3.4 Indicators (length at maturity, optimum length and megaspawners) of the most
important species in number for each gear size of gill net, bottom longline and
semi-pelagic longline. 44 Table 3.5 Indicators (length at maturity, optimum length and megaspawners) of the most
important species in number for each gear size of trammel net, crustacean trawl and fish
trawl. 45
Figure Index
Figure 2.1 Map of the Algarve (southern Portugal, north-east Atlantic) with the representation of the traditional fishing grounds for each gear. The dashed lines represent the isobaths (m)
(adapted from ERZINI et al., 2001a). 6 Figure 3.1 Cumulative percentage contribution of caught species by the different mesh sizes of
gill net. For description of species designations see Table 3.3. The labels of the less
important species were removed for clarity. 22 Figure 3.2 Cumulative percentage contribution of caught species by the different hook sizes of
bottom longline. For description of species designations see Table 3.3. The labels of the
less important species were removed for clarity. 23 Figure 3.3 Cumulative percentage contribution of caught species by the different hook sizes of
semi-pelagic longline. For description of species designations see Table 3.3. The labels of
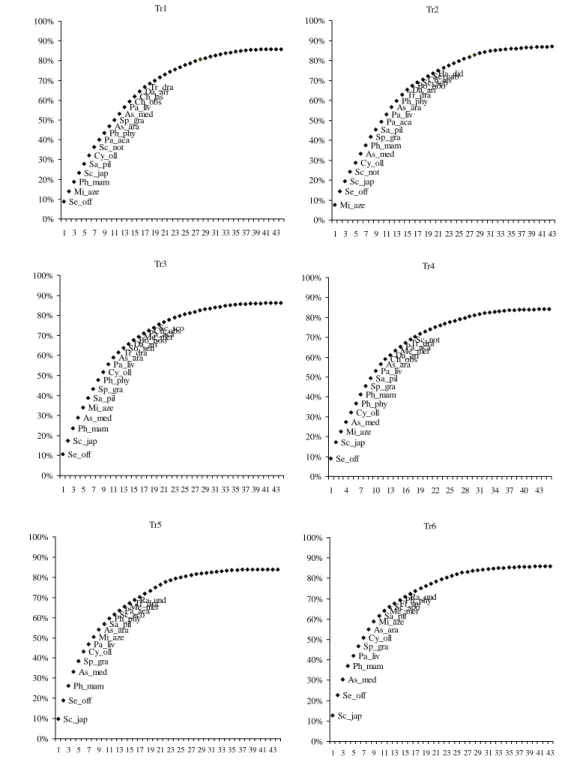
the less important species were removed for clarity. 24 Figure 3.4 Cumulative percentage contribution of caught species by the different mesh sizes
combinations of trammel nets. For description of species designations see Table 3.3. The
labels of the less important species were removed for clarity. 25 Figure 3.5 Cumulative percentage contribution of caught species by the two different métiers of
trawls. For description of species designations see Table 3.3. The labels of the less
important species were removed for clarity. 26 Figure 3.6 Boxplots of mean length, mean trophic level, mean Shannon-Wiener diversity index
and mean number of species of fish caught by each of the six main gear types. Bars are standard deviations. Table 3.2 presents the statistical analysis of the gear comparisons. (G: gill net; L: bottom longline; Ls: semi-pelagic longline; Tr: trammel net; Tw1: crustacean
Figure 3.7 Boxplots of percentage of Mature fish, Optimum length fish and Megaspawners by each of the six main gear types. Bars are standard deviations. Table 3.2 presents the statistical analysis of the gear comparisons. (G: gill net; L: bottom longline; Ls:
semi-pelagic longline; Tr: trammel net; Tw1: crustacean trawl; Tw2: fish trawl). 29 Figure 3.8 Boxplots of mean length, mean trophic level, mean Shannon-Wiener diversity index
and mean number of species of fish caught by each size of the six gear types. Bars are standard deviations. (G: gill net; L: bottom longline; Ls: semi-pelagic longline; Tr: trammel net; Tw1: crustacean trawl; Tw2: fish trawl; for description of gear sizes see
Table 2.1). 30 Figure 3.9 Relative abundance of immature, mature, optimum length and megaspawners for
each gear size (G: gill net; L: bottom longline; Ls: semi-pelagic longline; Tr: trammel net; Tw1: crustacean trawl; Tw2: fish trawl; for description of gear sizes see Table 2.1). 31 Figure 3.10 a) Multidimensional scaling plot and b) clustering based on Bray-Curtis for fish
catch in the 20 fishing gear and mesh or hook size categories. 33 Figure 3.11 Plot of variables (species) of the PCA on the matrix of the gear sizes for 47 species
of fish. Representation of active categories on the a) first two factorial axes, b) third and fourth factorial axes. This shows the relationships between the species and the fishing gear (bold). See Table 3.2 for description of species and for description of gear sizes see Table
2.1. 34
Figure 3.12 PCA plot of indicators on the matrix of the gear sizes. Representation of active categories on the a) first two factorial axes, b) third and fourth factorial axes. This shows the relationships between the indicators (bold) and the fishing gear. For description of
indicators see Table 2.2 and for description of gear sizes see Table 2.1. 36 Figure 3.13 Mean length at catch, length at maturity, optimum length, megaspawners length
and minimum legal size of Diplodus vulgaris, D. bellottii, D. sargus, Pagellus acarne, P.
erythrinus, Pagrus pagrus, Spondyliosma cantharus and Boops boops. 37
Figure 3.14 Mean length at catch, length at maturity, optimum length and megaspawners length of Scorpaena notata, Trachinus draco plus minimum legal size for Sardina plichardus and
Trachurus trachurus. 39
Figure 3.15 Mean length at catch, length at maturity, optimum length and megaspawners length of Benthodesmus elongates, Macroramphosus sp., Phycis phycis, and Micromesistiou
poutassou plus minimum legal size for Scomber japonicus and Mullus surmuletus. 40
Figure 3.16 Mean length at catch, length at maturity, optimum length, megaspawners length
and minimum legal size of Microchirus azevia, Solea senegalensis. 41 Figure 3.17 Mean length at catch, length at maturity, optimum length, megaspawners length
and minimum legal size of Conger conger and Sepia officinalis. 41 Figure 3.18 Mean length at catch, length at maturity, optimum length and megaspawners length
of Etmopterus pusillus, Galeus melastomus plus minimum legal size for Scyliorhinus
canicula and Merluccius merluccius. 42
Figure 3.19 Mean length of carapace at catch and minimum legal size of carapace of A.
1. Introduction
Natural resources are being depleted much faster than these can replenish themselves, many of the world fisheries are not maintained at sustainable levels and many commercially important stocks have already collapsed or been reduced to very low levels (NRC, 1999; JENNINGS et al., 2001; PAULY et al., 2002) but human impacts are still accelerating in their magnitude, rates of change and diversity of processes responsible for changes over time (JACKSON et al., 2001).
Fishing affects fish communities through selective removal of target species, bycatch, habitat modification, resulting in changes in overall biomass, species composition and size structure. The extent of the response depends on life history characteristics of the individual species, trophic interactions among species and the type of changes in the physical habitat (BIANCHI et al., 2000; FRID et al., 2005).
Fisheries management consists of applying a set of fishery control measures in order to bring some measured parameter of a fish stock towards a specific target, with the objective of optimising some specified aspect of the fishery (PATTERSON, 1992). The main biological objective of fisheries management is to protect the resources from overexploitation that would jeopardize future production, i.e. maintain sustainability. Fishing activities are sustainable when do not cause or lead to undesirable changes in biological and economic productivity, biological diversity or ecosystem structure and functioning from one human generation to the next. In many cases, this implies a need to rebuild populations of exploited species and to promote recovery of ecosystems from effects of overexploitation (NRC, 1999; JENNINGS et al., 2001). Unsustainable fishing practices arise from inappropriate incentives, high demand for limited
2006). However, a historical perspective is crucial for remediation and restoration (JACKSON
et al., 2001) (e.g. when a large part of the fish populations’ distribution is outside the range of
fishing operations and many large, old, fecund females remain untouched, sustainability in fisheries can be achieved (PAULY et al., 2002)).
The traditional single-species approach simplifies the system by omitting details of ecosystem complexity, ignoring the mixed-species aspect of a fishery and not reflecting the indirect effects of fishing that can have more important impacts on marine ecosystem structure and dynamics than do removals of the fish themselves. Problems that have arisen in the context of fisheries management based on single species approaches include stock collapses, shifts in trophic structure, habitat degradation, incidental take and bioeconomic problems (BOTSFORD
et al., 1997). Management of fisheries must consider the whole system to provide a realistic
ecological perspective and move towards sustainable fisheries. Ecosystem-based fishery management acknowledges the critical role of ecosystem processes starting with the ecosystem rather than the target species and its overall objective is to sustain healthy marine ecosystems and the fisheries they support. However, it requires a complex understanding of ecosystem dynamics and the organization of component communities, as well as the dependence of humans on these ecosystems. To some extent, ecosystem-based management is limited by the data requirements and insufficiency of data and fluctuating environments mean there are commonly substantial uncertainties in analysing the effects of fishing on the ecosystem. Where knowledge is not enough, precautionary measures that favour the ecosystem should be adopted (BOTSFORD et al., 1997; NRC, 1999; PIKITCH et al., 2004).
The implementation of an ecosystem-based approach includes having ecosystem objectives (e.g. predator population health); bycatch concerns; multispecies assessments; modification of gears (e.g. to reduce, repel or exclude certain species); categorization of habitats according to their sensitivity to fishing; recognition of ecological dependence (e.g. limit
catches of target fish that are prey of another targeted species); genetic diversity (e.g. maintain large populations and avoid local depletions); assessment of the impact of the management measures (FRID et al., 2005). The challenge of ecosystem-based fisheries management is to catch the target fish at a sustainable level with minimum effects on the size structure of the target population, non target species, trophic chain and physical environment (BOTSFORD et
al., 1997; CHUENPAGDEE et al., 2003; FRID et al., 2005). Nevertheless, harvesting at a
sustainable rate can, with a small change in age of selection, become unsustainable and lead to commercial extinction of the stock unless remedial action is taken (MYERS and MERTZ, 1998).
Decisions have to be made before the resources are depleted (NRC, 1999) and objectives must be clearly specified (what is to be achieved or what needs to be avoided) and to determine whether objectives are met, the manager needs indicators (GARCIA and STAPLES, 2000; JENNINGS et al., 2001) to summarize large quantities of information into a few relevant signals (GARCIA et al., 2000). Ecological indicators can be used to describe the state of the ecosystem (Table 1.1) and to assess strategies regarding sustainable development objectives and action. They need to capture the complexities of the ecosystem yet remain simple enough to be easily and routinely monitored and should meet the following criteria: be easily measured, be sensitive and responsive to stress (e.g. fishing) in a predictable manner, be anticipatory (i.e. identify a substantial change before it occurs), be integrative (i.e. when aggregated with other indicators provide an assessment of the entire system), have low variability (DALE and BEYELER, 2001; PIET and JENNINGS, 2005), be readily understood and cost-effective (SHIN et al., 2005). Reference points for the indicators must be derived from broader management objectives and they may be targets (to be achieved) or limits (to be avoided) while indicators are determined from measurements in catches (SAINSBURY et al., 2000).
Management of the fishery has also to consider fisher behaviour (e.g. gear used, target species, fishing locations, vessel and crew) and not just focus on the resource. Gear type and use vary in efficiency of fish capture, selectivity and composition of catches. A well managed fishery is expected to use gear that catch most of the available species at sizes that do not undermine sustainability. In this view, an understanding of gear impact on the ecosystem and potential resource overlap between gears is important for management decisions as different gears may differentially impact the exploited stocks (AGNEW et al., 2000; PELLETIER and FERRARIS, 2000; MCCLANAHAN and MANGI, 2004; FRÉDOU et al., 2006). Restraints that affect how, when and where the fish are caught can ensure that ecosystem functions that support fisheries productivity are preserved (ALLISON and ELLIS, 2001).
Detailed scientific information must be translated to recommendations useful to managers and applied to policy and decision-making through a policy dialogue (RAAKJÆR et
al., 2007). Policy makers and other stakeholders sometimes do not use information because it is
not communicated to them in a way that is relevant and understandable. Fishing quotas are decided on the basis of political considerations, largely ignoring the scientific advice and typically legalizing catches beyond safe levels, risking the eventual collapse of fish stocks rather than social or political conflict (BOTSFORD et al., 1997; FROESE, 2004). Currently in the North Sea there are more stocks outside safe biological limits than ever before, though scientific advice has been given for decades. However, advice has been available for only a limited number of species and stocks (FRID et al., 2005) and changes in demand have made more resources susceptible to overexploitation.
Ecological indicators can allow a more easy understanding of the impact of gears in the ecosystem and translate complex scientific information to more stakeholders, including fishers, fish dealers, supermarket managers, consumers and politicians (e.g. FROESE, 2004).
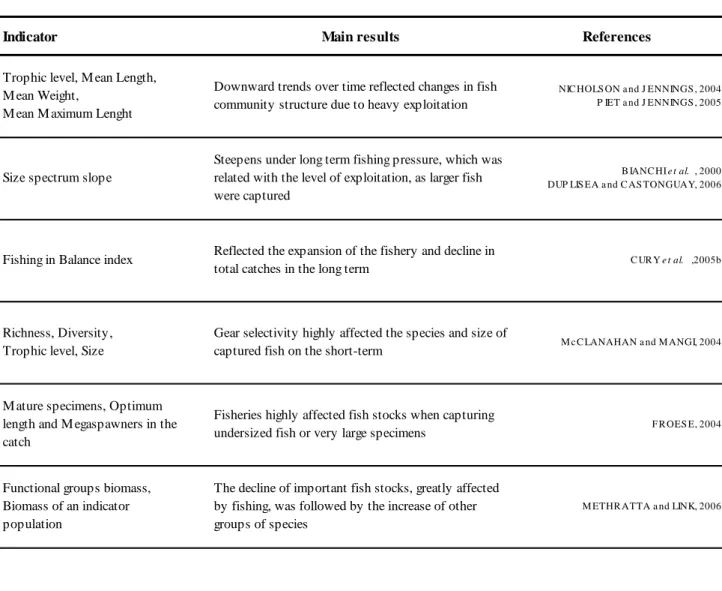
Table 1.1 Examples of application of ecological indicators.
Indicator Main results References
Trophic level, M ean Length, M ean Weight, M ean M aximum Lenght
Downward trends over time reflected changes in fish community structure due to heavy exploitation
NIC HOLS ON a nd J ENNINGS , 2004 P IET a nd J ENNINGS , 2005
Size spectrum slope
Steepens under long term fishing pressure, which was related with the level of exploitation, as larger fish were captured
B IANC HI e t al. , 2000 DUP LIS EA a nd C AS TONGUAY, 2006
Fishing in Balance index Reflected the expansion of the fishery and decline in
total catches in the long term C UR Y e t al. ,2005b
Richness, Diversity, Trophic level, Size
Gear selectivity highly affected the species and size of
captured fish on the short-term M c C LANAHAN a nd M ANGI, 2004
M ature specimens, Optimum length and M egaspawners in the catch
Fisheries highly affected fish stocks when capturing
undersized fish or very large specimens F R OES E, 2004
Functional groups biomass, Biomass of an indicator population
The decline of important fish stocks, greatly affected by fishing, was followed by the increase of other groups of species
M ETHR ATTA a nd LINK, 2006
The purpose of this study is to describe the impact on the ecosystem of artisanal fisheries and trawl fisheries in terms of the diversity, species composition, size and life history stages in catches and trophic level of the catches, describe the competition between gears with the ecological indicators, demonstrate how ecological indicators can be translated and influence the general public and provide suggestions on how ecological indicators can be used to improve management actions.
2. Materials and Methods
2.1 Data sources
The data used in the present study came from gear selectivity experiments and projects on the bycatch of commercial fishing. For a more detailed description of the sampling design and methodology see ERZINI et al. (1999): gill net and bottom longline fisheries; ERZINI et
al. (2000; 2001a): semi-pelagic longline fishery; ERZINI et al. (2001b) and STERGIOU et al.
(2006): trammel net fishery; BORGES et al. (2000; 2002) and ERZINI et al. (2002): trawling fisheries.
2.2 Study site
Studies were undertaken along the Algarve coast at depths from 15m to 700m and fishing sites were chosen according to the traditional activities in the area (Figure 2.1).
Figure 2.1 Map of the Algarve (southern Portugal, north-east Atlantic) with the representation of the traditional fishing grounds for each gear. The dashed lines represent the isobaths (m) (adapted from ERZINI et al., 2001a).
2.3 Fishing gears and sampling procedure
The fishing tactic (or métier) is described by the combination of the fishing location, the gear to use and, in some cases, the target species or group of target species. Though target species may not be reflected accurately in the catch, they are by definition tied to the fisher decision (e.g. PELLETIER and FERRARIS, 2000).
Six different fishing gears were studied. Four main static gears were sampled in fishing experiments of artisanal small-scale coastal fisheries: bottom longline, semi-pelagic longline, gill net and trammel net, where small scale fishing vessels were used for the fishing trips. For industrial fishing, the studied gears were trawlers (active gears): crustacean trawl and the fish trawl. The different fishing tactics targeted several species and fishing took place at depth ranges, which included the continental shelf and the continental slope (Table 2.1).
Besides the type, static gears were further differentiated by technical characteristics; longlines by hook size; gill nets by mesh size; trammel nets by the inner and outer panel mesh size combinations.
A description of the gears used, fishing grounds, depths and target species is given in Table 2.1. Sampling took place using commercial small scale fishing vessels and professional fishers carried out all fishing operations.
The nets and the longlines are static gears and represent the small-scale fisheries. They were constructed according to design specifications appropriate for each métier and the fishing technique applied in the fishing experiments was as similar as possible to the traditional fishing activities. Fishers selected fishing grounds in traditional areas, accordingly to the gear in use, in order to ensure the highest possible catches. Normal artisanal fishing operations were carried out regarding setting time, soak duration and hauling of the gear.
Table 2.1. Gear size designations, fishing location and depth ranges, main target species for each gear and reference publications.
Gear and gear designation
Gear sizes and designations
Fishing location and depth
Target species References
Gill net G
Mesh size (nominal bar length): 25 mm – G1 30 mm – G2 35 mm –G3 40 mm –G4 Albufeira-Faro: 15 m – 60 m Mullet (Mullus surmuletus) ERZINI et al. (1999) Bottom longline L Hook size: 11 – L1 12 – L2 13 – L3 15 (smallest) – L4 Albufeira-Faro: 15 m – 60 m
White sea breams (Diplodus sp.) Red sea breams
(Pagellus sp.) ERZINI et al. (1999) Semi-pelagic longline Ls Hook size: 5 – Ls1 7 – Ls2 9 – Ls3 10 (smallest) – Ls4 Faro –Fuzeta: 200 m – 700 m Hake (Merluccius merluccius)
ERZINI et al. (2001a)
Trammel net Tr
Inner / outer mesh size: 100/600 mm – Tr1 100/800 mm – Tr2 120/600 mm – Tr3 120/800 mm – Tr4 140/600 mm – Tr5 140/800 mm – Tr6 Albufeira-Faro: 15 m – 100 m Cuttlefish (Sepia officinalis) Flatfish (Soleidae) STERGIOU et al. (2006) ERZINI et al. (2006) Crustacean trawl Tw1 Tw1 Algarve coast: 200 m – 500 m Parapenaeus longirostris Aristeus antennatus Nephrops norvegicus MONTEIRO et al. (2001) ERZINI et al. (2002) BORGES et al. (2000; 2002) Fish trawl Tw2 Tw2 Algarve coast : 50 m – 300 m Chub Mackerel (Scomber sp.) Hake (Merluccius merluccius) ERZINI et al. (2002) BORGES et al. (2000; 2002)
RUTTAN et al. (2000) defined fishery scale in terms of vessel size or catch capacity. Low catches and smaller boats are typically associated with smaller crews, shorter travel distances and a greater degree of local consumption of catch, while higher catches and larger boats need larger crews and often operate further from shore.
Nets
Gill nets of four different mesh sizes were used in 40 fishing trials. The nominal bar lengths were: 25, 30, 35 and 40 mm. The net was made of 0.30 mm green monofilament, 40 meshes deep, with a hanging ratio in the floatline of 0.5. The floatline was 7 mm diameter nylon, while the leadline was 5 mm diameter nylon. The lead weights were 30 g and were placed at intervals of 70 cm along the leadline. Floats were spaced by 1.60 m along the floatline. The experimental nets consisted of 250 m sections of each mesh size in a random sequence separated by a 20 m rope. A total of 750 m of each mesh size were used for the fishing. These fishing experiments took place on the continental shelf at shallow depths of 15-60 m.
The trammel nets were of green monofilament and had the largest mesh sizes; 600 and 800 mm mesh for the outer panel and 100, 120 and 140 mm for the inner panel. A total of 25 nets of each of the following six combinations: 100/600, 100/800, 120/600, 120/800, 140/600 and 140/800 were used. The gears were set in the afternoon or evening before sunset and hauled after sunrise. The different sets of nets, with each combination arranged in 5 groups with 5 nets, were joined together by a footrope, leaving a 2 m gap between them so that fish are not led from one combination to the adjacent combination, thereby introducing error. The trammel nets consisted of 150 nets, totalling 8900 m, with 2500 m, 3000 m and 3400 m of each of the inner mesh sizes (100, 120 and 140 mm, respectively). Overall, 10 fishing trials per season were done during 1999-2000. These fishing experiments occurred at depths between 15 m and 100 m.
A description of each net and the experimental design is given in ERZINI et al.(1999; 2006) and STERGIOU et al. (2006).
Longlines
Two different types of longlines were studied: bottom longline (no floats) fish on the sea floor for demersal species, while semi-pelagic longlines have floats at regular intervals that lift the mainline off the bottom and are used for species that may be feeding 20 to 40m above the bottom in deep water. Each of these longlines also had different hook sizes that can be distinguished in different métiers.
The bottom longline is made of a main line of 1.1 mm diameter monofilament with gangions of 0.5 mm monofilament, 80 cm in length and spaced for about 1.7 m. Four hook sizes of MUSTAD round bend spade end hooks (numbers 15, 13, 12, 11) were used. Five longline tubs were used, each with a longline with four sections of 100 hooks of every size. The baited longline is set one to three hours either before sunrise or sunset and retrieved one to two hours after sunrise or sunset, respectively. Overall, 40 experimental fishing trials were carried out. These fishing experiments took place on the continental shelf at shallow depths of 15-60m. The semi-pelagic longline used consists of a 1.60 mm diameter monofilament main line with 0.90 mm diameter monofilament gangions of approximately 1.2 m attached without swivels, directly to the mainline, at intervals of approximately 1.8 m. The longlines are stored in plastic tubs with cork rims. Four hook sizes of the brand SIAPAL were used: 10 (smallest), 9, 7 and 5 (largest), with numbers 7, 8 and 9 being the most commonly used by the fishers. Each tub consisted of only one hook size. The longline is baited on the way to the fishing ground and is set by placing a tub on a platform at the stern and using the momentum of the boat to pay out the longline. The crew attaches glass balls to lift the longline off the bottom at intervals of 48 hooks (for tubs with 144 hooks) or 40 hooks (for tubs with 120 hooks). The longline is weighted down with small rocks at regular intervals. The length of the longline is 10-15 km. To retrieve the longline, a hydraulic hauler is used to lift the large weights and the longline rises to the surface due to the expanded gas bladders of the caught fish. As the longline is hauled, the floats and weight are removed and the longline is stored in the tubs. Typically, the
fishing trips started during the night and took 17-21 hours. A total of 64656 hooks were fished in 1997 and 51000 in 1998 in 10 fishing trips per year. These fishing experiments took place at depths between 200-700m on the continental slope. A description of each gear and the experimental design are given in ERZINI et al. (1999; 2001a).
Trawls
Trawls, representing industrial fishing, were distinguished based on the fishing strategy, with target species, fishing tactic and depth being distinct for the two trawl métiers. The chosen fishing grounds and the fishing operations were based on economic decisions taken by the trawl skipper after they leave the port. A description of the trawls and the experimental design is mentioned in ERZINI et al. (2002) and MONTEIRO et al. (2001). Crustacean trawlers fished at average depths greater than 200m, with the majority of tows taking place on the upper continental slope between 200 and 500m. Fish trawlers generally fished on the continental shelf between 100 and 200m but some tows were as shallow as 50m and others deeper than 300m. As the trawls target different species at different fishing depths with different fishing strategies, they are considered a priori distinct métiers (BORGES et al., 2002).
Scientific observers accompanied the fishers during each fishing trip. The catch coming on board all small scale fishing vessels was sorted by each gear size combination. Each specimen was measured (total length of fish, carapace length of crustaceans and mantle length for cephalopods) to the nearest 1 mm in the case of static gears (ERZINI et al., 1999, 2001b). In the case of the trawls, the whole catch or at least a randomly selected 30 kg sub-sample of every haul was sorted to species level and then counted, weighed (to the nearest g) and measured (to the nearest 5 mm) (ERZINI et al., 2002).
2.4 Analysis methodology
2.4.1 The data
A data matrix with relative abundances of all fishing trips of each gear size with species as variables was built. Only fishing trips with nonzero catch were considered. For each trip, absolute catch was transformed into a catch profile (i.e. relative species composition) by dividing each catch per species (in numbers) by the total catch of the trip. This removed the differences in catch levels between trips, which are often linked to both the time of the year, the crew size and the gear size (PELLETIER and FERRARIS, 2000).
Fish species considered rare were excluded from this analysis. The criterion for inclusion of a species in the analysis was to represent >1% of the total catch (by number) in at least one of the size categories of the main types of gears.
This study was based on a total of 20 categories of gear belonging to six main types of gear: gill net, bottom longline, semi-pelagic longline, trammel net, crustacean trawl and fish trawl. The cumulative percentage contribution of each species (in numbers) was calculated in order to identify the most important species.
2.4.2 Species relative composition of catches
Higher abundances of target species in the catches are a common goal of the different gears. Species relative abundance in catch composition for each gear and gear size was used to determine if the different gears achieve this objective.
2.4.3 Indicators
The selection of indicators from the large number described in the literature was based on the available data, their common use, their ecological meaning and sensitivity to fishing pressure (e.g. BIANCHI et al., 2000; ROCHET and TRENKEL, 2003; NICHOLSON and JENNINGS, 2004; TRAVERS et al., 2006). Three main categories of ecological indicators are considered in this study: size-based, species-based and trophodynamics indicators of the catch by main gear type and each gear size (Table 2.2). The indicators were calculated per fishing trip and then averaged. Data were pooled across all fish species.
2.4.3.1 Size-based indicators
Fishing is always size-selective, generally targeting larger, more valuable fish, modifying the structure and functioning of fish assemblages with consequences for productivity and resilience of some stocks. Size-based indicators may then provide a relevant integration of the effects of fisheries on the community structure and processes. The only data required is the size distribution of organisms (SHIN et al., 2005). For this analysis the data set consisted of the length frequency of the fish catch on daily trips.
Mean length
Mean length of the captured fish reflects the impact of the fishing gears on the fish community (or in the population when considering mean length at the species level) and quantifies relative abundances of large and small individuals of fish species in the catch. Relative abundances of the different fish species were summed for each 1 cm length interval.
Mature fish, Optimum length fish and Megaspawners
Mature fish is the percentage of the mature specimens in the catch. The target is 100%, as all fish should spawn at least once before they are caught in order to rebuild and maintain the healthy spawning stock (FROESE, 2004). Length at maturity accounts for changes in the relative abundance of species with different life history parameters (SHIN et al., 2005).
Optimum length is measured as the percentage of fish caught at optimum length, i.e. the length where the maximum yield and revenue can be obtained. The target would be to catch all fish (100%) within ± 10% of optimum length (FROESE, 2004).
The megaspawners indicator is measured as the percentage of old, large fish in the catch, i.e. fish larger than the optimum length plus 10% (FROESE, 2004). The larger individuals in a population can enhance the successful reproduction, recruitment and survival (BIRKELAND and DAYTON, 2005). Here the target should be 0%, i.e. no megaspawners being caught (FROESE, 2004). The megaspawners indicator was chosen because there is evidence that older fish produce more and better eggs as well as pass on their successful genes (LONGHURST, 2002). Maturation size, optimum length and megaspawners length were obtained from empirical equations of FROESE and BINOHLAN (2000) or FISHBASE (FROESE and PAULY,1998) and SANTOS et al. (2003) for European hake.
2.4.3.2 Species-based indicators
The Shannon-Wiener index (H’) is a mixed indicator that provides information about both species richness and species evenness and jointly with species richness can provide information about changes in ecosystem structure (GREENSTREET et al., 1999). Because fisheries are relatively species selective, but also induce indirect effects on non-targeted species, diversity index and number of species may be sensitive to gear impact.
2.4.3.3 Trophodynamics indicator
The food web is assumed to reflect the main interactions between individuals in a fish community (TRAVERS et al., 2006) and trophic level is expected to increase with size (SHIN
et al., 2005).
Mean trophic level of the catch
Mean trophic level of the catch was the indicator suggested to evaluate the fishery induced impact on the trophic structure of the exploited assemblage (PAULY et al., 2001, 2002) by the different gears. It is calculated as the average of the species trophic levels weighted by species relative biomass. Because the trophic level of a fish may change as it grows, using a fixed mean trophic level per species is an approximation used for highlighting the contribution of a species to the community and not changes in the trophic role of species in the food web (TRAVERS et al., 2006). Because direct observations of diet compositions were not available, trophic level estimates for each fish species are based on diet composition data compiled in FISHBASE (FROESE and PAULY, 1998) where diet information and standard errors may also be found. The trophic level of each fraction of the diet of the fish is used to calculate the mean trophic level for the species (PAULY et al., 2001; 2002). Weights of individuals were used directly if available and for individuals with no available weight, but with recorded length, individual length was converted to weight from species-specific length-weight regressions (DUPLISEA and CASTONGUAY, 2006): Weight=b*Lengtha, where b and a are parameters calculated in other studies of fish populations (BORGES et al., 2000, 2003; GONÇALVES et al., 1997; SANTOS et al., 2002) or available in FISHBASE (FROESE and PAULY, 1998). The formulae for calculating the different indicators are given in Table 2.2.
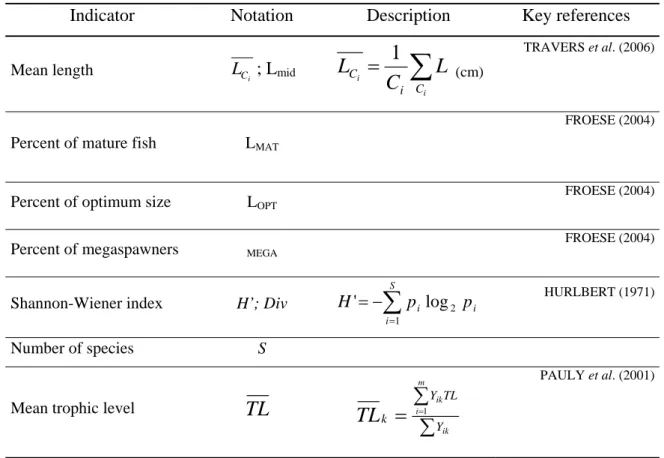
Table 2.2. Types of ecological indicators used for evaluating fishing impact.
Indicator Notation Description Key references
Mean length L ; LCi mid
=
∑
i i C i C
L
C
L
1
(cm) TRAVERS et al. (2006)Percent of mature fish LMAT
FROESE (2004)
Percent of optimum size LOPT
FROESE (2004)
Percent of megaspawners MEGA
FROESE (2004)
Shannon-Wiener index H’; Div
∑
= − = S i i i p p H 1 2 log ' HURLBERT (1971) Number of species S
Mean trophic level
TL
∑
∑
=
= ik m i ik Y TL Y kTL
1 PAULY et al. (2001)Note: L, body length of species i; Ci, abundance of fish of species i in the catch; pi, proportion of total number of individuals of
species i; S, number of species present in the catch; TLk, mean trophic level of the catch for each trip; Yik, catch of species i in gear k;
TL is the trophic level of species i for m fish species in the catch.
One-way ANOVA was used to test for differences in each indicator (mean length, trophic level, length at maturity, optimum length, megaspawners and diversity and species number) between main gears and across the different gears sizes for the static gears (gill net, trammel net and longlines) based on data for each fishing trip. When overall significance was found, pair-wise comparisons were computed using the Tukey honest significant differences test to determine which gears were different (QUINN and KEOUGH, 2002). For trawls (crustacean trawl and fish trawl), a t-test was used to test for gear specific indicator relationships. Diversity and number of species of the fish catches and whole catch were also compared with t-test for the main gear types.
2.4.4 Multivariate analysis
Multivariate analysis was performed in order to classify the different gear sizes in groups of similar métiers in terms of catch profile. The classification of the catches by gear and gear size allows identifying groups based on their species abundance composition and the respective indicators. Multivariate analyses were used to delineate gear differences in the structures of the catches and to detect patterns in the data that could not be found by analysing each variable (species) separately (QUINN and KEOUGH, 2002). The data consisted of the relative abundance of each fish species averaged for each gear size. Analyses were based on species-frequency data only, because information on weight was only available for some fishing trips. Relative abundances of the fish species observed are initially subject to severe transformation (square root) to ensure that the multivariate analysis also reflects patterns of variation in the less abundant taxa rather than being dominated by the most common species (FIELD et al., 1982).
Multidimensional scaling and clustering
To represent all pairwise dissimilarities between gears, multidimensional scaling (MDS) based on the Bray-Curtis (BRAY and CURTIS, 1957) dissimilarity matrix was used. The inter-relationships among individual catches were displayed graphically in two-dimensional ordination plots. Samples that grouped together in the ordination were most similar and the stress coefficient indicated the goodness of fit of the data (FIELD et al., 1982). A ‘stress coefficient’ less than 0.1 indicates that the configuration of objects is reliable (QUINN and KEOUGH, 2002; GRAY and KENNELLY, 2003).
Cluster analysis, classified by a hierarchical agglomerative cluster with the group average linkage method, based also on Bray-Curtis dissimilarities matrix of the same data was used to obtain a dendrogram that rearranged the groups inside the main gear types according to the
dissimilarity. Clustering has the disadvantage of once a group is formed from two or more objects, that group cannot be broken later in the process. The combination of clustering and ordination analyses was used to check the adequacy and mutual consistency of the obtained groups. If there are very dissimilar groups, then the different methods of how the dissimilarities between clusters and between clusters and objects are recalculated (linkage methods) will produce similar dendrograms (QUINN and KEOUGH, 2002). This approach was useful for providing insight into differences in gear/gear sizes and to distinguish different métiers based only on the fish catch.
Principal component analysis (PCA)
Due to the large amount of compiled data, it was necessary to obtain a geometrical representation of individuals, variables and relationships between them, thus providing a reduced description of the large data set which is helpful in exploring the structure of the data set and is easier to interpret than the initial data table (PELLETIER and FERRARIS, 2000).
Principal component analysis (PCA) is a useful tool to describe a fishery, since it provides information about the relative importance of species in the catch composition, as well as about the variance explained by the single components obtained (GARCÍA-RODRIGUEZ et
al., 2006) and can serve as a vetting tool to help identify redundant indicators (METHRATTA
and LINK, 2006).
The reduction in the complexity of the original data set is by transforming data in principal components, thus standardising the linear combinations of the original variables, which further reflects the influence of the original variables in each component. The components are extracted so that the first explains the maximum amount of the variance, the second explains the main part of the remaining unexplained variance by the first and so on, maximising the variance (inertia) of the projections of the cases on each axis. PCA allows the reduction of the dimensions of the data table by retaining only the axes that explain up to a
given part of the inertia of the data set (sum of the eigenvalues). The axes are ordered according to decreasing contribution to the inertia of the data set. This eliminates marginal effects that might blur the structure of interest in the data set (PELLETIER and FERRARIS, 2000). In addition, their graphic representation lets one determine which variables are better explained by each component, easily identifying the more discriminant variables (GARCÍA-RODRIGUEZ et
al., 2006). After averaging all trips for each gear size, PCA was applied on two matrices. One
consisted of the transformed (square root) fish relative abundance as variables. In the second matrix the variables were the indicators (not normalized) applied exclusively to the fish catch. The chosen association matrix was the correlation matrix, which is based on variables standardized to zero mean and unit variance and is necessary when the differences between variances are to be ignored (QUINN and KEOUGH, 2002). PCA was used to separate indicators in multivariate ordination space relative to one another in terms of explanatory power and to examine indicator redundancies.
One-way analysis of similarity (ANOSIM) was performed on the square root of fish relative abundance data to test for differences in the structure of fish catches by each main fishing gear.
2.4.5 The ecological indicators at the species level
The knowledge of biological characteristics of the species that dominate the different catches and that drive the fishery dynamics (i.e. high commercial value) and how the different gears affect these species must also be considered for management purposes (AGNEW et al., 2000; FRÉDOU et al., 2006). The contribution of several species was analysed and for those with higher values of abundance a graph was plotted with the indicators of mature fish, optimum size fish, megaspawners and the minimum legal size when established (LEITE, 2005).
3. Results
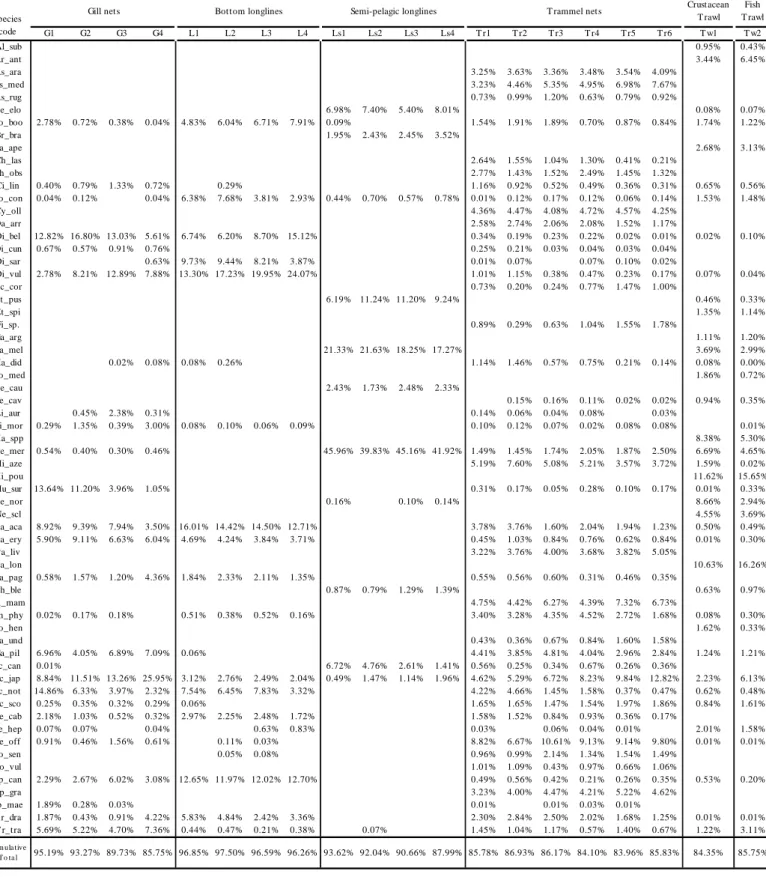
The species that represented more than 1% of the total catch by number, in at least one gear category in this study, comprised a total of 47 fish species representing 27 families, 2 cephalopods, 5 crustaceans, 2 gastropods, 5 echinoderms, 1 ascidia and 1 polychaeta (Table 3.1). The final data set contained 779 cases (fishing trips of each gear size) with the 63 representative species as variables.
Despite the large number of species caught, the catches were dominated by only a few species in some of the fishing experiments. Four most abundant species accounted about 80% of the total catch from the semi-pelagic longline fishery; for the bottom longline the eight most dominant species contributed 80% while for gill net this number of species contributed 70% of the catch. For both trawls the contribution of the most abundant eight species decreases even more, to about 60% of the total catch. Only for the trammel net fishery is the small contribution of each species noticeable (15 species accounted for about 70% of the catch, with a considerable contribution of gastropods, ascidia, echinoderms and the cephalopod Sepia
officinalis being one of the most abundant species caught by this gear).
Percentages of the commonest fish species differed among the various gears studied (Figure 3.1 to Figure 3.5). For instance, Scomber japonicus was most common in the gill net fishery with values around 10% of the total catch for the smaller mesh sizes and more than 25% for the largest one, while for the trammel net the values ranged from 4% to 12% with the largest mesh combination capturing a higher proportion of S. japonicus. For the fish trawl it was about 6% and for the bottom and semi-pelagic longline fisheries and for the crustacean trawl this species accounted for less than 3%. The red mullet Mullus surmuletus is a species that was caught almost exclusively with the smaller meshes of gill net (11%-13%). Spondyliosoma
cantharus accounted for between 2%-6% of the gill net catches, 12% of the bottom longline
Table 3.1 Relative abundance and cumulative abundance of the most important species. For description of species designations see Table 3.3.
G1 G2 G3 G4 L1 L2 L3 L4 Ls1 Ls2 Ls3 Ls4 T r1 T r2 T r3 T r4 T r5 T r6 T w1 T w2 Al_sub 0.95% 0.43% Ar_ant 3.44% 6.45% As_ara 3.25% 3.63% 3.36% 3.48% 3.54% 4.09% As_med 3.23% 4.46% 5.35% 4.95% 6.98% 7.67% As_rug 0.73% 0.99% 1.20% 0.63% 0.79% 0.92% Be_elo 6.98% 7.40% 5.40% 8.01% 0.08% 0.07% Bo_boo 2.78% 0.72% 0.38% 0.04% 4.83% 6.04% 6.71% 7.91% 0.09% 1.54% 1.91% 1.89% 0.70% 0.87% 0.84% 1.74% 1.22% Br_bra 1.95% 2.43% 2.45% 3.52% Ca_ape 2.68% 3.13% Ch_las 2.64% 1.55% 1.04% 1.30% 0.41% 0.21% Ch_obs 2.77% 1.43% 1.52% 2.49% 1.45% 1.32% Ci_lin 0.40% 0.79% 1.33% 0.72% 0.29% 1.16% 0.92% 0.52% 0.49% 0.36% 0.31% 0.65% 0.56% Co_con 0.04% 0.12% 0.04% 6.38% 7.68% 3.81% 2.93% 0.44% 0.70% 0.57% 0.78% 0.01% 0.12% 0.17% 0.12% 0.06% 0.14% 1.53% 1.48% Cy_oll 4.36% 4.47% 4.08% 4.72% 4.57% 4.25% Da_arr 2.58% 2.74% 2.06% 2.08% 1.52% 1.17% Di_bel 12.82% 16.80% 13.03% 5.61% 6.74% 6.20% 8.70% 15.12% 0.34% 0.19% 0.23% 0.22% 0.02% 0.01% 0.02% 0.10% Di_cun 0.67% 0.57% 0.91% 0.76% 0.25% 0.21% 0.03% 0.04% 0.03% 0.04% Di_sar 0.63% 9.73% 9.44% 8.21% 3.87% 0.01% 0.07% 0.07% 0.10% 0.02% Di_vul 2.78% 8.21% 12.89% 7.88% 13.30% 17.23% 19.95% 24.07% 1.01% 1.15% 0.38% 0.47% 0.23% 0.17% 0.07% 0.04% Ec_cor 0.73% 0.20% 0.24% 0.77% 1.47% 1.00% Et _pus 6.19% 11.24% 11.20% 9.24% 0.46% 0.33% Et _spi 1.35% 1.14% Fi_sp. 0.89% 0.29% 0.63% 1.04% 1.55% 1.78% Ga_arg 1.11% 1.20% Ga_mel 21.33% 21.63% 18.25% 17.27% 3.69% 2.99% Ha_did 0.02% 0.08% 0.08% 0.26% 1.14% 1.46% 0.57% 0.75% 0.21% 0.14% 0.08% 0.00% Ho_med 1.86% 0.72% Le_cau 2.43% 1.73% 2.48% 2.33% Le_cav 0.15% 0.16% 0.11% 0.02% 0.02% 0.94% 0.35% Li_aur 0.45% 2.38% 0.31% 0.14% 0.06% 0.04% 0.08% 0.03% Li_mor 0.29% 1.35% 0.39% 3.00% 0.08% 0.10% 0.06% 0.09% 0.10% 0.12% 0.07% 0.02% 0.08% 0.08% 0.01% Ma_spp 8.38% 5.30% Me_mer 0.54% 0.40% 0.30% 0.46% 45.96% 39.83% 45.16% 41.92% 1.49% 1.45% 1.74% 2.05% 1.87% 2.50% 6.69% 4.65% Mi_aze 5.19% 7.60% 5.08% 5.21% 3.57% 3.72% 1.59% 0.02% Mi_pou 11.62% 15.65% Mu_sur 13.64% 11.20% 3.96% 1.05% 0.31% 0.17% 0.05% 0.28% 0.10% 0.17% 0.01% 0.33% Ne_nor 0.16% 0.10% 0.14% 8.66% 2.94% Ne_scl 4.55% 3.69% Pa_aca 8.92% 9.39% 7.94% 3.50% 16.01% 14.42% 14.50% 12.71% 3.78% 3.76% 1.60% 2.04% 1.94% 1.23% 0.50% 0.49% Pa_ery 5.90% 9.11% 6.63% 6.04% 4.69% 4.24% 3.84% 3.71% 0.45% 1.03% 0.84% 0.76% 0.62% 0.84% 0.01% 0.30% Pa_liv 3.22% 3.76% 4.00% 3.68% 3.82% 5.05% Pa_lon 10.63% 16.26% Pa_pag 0.58% 1.57% 1.20% 4.36% 1.84% 2.33% 2.11% 1.35% 0.55% 0.56% 0.60% 0.31% 0.46% 0.35% Ph_ble 0.87% 0.79% 1.29% 1.39% 0.63% 0.97% Ph_mam 4.75% 4.42% 6.27% 4.39% 7.32% 6.73% Ph_phy 0.02% 0.17% 0.18% 0.51% 0.38% 0.52% 0.16% 3.40% 3.28% 4.35% 4.52% 2.72% 1.68% 0.08% 0.30% Po_hen 1.62% 0.33% Ra_und 0.43% 0.36% 0.67% 0.84% 1.60% 1.58% Sa_pil 6.96% 4.05% 6.89% 7.09% 0.06% 4.41% 3.85% 4.81% 4.04% 2.96% 2.84% 1.24% 1.21% Sc_can 0.01% 6.72% 4.76% 2.61% 1.41% 0.56% 0.25% 0.34% 0.67% 0.26% 0.36% Sc_jap 8.84% 11.51% 13.26% 25.95% 3.12% 2.76% 2.49% 2.04% 0.49% 1.47% 1.14% 1.96% 4.62% 5.29% 6.72% 8.23% 9.84% 12.82% 2.23% 6.13% Sc_not 14.86% 6.33% 3.97% 2.32% 7.54% 6.45% 7.83% 3.32% 4.22% 4.66% 1.45% 1.58% 0.37% 0.47% 0.62% 0.48% Sc_sco 0.25% 0.35% 0.32% 0.29% 0.06% 1.65% 1.65% 1.47% 1.54% 1.97% 1.86% 0.84% 1.61% Se_cab 2.18% 1.03% 0.52% 0.32% 2.97% 2.25% 2.48% 1.72% 1.58% 1.52% 0.84% 0.93% 0.36% 0.17% Se_hep 0.07% 0.07% 0.04% 0.63% 0.83% 0.03% 0.06% 0.04% 0.01% 2.01% 1.58% Se_off 0.91% 0.46% 1.56% 0.61% 0.11% 0.03% 8.82% 6.67% 10.61% 9.13% 9.14% 9.80% 0.01% 0.01% So_sen 0.05% 0.08% 0.96% 0.99% 2.14% 1.34% 1.54% 1.49% So_vul 1.01% 1.09% 0.43% 0.97% 0.66% 1.06% Sp_can 2.29% 2.67% 6.02% 3.08% 12.65% 11.97% 12.02% 12.70% 0.49% 0.56% 0.42% 0.21% 0.26% 0.35% 0.53% 0.20% Sp_gra 3.23% 4.00% 4.47% 4.21% 5.22% 4.62% Sp_mae 1.89% 0.28% 0.03% 0.01% 0.01% 0.03% 0.01% T r_dra 1.87% 0.43% 0.91% 4.22% 5.83% 4.84% 2.42% 3.36% 2.30% 2.84% 2.50% 2.02% 1.68% 1.25% 0.01% 0.01% T r_tra 5.69% 5.22% 4.70% 7.36% 0.44% 0.47% 0.21% 0.38% 0.07% 1.45% 1.04% 1.17% 0.57% 1.40% 0.67% 1.22% 3.11% C um ula tive To ta l 95.19% 93.27% 89.73% 85.75% 96.85% 97.50% 96.59% 96.26% 93.62% 92.04% 90.66% 87.99% 85.78% 86.93% 86.17% 84.10% 83.96% 85.83% 84.35% 85.75% GEAR Species code Crust acean T rawl Fish T rawl Gill nets Bott om longlines Semi-pelagic longlines T rammel nets
Diplodus vulgaris and D. bellottii made the highest contributions to the bottom longline
catches, with values ranging from 20% to 40%, with the smaller hook sizes catching the higher proportions. In the gill net fishery these sparids contributed 13%-25%, with the intermediate mesh sizes catching the higher proportions, but were almost completely absent in the other gear catches. Merluccius merluccius was the only species that was found in quantities higher than 40% (semi-pelagic longline catches); in both trawl catches it was present in about 5%; for the static net fisheries (trammel and gill net) the values were lower than 3% and 1%, respectively and it was not present at all in the bottom longline catches. Micromesistius poutassou made up more than 11% in crustacean and fish trawls catches, but was absent in the remaining gears.
G3 Sc_jap Di_vul Pa_aca Sa_pil Pa_ery Sp_can Tr_traSc_not Mu_sur Di_bel 0% 10% 20% 30% 40% 50% 60% 70% 80% 90% 100% 1 3 5 7 9 11 13 15 17 19 21 23 G2 Di_bel Sc_jap Mu_sur Pa_aca Pa_ery Di_vul Sc_not Tr_traSa_pil Sp_can 0% 10% 20% 30% 40% 50% 60% 70% 80% 90% 100% 1 3 5 7 9 11 13 15 17 19 21 23 25 G1 Sc_not Mu_sur Di_bel Pa_aca Sc_jap Sa_pil Pa_ery Tr_traBo_boo Di_vul 0% 10% 20% 30% 40% 50% 60% 70% 80% 90% 100% 1 3 5 7 9 11 13 15 17 19 21 23 25 G4 Di_vul Tr_tra Sa_pil Pa_ery Di_bel Pa_pagTr_dra Sp_can Sc_jap Pa_aca Li_mor 0% 10% 20% 30% 40% 50% 60% 70% 80% 90% 100% 1 3 5 7 9 11 13 15 17 19 21 23 25
cumulative percentage con
tribution
Number of species
Figure 3.1 Cumulative percentage contribution of caught species by the different mesh sizes of gill net. For description of species designations see Table 3.3. The labels of the less important species were removed for clarity.
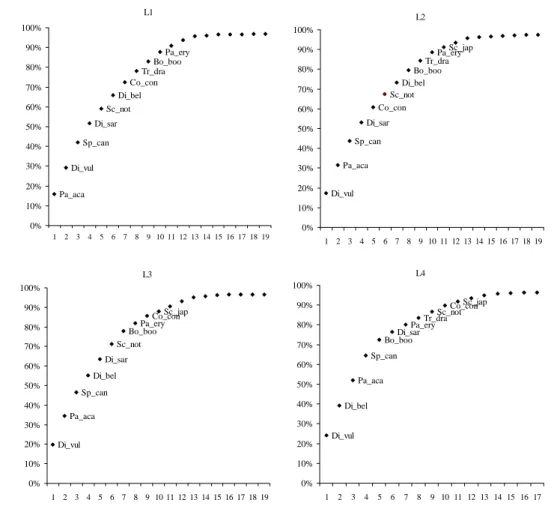
L3 Di_vul Pa_aca Sp_can Di_bel Di_sar Sc_not Bo_booPa_ery Co_conSc_jap 0% 10% 20% 30% 40% 50% 60% 70% 80% 90% 100% 1 2 3 4 5 6 7 8 9 10 11 12 13 14 15 16 17 18 19 L4 Di_vul Di_bel Pa_aca Sp_can Bo_booDi_sar Pa_eryTr_dra Sc_notCo_con Sc_jap 0% 10% 20% 30% 40% 50% 60% 70% 80% 90% 100% 1 2 3 4 5 6 7 8 9 10 11 12 13 14 15 16 17 L2 Di_vul Pa_aca Sp_can Di_sar Co_con Sc_not Di_bel Bo_boo Tr_draPa_ery Sc_jap 0% 10% 20% 30% 40% 50% 60% 70% 80% 90% 100% 1 2 3 4 5 6 7 8 9 10 11 12 13 14 15 16 17 18 19 L1 Pa_aca Di_vul Sp_can Di_sar Sc_not Di_bel Co_con Tr_dra Bo_boo Pa_ery 0% 10% 20% 30% 40% 50% 60% 70% 80% 90% 100% 1 2 3 4 5 6 7 8 9 10 11 12 13 14 15 16 17 18 19
cumulative percentage con
tribution
Number of species
Figure 3.2 Cumulative percentage contribution of caught species by the different hook sizes of bottom longline. For description of species designations see Table 3.3. The labels of the less important species were removed for clarity.
The sparids Pagellus acarne and Pagellus erythrinus are present in higher proportions in gill net and bottom longline catches with values around 9%-18% and 16%-20%, respectively. These species account for 2%-4% of the catches of trammel nets, less than 1% of trawl catches and are absent in the semi-pelagic longline catches. The sparid Diplodus sargus was also a gear exclusive species as it was taken only by bottom longline, with the larger hook sizes attracting the highest proportions (9%).
The scorpionfish Scorpaena notata, was caught by all gears with the exception of the semi-pelagic longline. Values were very distinct among gear sizes: the smallest and the largest
longline had 3% while the other hook sizes had 7%; the combination with the smallest inner mesh size of trammel nets caught 4% with around 1% for the remaining combinations and also for trawls. Ls1 Me_mer Ga_mel Be_elo Sc_can Et_pus Br_bra Le_cau 0% 10% 20% 30% 40% 50% 60% 70% 80% 90% 100% 1 2 3 4 5 6 7 8 9 10 11 12 Ls2 Me_mer Ga_mel Et_pus Be_elo Sc_canBr_braLe_cau 0% 10% 20% 30% 40% 50% 60% 70% 80% 90% 100% 1 2 3 4 5 6 7 8 9 10 11 Ls3 Me_mer Ga_mel Et_pus Be_eloSc_can Le_cauBr_braPh_ble 0% 10% 20% 30% 40% 50% 60% 70% 80% 90% 100% 1 2 3 4 5 6 7 8 9 10 11 Ls4 Me_mer Ga_mel Et_pus Be_eloBr_bra Le_cauSc_jap 0% 10% 20% 30% 40% 50% 60% 70% 80% 90% 100% 1 2 3 4 5 6 7 8 9 10 11
cumulative percentage con
tribution
Number of species
Figure 3.3 Cumulative percentage contribution of caught species by the different hook sizes of semi-pelagic longline. For description of species designations see Table 3.3. The labels of the less important species were removed for clarity.
Elasmobranchs (Galeus melastomus, Etmopterus sp. and Scyliorhinus canicula) were almost exclusively caught by semi-pelagic longline catches, accounting for between 30% and 40% of the total catch in numbers. The trammel nets also caught a small percentage, less than 1% for S. canicula, while G. melastomus and Etmopterus sp. accounted for 3% of crustacean trawl and fish trawl catches.
Tr1 Se_off Mi_aze Ph_mam Sc_jap Sa_pil Cy_ollSc_not Pa_acaPh_phy As_araSp_gra As_medPa_liv Ch_obsCh_las Da_arrTr_dra 0% 10% 20% 30% 40% 50% 60% 70% 80% 90% 100% 1 3 5 7 9 11 13 15 17 19 21 23 25 27 29 31 33 35 37 39 41 43 Tr2 Mi_aze Se_off Sc_jap Sc_not Cy_oll As_medPh_mam Sp_graSa_pil Pa_acaPa_liv As_araPh_phy Tr_draDa_arr
Bo_booSc_scoCh_las Se_cabHa_did 0% 10% 20% 30% 40% 50% 60% 70% 80% 90% 100% 1 3 5 7 9 11 13 15 17 19 21 23 25 27 29 31 33 35 37 39 41 43 Tr3 Se_off Sc_jap Ph_mam As_med Mi_aze Sa_pil Sp_gra Ph_phyCy_oll Pa_livAs_ara
Tr_draSo_senDa_arr Bo_booMe_merPa_aca
Ch_obsSc_sco 0% 10% 20% 30% 40% 50% 60% 70% 80% 90% 100% 1 3 5 7 9 11 13 15 17 19 21 23 25 27 29 31 33 35 37 39 41 43 Tr4 Se_off Sc_jap Mi_aze As_med Cy_oll Ph_phy Ph_mamSp_gra Sa_pilPa_liv As_araCh_obs Da_arrMe_mer
Pa_acaTr_draSc_not
0% 10% 20% 30% 40% 50% 60% 70% 80% 90% 100% 1 4 7 10 13 16 19 22 25 28 31 34 37 40 43 Tr5 Sc_jap Se_off Ph_mam As_med Sp_gra Cy_ollPa_liv Mi_azeAs_ara Sa_pilPh_phy
Sc_scoPa_acaMe_mer Ra_und Tr_dra 0% 10% 20% 30% 40% 50% 60% 70% 80% 90% 100% 1 3 5 7 9 11 13 15 17 19 21 23 25 27 29 31 33 35 37 39 41 43 Tr6 Sc_jap Se_off As_med Ph_mam Pa_liv Sp_gra Cy_ollAs_ara Mi_azeSa_pil
Me_merSc_scoFi_sp. Ph_phyRa_und 0% 10% 20% 30% 40% 50% 60% 70% 80% 90% 100% 1 3 5 7 9 11 13 15 17 19 21 23 25 27 29 31 33 35 37 39 41 43
cumulative percentage con
tribution
Number of species
Figure 3.4 Cumulative percentage contribution of caught species by the different mesh sizes combinations of trammel nets. For description of species designations see Table 3.3. The labels of the less important species were removed for clarity.
The cephalopod Sepia officinalis was captured mainly with trammel nets, accounting for around 9% of the catch and it accounted for 1% of the gill net catches. This species was almost
Tw1 Mi_pou Pa_lon Ne_nor Ma_spp Me_mer Ne_sclGa_mel Ar_antCa_ape
Sc_japSe_hepHo_med Bo_booPo_henMi_aze
Co_con 0% 10% 20% 30% 40% 50% 60% 70% 80% 90% 100% 1 3 5 7 9 11 13 15 17 19 21 23 25 27 29 31 33 35 37 Tw2 Pa_lon Mi_pou Ar_ant Sc_jap Ma_spp Me_merNe_scl Ca_apeTr_tra Ga_melNe_nor
Sc_scoSe_hepCo_con
0% 10% 20% 30% 40% 50% 60% 70% 80% 90% 100% 1 3 5 7 9 11 13 15 17 19 21 23 25 27 29 31 33 35 37 39 cu m u la ti v e p er ce n ta g e contributi on Number of species
Figure 3.5 Cumulative percentage contribution of caught species by the two different métiers of trawls. For description of species designations see Table 3.3. The labels of the less important species were removed for clarity.
Flatfish (Microchirus azevia, Dicologoglossa cuneata, Solea senegalensis, Solea
vulgaris) were mostly caught by trammel nets, the combinations with the smaller inner mesh
sizes caught 7-10% and the combinations with the largest inner mesh size caught less than 6%; while for gill nets and trawls, these species represent less than 2% of the total catch in numbers.
Mean length, mean trophic level, mean Shannon-Wiener diversity index and mean species richness of the main gears, are represented graphically in Figure 3.6. To calculate these indicators 47 fish species were used.
Pair wise comparisons of the differences between the various gears (Table 3.2) for the mean length of caught fish, indicate that the semi-pelagic longline caught the largest individuals and this was significantly (p<0.001) different from all the other gears, while the gill net, bottom longline and crustacean trawl caught significantly (p<0.001) smaller individuals than trammel net. Fish trawls caught a wide size range with mean length and were only significantly (p<0.001) different from that of semi-pelagic longline, gillnet and crustacean trawl.
Table 3.2 Results of the one way ANOVA and a pair wise comparisons (Tukey HSD) of each main gear types studied for (a) mean length of fish, (b) trophic level of fish, (c) diversity index Shannon-Wiener for fish, (d) number of fish species, (e) mature fish, (f) optimum length and (g) megaspawners.
Bottom longline ns Semi-pelagic longline X X Trammel net X X X Crustacean trawl ns ns X X Fish trawl X ns X ns X Bottom longline X Semi-pelagic longline X ns Trammel net X ns X Crustacean trawl X ns ns X Fish trawl X ns ns ns ns Bottom longline ns Semi-pelagic longline X X Trammel net X X X Crustacean trawl X X ns X Fish trawl X X ns X ns Bottom longline ns Semi-pelagic longline X ns Trammel net X X X Crustacean trawl ns X X ns Fish trawl ns ns X X ns Bottom longline ns Semi-pelagic longline X X Trammel net X X ns Crustacean trawl X ns X X Fish trawl ns ns X X ns Bottom longline ns Semi-pelagic longline ns ns Trammel net ns ns ns Crustacean trawl X ns ns ns Fish trawl ns ns ns ns ns Bottom longline ns Semi-pelagic longline ns ns Trammel net ns ns ns
d) Number of fish species, one-way ANOVA F= 26.38, P<0.001
e) Mature fish, one-way ANOVA F=38.92, P<0.001
f) Optimum length fish, one-way ANOVA F=4.05, P<0.001
g) Megaspawners, one-way ANOVA F=2.74, P<0.01
c) Diversity index (H') for fish, one-way ANOVA F=35.43, P<0.001 a) Mean length of catch (cm), one-way ANOVA F= 98.96, P<0.001
b) Trophic level of fish, one-way ANOVA F= 22.12, P<0.001
Gill net Bottom longline Semi-pelagic
The mean trophic levels of the gill net catches was significantly (p<0.001) lower than all the other gears. Each of the other gears had higher trophic levels due to the presence of more predators in their catches. Trammel nets had significantly (p<0.001) lower trophic levels than crustacean trawl and semi-pelagic longlines.
Figure 3.6 Boxplots of mean length, mean trophic level, mean Shannon-Wiener diversity index and mean number of species of fish caught by each of the six main gear types. Bars are standard deviations. Table 3.2 presents the statistical analysis of the gear comparisons. (G: gill net; L: bottom longline; Ls: semi-pelagic longline; Tr: trammel net; Tw1: crustacean trawl; Tw2: fish trawl).
Trammel nets caught the highest number of fish species and were significantly (p<0.001) different from the other gears with the exception of crustacean trawls. The semi-pelagic longline caught significantly (p<0.001) fewer fish species than the other gears with the exception of the bottom longline. The semi-pelagic longline and both trawls had a significantly (p<0.001) lower diversity of fish in the catch than the other gears, but were not different
between themselves. Trammel nets had a significantly (p<0.001) higher fish diversity index than all other gears. Between all main gear types, the contribution of the non fish species was not significant with the exception of the trammel net (t=-13.04; p<0.001).
Figure 3.7 Boxplots of percentage of Mature fish, Optimum length fish and Megaspawners by each of the six main gear types. Bars are standard deviations. Table 3.2 presents the statistical analysis of the gear comparisons. (G: gill net; L: bottom longline; Ls: semi-pelagic longline; Tr: trammel net; Tw1: crustacean trawl; Tw2: fish trawl).
The comparison of the indicators Mature, Optimum size and Megaspawners (Figure 3.7) shows that trammel nets and semi-pelagic catches had significantly (p<0.001) higher relative abundances of mature fish in the catch than all other gears, but were not different between themselves. Gill net catches had significantly higher relative abundances of mature and optimum sized fish than crustacean trawl catches. There were no significant differences in the megaspawners relative abundance between all gears.
The results of one way analysis of variance comparing fish catch indicators across the different gear sizes indicates that the mean length of fish caught differed significantly within some gear types (Figure 3.8). The gill net with the smallest mesh sizes (G1, G2) had significantly lower mean length of fish caught than the largest mesh size (G4) (F=22.5;
p<0.001). The same occurred with the bottom longline where the larger hook sizes (L1, L2)
attracted significantly larger fish than the smallest hook size (L4) (F=11.05; p<0.001). For the semi-pelagic longline there were no significant relationships between the mean length of caught
differences between the mean length of fish caught with different inner panel mesh sizes as the smaller inner mesh combinations (Tr1, Tr2) caught significantly smaller fish (F=26.98;
p<0.001) than the other mesh combinations. No significant relationships were found within
each gear type for trophic level (p>0.001).
G1 G2 G3 G4 L1 L2 L3 L4 Ls1 Ls2 Ls3 Ls4 Tr1 Tr2 Tr3 Tr4 Tr5 Tr6 Tw1 Tw2 G1 G2 G3 G4 L1 L2 L3 L4 Ls1 Ls2 Ls3 Ls4 Tr1 Tr2 Tr3 Tr4 Tr5 Tr6 Tw1 Tw2
G1 G2 G3 G4 L1 L2 L3 L4 Ls1 Ls2 Ls3 Ls4 Tr1 Tr2 Tr3 Tr4 Tr5 Tr6 Tw1 Tw2 G1 G2 G3 G4 L1 L2 L3 L4 Ls1 Ls2 Ls3 Ls4 Tr1 Tr2 Tr3 Tr4 Tr5 Tr6 Tw1 Tw2
Figure 3.8 Boxplots of mean length, mean trophic level, mean Shannon-Wiener diversity index and mean number of species of fish caught by each size of the six gear types. Bars are standard deviations. (G: gill net; L: bottom longline; Ls: semi-pelagic longline; Tr: trammel net; Tw1: crustacean trawl; Tw2: fish trawl; for description of gear sizes see Table 2.1).
The diversity index was significantly greater (F=8.2; p<0.001) in smaller mesh sizes of gill net (G1, G2) and significantly more species (F=10.4; p<0.001) were caught with these. A significantly greater (F=11.01; p<0.001) number of species were captured with the smaller trammel net inner mesh size combination (Tr1, Tr2) than with the larger ones (Tr5, Tr6). For the diversity index these mesh combinations (Tr1, Tr2) were also significantly different (F=5.15; p<0.001) from the larger mesh combination (Tr6).
0% 10% 20% 30% 40% 50% 60% 70% 80% 90% 100% G1 G2 G3 G4 L1 L2 L3 L4 Ls1 Ls2 Ls3 Ls4 Tr1 Tr2 Tr3 Tr4 Tr5 Tr6 Tw1 Tw2 Gear size F is h r ela tiv e ab u n d an ce M ega >Lop t, <M ega >Lmat, <Lopt <Lmat
Figure 3.9 Relative abundance of immature, mature, optimum length and megaspawners for each gear size (G: gill net; L: bottom longline; Ls: semi-pelagic longline; Tr: trammel net; Tw1: crustacean trawl; Tw2: fish trawl; for description of gear sizes see Table 2.1).
A significant difference between gear sizes for the relative abundance of mature fish, optimum length fish and megaspawners in the catches (Figure 3.9) was found only for gill nets. The largest mesh size (G4) had significantly (F=7.10; p<0.001) lower relative abundance of mature and optimum length fish in the catch. Megaspawners relative abundance was only significantly different (F=7.01; p<0.001) between the two larger mesh sizes, the largest mesh size (G4) caught fewer megaspawners than a smaller mesh size (G3).