Disponível em:
http://editora.unoesc.edu.br/index.php/race Race, Joaçaba, v. 15, n. 3, p. 1065-1086, set./dez. 2016
EMPIRICAL ANALYSIS OF THE PERFORMANCE, RISK
AND CONDITIONAL CORRELATION OF THE BRAZILIAN’S
SECTORIAL INDEXES
Análise empírica do desempenho, risco e correlação condicional de índices setoriais do Brasil
Cássio Nóbrega Besarria E-mail: [email protected] PhD in Economics from Universidade Federal de Pernambuco; Master in Economics
from Universidade Federal da Paraíba; Professor of the Economics Course in Uni-versidade Federal da Paraíba. Contact address: Cidade Universitária, 58051-900, João Pessoa, Paraíba, Brasil.
Wellington Charles Lacerda Nóbrega E-mail: [email protected] Master and doctoral student in Economics from Universidade Federal da Paraíba.
Breno Silva Araújo E-mail: [email protected] Graduated in Economics from Universidade Federal de Pernambuco. José Neto Alves E-mail: [email protected] Graduated in Economics from Universidade Federal de Pernambuco. Fenelon Francisco Almeida E-mail: [email protected] Graduated in Economics from Universidade Federal de Pernambuco. Valdeir Soares Monteiro E-mail: [email protected] Graduated in Economics from Universidade Federal de Pernambuco. Ângelo Antonio Paula E-mail: [email protected] Graduated in Economics from Universidade Federal de Pernambuco. Artigo recebido em 07 de maio de 2016. Aceito em 31 de julho de 2016.
Abstract
This paper aims to analyze both the volatility patterns and performance of the sectorial indexes of Bovespa’s main stocks and to investigate the temporal structure of the conditional correlation between these, from January 04, 2011 to November 19, 2013. The results obtained from the conditional CAPM have showed that the betas significantly vary over time and revealed an existing heterogeneity among portfolios. Regarding to volatility analysis, it perceives that volatility series of both UTIL and IEE indexes presented similar behavior and were more volatile than other indexes in the review period. The conditional correlation analysis showed that IEE and UTIL, INDX and UTIL, ICON and IMAT, IMOB and IFNC have presented a strong correlation; the construction of a portfolio of assets composed by shares of these indexes does not allow the risk diversification. Keywords: Sectorial analysis. Risk. Conditional Correlation.
Resumo
O objetivo deste estudo é analisar o desempenho e os padrões de volatilidade dos índices setoriais das principais ações da Bovespa e investigar a estrutura temporal da correlação condicional entre esses, no período de 04 de janeiro de 2011 a 19 de novembro de 2013. Os resultados obtidos a partir do CAPM condicional mostraram que os betas variam significativamente ao longo do tempo e revelaram a heterogeneidade existente entre as carteiras. Em relação à análise de volatilidade, percebe-se as séries da volatilidade dos índices UTIL e IEE apresentaram comportamento semelhante e se mostraram mais voláteis que os demais índices no período analisado. Já a análise da correlação condicional mostrou que os índices IEE e UTIL, INDX e UTIL, ICON e IMAT, IMOB e IFNC apresentaram uma forte correlação e a construção de uma carteira de ativos composta por ações desses índices não permite a diversificação do risco. Palavras-chave: Análise setorial. Risco. Correlação condicional.
1 INTRODUCTION
The attempt to comprehend both market’s behavior and investor’s way of acting has promoted several changes in Financial Theory. One of the theoretical land-marks is represented by the portfolio theory proposed by Markowitz (1952), which presents the importance of portfolio diversification based in assets correlation. In his discussion, Markowitz (1952) shows that, through optimization process, it could be possible to determine a portfolio (proportion in which should be applied to each asset) to a specific investor according to his level of risk tolerance.
Based on that, a series of studies has emerged in order to analyze the corre-lation influence over both assets and assets group, mainly in correcorre-lation among stock markets from different regions, styles or sectors.
Given the importance of risk over decision making and of factors that compo-se it, the precompo-sent study has two main purpocompo-ses: to analyze the performance and to cha-racterize the volatility patterns of the sectorial indexes of Bovespa’s main assets; and to investigate the temporal structure of conditional correlation among them, over the period from January 04, 2011 to November 19, 2013. The sectorial indexes analysis relevance is justified by the fact that these represent Bovespa’s main assets and allows to characterize its behavior by business sector.
Furthermore, as described by Borges (2012), the importance of sectorial analy-sis is connected to top-down investment approach. This is because in such strategy the investor’s choice is made from macro to microeconomic plan, such that the sectors that offer the best perspectives are identified and, after, the most relevant sectorial assets.
Unlike previous discussions presented by authors such as Sobreira and Prates (2004), Jubert et al. (2009), Medeiros (2012) and Ceretta, Righi and Silveira (2012) to Brazilian sectorial indexes, the present research aims to give an empirical contribution for the scientific literature, presenting stylized facts that help the understanding of the volatility behavior and interdependence of these indexes.
The first part of this study is represented by the individual analysis and is charac-terized by the traditional discussion of sectorial indexes proprieties. It will be presented the estimates of statistical and conditional betas, both Sharpe and Treynor indexes, and the sectorial volatility estimates. In the second part, the conditional correlation analysis will be performed, with the intention of investigate the association degree between sectorial indexes, in other words, to verify how the performance of sectorial cycle from a given index affects the behavior of others.
This analysis is useful for indicating the way how fluctuations in certain portfolio or asset affects the frequency and intensity of oscillations of others portfolios or stocks. The higher the association degree among portfolios, higher is the probability of an asset to present similar results (both positive and negative) therefore the risk of setting up a portfo-lio with stocks that present this behavior increases.
It is noteworthy that, for modeling the Brazilian sector indexes through the conditional correlation only the study proposed by Righi and Ceretta (2012) was fou-nd at the current stage of this research. It analyzes the differences between financial and consumption indexes through dynamic conditional correlation model. These au-thors have shown that financial sector volatility was twice bigger then consumption sector and both sectors presented volatility peaks during 2007-2008, apex of Subpri-me crisis. Finally, they have described that dynamic conditional correlation among estimated volatilities remained around 0.7, showing that dependence among sectors does not suffered any sudden change in the analyzed period.
Generally, the conditional correlation modeling directed researches of Brazi-lian sectorial indexes are limited. Among the studies that have used this methodology, stands out the work proposed by Morais and Portugal (2001), where the quase-maximun likelihood method was applied to estimate the non-stationary stochastic multivariate volatility of par bonds purchases prices of four Latin-American countries – Mexico, Brazil, Argentina and Venezuela – in the period from August 1994 to September 1999.
The purpose of that study was to analyze possible common movements in these variances. The tests made revealed that univariate models of volatility do not present inclination, but have high persistence. The multivariate formulation relates well to the data, getting consistent estimates and revealing the existence of a similar over time behavior among the volatilities of the four series.
In relation to international literature, worth highlighting the research deve-loped by Manera (2003), which investigates financial interactions between Pacific Basin Region countries (Korea, Singapore, Maylasia and Hong Kong) and USA and Japan. From this investigation, Manera (2003) concludes that before 1990s Japan held leadership over Pacific Basin Region countries and that after the Japanese crisis USA obtained financial leadership over these countries.
Baur and Jung (2006) investigated the contemporaneous correlation and the spi-llover effects between USA and Germany’s stock markets, based in diary data to Dow Jo-nes Industrial Average Index (DOW) and Deutsche Aktienindex (DAX). They found that daytime foreign return may significantly influence domestic returns during the night, this is true for both to USA and Germany’s markets. Also it was possible to show that there is no spillover evidence of previous daytime returns of USA to daytime negotiation of DAX. Lastly, Cao, Long and Yang (2013) evaluated correlations between China’s stock prices and sectorial indexes from 2007 to 2008. The analysis of the stock marke-ts sectorial indexes relations was described through DCC-MVGARCH model. Empi-rically, it was observed that financial, industrial and energy sectors have a high degree of correlation when market presents rises and falls in prices.
Besides this introduction, this paper is divided in other five sections. Section 2 approaches sectorial analysis studies. In section 3 the methodological procedures are described, namely: conditional CAPM, conditional correlation and presentation of data selection criteria. Section 4 is dedicated to result analysis and discussion of sta-tistical tests, being presented the estimates obtained to betas, volatility and dynamic conditional correlation. Section 5 presents concluding remarks, section 6 is destined to bibliographic references and, lastly, it is presented the statistical appendices.
2 APPLIED STUDIES TO THE BRAZILIAN’S SECTORIAL INDEXES This section will present studies that sought analyze the sectorial indexes beha-vior of Brazilian economy in general, whether in relation to performance analysis or risk modeling. Among these studies, stands out the research developed by Sobreira and Prates (2004). These authors questioned the efficiency of indexes proposed by Bovespa in the decision making. From this discussion, Sobreira and Prates (2004) created an alternative index to the IEE and the gap to be filled up by this study was based in the fact that the Bovepa’s proposed index only considers one kind of enterprise bonds, giving equal weight to relative participation of each bonds in the period beginning, being this interval quarterly. Based on Portfolio Theory proposed by Markowitz (1952), the authors crea-ted an index, considered efficient, to electric energy sector in the period that goes from 1995 to 2002. The conclusion of the study was that, through Sharpe’s Index, Treynor’s Index and Jensen’s Index, the alternative index presented better results in decision making than the one proposed by Bovespa.
Posteriorly, in larger study, Jubert et al. (2009) sought to analyze the Iboves-pa, electric energy (IEE), Public Sector (ISE), industrial sector (IDNX) and telecom-munications (ITEL) indexes volatility patterns, through ARCH, GARCH, EGARCH and TARCH models, in the period between 2006 and 2007. It was verified through asymmetric models that the index’s volatility (that is being influenced whether by a negative or positive shock) promotes a contagion effect, inducing other indexes to present variations in their volatilities.
Furthermore, the authors concluded that Ibovespa Index presented the lowest risk due to portfolio diversification, while ITEL Index exhibited the higher volatility, thus, higher risk of investment in case it was taken singly. On other hand, the electric energy index showed the higher financial leverage effects between the indexes, indi-cating that this index will show higher volatility during the effects of a negative shock. In subsequent discussion, Medeiros (2012) also sought to analyze the indexes vola-tility of Electric Energy, Telecommunication, Industrial and Financial sectors. The results ob-tained through ARCH-GARCH models and its extensions TGARCH and PGARCH, to the period of January 2005 to September 2001, showed that these indexes presented volatility per-sistence, besides the leverage effect. The study also shows that portfolio diversification tends to reduce volatility, although it demonstrates that it will take a more detailed research on this issue.
In the same line of discussion so far presented studies, Ceretta, Righi and Silveira (2012) sought to verify which sectors in Brazil have best performance in Stock Exchange (Bovespa), through the most common indexes, like Sharpe’s Index, Sortino’s Index,
Trey-nor’s Index, among others. The conclusion was that electric sector presents higher benefits to investors in portfolio’s making. This index showed, to the analyzed period, higher average returns than market’s portfolio, Ibovesta, and lower risks when compared to other sectors as telecommunication, industrial (even showing lower risk to the analyzed period) and others.
Godeiro (2012) has tested a CAPM model for Brazilian stock market using a MGAR-CH model. The sample was composed by 28 stocks included in Ibovesta portfolio from Jan. 01, 1995 to Mar. 20, 2012. Thus, dynamic betas were estimated and the main finding is that the conditional betas have higher explanatory power of excess returns. Also, the results show a significant rise in estimated betas during troubled periods, indicating growth of the risk.
In discussion which approaches the purposes of this study, Ferreira and Mattos (2014) sought to analyze the contagion effects of international financial crisis over indexes of Brazil’s stock market, from the pattern of estimated covariance study between Brazilian and American stock market indexes. The empirical analysis was based in multivariate GARCH-BEKK models. The results showed that the estimated covariance structures, between the years of 2007 and 2010, clearly have indicated evidences of contagions on the considered indexes. In international finan-cial crisis period, there was a covariance increase among Brazilian and North-American indexes. The Real State and Financial indicators presented the highest contagions between all analyzed, reflecting the losses of construction industry, along with the lack of internal and external credit.
Lastly, Accioly and Mendes (2016) investigated if the “realized range” provi-des additional information to both GARCH and EGARCH models, from period of Dez. 01, 2009 to Mar. 23, 2012. They used four definitions of realized range, and those metri-cs were used as exogenous variables in conditional variance equation. The results show that the realized range is quite effective to explain part of EGARCH’s conditional vola-tility; this modelling strategy reduces persistence, thus increasing forecasting accuracy. As can be seen, studies focused to sectorial analysis in Brazil are largely focused for the discussion over the performance and risk or volatility modeling. Based on this, the present study passes to incorporate a fact that still is underexplored in Brazilian national scientific literature that is the analysis of conditional correlation between indexes.
3 METHODOLOGICAL PROCEDURES 3.1 RISK AND RETURNS ESTIMATES
Initially, it will be executed an estimate of a static CAPM and this analysis is linked to the evaluation of decision making process under risk conditions. From the development of CAPM will be calculated the measures of portfolio performance proposed by Sharpe and Treynor.
Board 1 – Description of Market’s beta, Sharpe’s and Treynor indexes
Beta Sharpe’s Index Treynor’s Index
Rset = Rcd i+ βset (Rp - Rcdi ) Sset = Rset - Rcdi σR
set
Tset = Rset - Rcdi βset Source: the authors.
Where Rset is the excess of returns sectorial index; Rcdi is the free-risk asset’s return; Rp is the excess of return of the market portfolio; βset is the beta of the sectorial index; σR
set is the standard deviation of the sector’s return excess; Sset is the sector’s Sharpe Index; Tset is the Treynor Index of Sectorial Index.
In sequence it will be performed a time-varying sectorial portfolio risk modeling, through a conditional CAPM, a generalization of Sharpe’s CAPM (1964), Lintnet (1965, 1969) and Mossion (1966). Being adopted the version of conditional CAPM model proposed by Bollerslev, Engle and Wooldridge (1988), as in Bonomo and Garci (2002), Bergmann et al. (2014) and Besarria et al. (2015). In general, the conditional CAPM can be expressed by:
μt = βtμM
t (1) Where μt represents a vector of excess returns of the sector; βt is the assets’ beta, defined as the ratio between the covariance of the asset with the market and the variance of market portfolio; μM
t is the excess returns of the market.
Equation (1) represents the CAPM model in terms of the conditional momen-ts and it reflecmomen-ts the information available to agenmomen-ts when deciding on the formation of the portfolio. Since this is a recent discussion to Brazil’s economy, it will be given higher focus to the conditional correlation analysis, described in section 3.2.
3.2 CONDITIONAL CORRELATION ANALYSIS
In the last decades a series of multivariate temporal series models has been proposed to capture the dynamic properties in the co-movements of financial retur-ns volatility. The first GARCH model utilized to model the conditional covariance matrices was called VEC model of Bollerslev, Engle, and Wooldridge (1988).1 This model is characterized by being hard to estimate and by presenting a large number of parameters; one of the goals of the later literature was to formulate simpler models.
Simplified versions, as the constant conditional correlation models (CCC) of Alexander (1998), Harvey et al. (1994), also were unattractive due to its problems to describe the data empirical features. Posteriorly, Engle (2002) introduced the Dynamic Conditional Correlation Model (DCC) as an alternative approach to achieve parsimony in dynamic of the conditional correlations and to keep simplicity in the estimate process.
The proposed multivariate GARCH admits that the returns of k assets are conditionally normal with zero expected value and covariance matrix Ht. The returns can present zero mean or residuals of a filtered time series.
rt | Ft-1~N(0,Ht) (2) And
Ht = DtRtDt (3)
Where Dt is a k x k diagonal matrix of time-varying standard-deviation, arising from univariate GARCH models with √hit in the ith diagonal and R
t is the time-varying correlation matrix. It proposed that elements of are described by a univariate GARCH, such as:
(4) For i = 1, 2, ..., k with usual restrictions of GARCH models, non-negativity, stationary and . It is important to point out that univariate specification of GARCH models aren’t limited to the standard GARCH (p,q) model, but could include any GARCH that presents normally distributed errors and satisfy both stationary and non--negativity conditions. The proposed structure of the dynamic correlation is:
(5) Where Q ̅ is the unconditional covariance of the unified residuals that are results of the first phase of estimates, and
So that is a diagonal matrix composed by the squared-root of diagonals ele-ments of. The eleele-ments of are represented by, where it’s definite positive and, conse-quently, a correlation matrix.
3.3 DATA DESCRIPTION
In order to measure both risk and conditional correlation associated to sectorial portfolio stock were collected data referring to closing prices of indexes of the segments that will be presen-ted subsequently. It should be nopresen-ted that to the estimate of the betas of the portfolio investment, it was necessary to obtain the financial time series returns, of risk-free asset (CDI) and the market portfolio (Ibovespa). The analysis period extends from January 04, 2011 to November 19, 2013, with daily returns being calculated in continuous basis. It was performed an adequacy of the data among series, being the analysis limited to observations common to all series.
Hereafter details will be presented, according to Bovespa, about the sectorial indexes that were adopted in this research and their respective characteristics.
Board 2 – Data base and its characterization
Sectorial Index Characterization
Bovespa Index (Ibovespa)
The most important index calculated by Bovespa, because it uses the main stocks traded in stock exchange, indicating there-fore the market behavior and the expected performance of the stock prices.
Electric Energy Index (IEE)
It has the objective to measure the perfor-mance of the electric energy sector and represents an instrument that allows to assess the performance of in this sector specialized portfolios.
Industrial Sector Index (INDX)
It was developed with the objective to mea-sure the performance of the most represen-tative stocks from industrial sector, import-ant segment of the Brazilian economy.
Real Estate Index (IMOB)
Has the purpose to measure the behavior of stocks of the representative enterprises of activity of real estate sector understood by construction, property agency and real estate exploration. The components stocks are selected by its liquidity.
Consumption Index (ICON)
It is designed to measure the behavior of the shares of representing enterprises of cyclical and non-cyclical sectors of con-sumption. The component shares are select-ed by its liquidity.
Financial Index (IFNC)
Aims to measure the behavior of the stocks of the representative sectors enterprises of financial intermediary, several financial services, pension and insurance.
Basic Materials Index (IMAT)
It features a segmented view of the stock market by measuring the performance of shares in companies representing the Basic Materials sector.
Public Utility Index (UTIL) Gauges the performance of shares of the companies representing the utilities sector
(electricity, water and sanitation and gas). Source: the authors.
To find more information about the indexes calculation, composition, portfo-lios inclusion criteria, consult the BM&FBOVESPA.
4 RESULTS
In this section a description of the Brazilian sectorial portfolios will be pre-sented and, among discussions that will be exposed, stands out: varying in time betas estimate, obtained from conditional CAPM, conditional volatility analysis and condi-tional correlation estimate. Taking as main goal the risk characterization associated to sectorial indexes and the verification of dependence degree between these.
4.1 PORTFOLIO’S PERFORMANCE EVALUATIONS
Initially, proceeds to dispersal analysis between the returns excesses of the sectorial indicators and the market’s portfolio excess of returns, shown in Figure 1. It is important to point out that the adopted description to represent the returns joint distribution addressed in this research is based on growth rate among the information set in moment ‘t’ with relation to previous events. Being the excess of return obtained from the difference between free-risk rate and the calculated return. As proposed by Capital Assets Pricing Model, the excess of return of the sectorial indexes are positi-vely correlated to the excess return of market portfolio.
Figure 1 – Relation between sectorial indexes excess of return and excess return of market portfolio
Source: the authors.
Note: The left panels represent IEE, INDX, ICON and IMOB indicators; the right panels represents IFNC, IMAT and UTIL indexes, respectively.
However, Figure 1 presents just an indicator of the relation among sectorial indexes and market portfolio, without express the magnitude of this association. The intensity of this
as-sociation is obtained from estimate of the risk-return relation between both sectorial and market portfolios, given by evaluation of the decision making under risk conditions. To proceed this analysis will be used the Capital Asset Pricing Model (CAPM) developed by Sharpe (1964), Lintner (1965, 1969) and Moossion (1966). Apart from this initial discussion will be presented both Sharpe’s and Treynor’s indexes as performance measures of the sectorial portfolios.
When analyzing statical CAPM estimates of coefficients described in Table 01, it is possible to verify that IMAT portfolio presented higher performance than market portfolio and it was featured by the fact that the return associated to their stocks are higher than market’s portfolio returns and, consequently, presents higher risk. One possible explanation to this performance is given by both the acceleration in Brazilian’s automobilist sector and rising in ore’s price in the analyzed period.
Other indicators were more conservative in relation to the market portfolio because the systematic risk associated to these was lower that the systematic risk of the market as whole. Table 1 – Estimate of the sectorial returns adjusted to portfolio risk
Portfolios Sharpe’s Index Treynor’s Index
IEE 0.44 (0.02) -0.0017 -0.0039 INDX 0.77 (0.01) 0.0167 0.0262 ICON 0.58 (0.01) 0.0434 0.0778 IMOB 0.97 (0.02) -0.0268 -0.0466 IFNC 0.82 (0.02) 0.0130 0.0220 IMAT 1.05 (0.02) -0.0033 -0.0053 UTIL 0.47 (0.02) 0.0134 0.0324
Source: the authors.
One alternative way to proceeds the performance evaluation of the portfolios is given by the indexes, also known as, Sharpe and Treynor. In relation to the intuition brought by these indicators, stands out that the higher Sharpe’s and Treynor’s indexes are, the better will be the portfolio performance. It is important to detach that Sharpe’s Index it is distinguished of Treynor’s Index for being based on portfolio’s total risk, while Treynor’s Index uses portfolio’s beta as risk measure, as described at section 3.1.
When analyzing Table 1, it is possible to verify that Sharpe’s and Treynor’s indicators showed that ICON was the sectorial index that presented best performance, on the other hand, the values obtained for the IEE, IMOB and IMAT indexes were negative. In this case, the indexes should not be used to comparisons, insofar as it makes no sense the investor to take unnecessary risk, since the free-risk asset returns is bigger than the portfolios average return.
Finally, it is intended to perform the portfolio’s performance analysis through the conditional CAPM. The purpose of this analysis is to verify how the market beta adjusts insofar as the additional information is incorporated, in other words, shows the continuous evolution of the beta. The results have shown that betas significantly vary over time and revealed the existent of heterogeneity among portfolios. Particularly, the beta of both IMOB and IMAT indexes vary from the maximum values of 1.87 and 1.92 to the minimum values of 0.14 and 0.05, respectively. Another characteristic that can be observed through this analy-sis is that both ICON and UTIL indicators presents negative values to some periods, indica-ting that the created portfolio return has changed in reverse direction to the market portfolio. Figure 2 – Conditional betas of the sectorial indexes
Source: the authors.
Note: The left panel represents the IEE, INDX, ICON and IMOB indexes; the right panel represents IFNC, IMAT an UTIL indexes, respectively.
On the other hand, it is verified that there is not expressive change in the behavior of these during the analysis, verified that there is a reversion to the mean of the conditional betas over the analyzed period. Drew attention the presented behavior by both IEE and UTIL indexes, where their betas had presented very similar behavior, including, in the tendency change, passing to be rising from 2012. Showing that these sharing same tendency and may be being affected by the same determinants as will be discussed forward.
4.3 VOLATILITY’S ESTIMATES
In this section the sectorial indexes conditional volatility estimates will be presented, being these estimates obtained from the series of return. The Figure 03 des-cribes the behavior of the return series, being possible to observe that in the described period there were volatility groups, described for the shaded area, and the existence of high volatility periods, an indicative of residual autocorrelation.
Figure 3 – Return Excess Series of Sectorial Indexes
Source: the authors.
Note: The left panel represents the IEE, INDX, ICON and IMOB indexes; the right panel represents the IFNC, IMAT and UTIL, respectively.
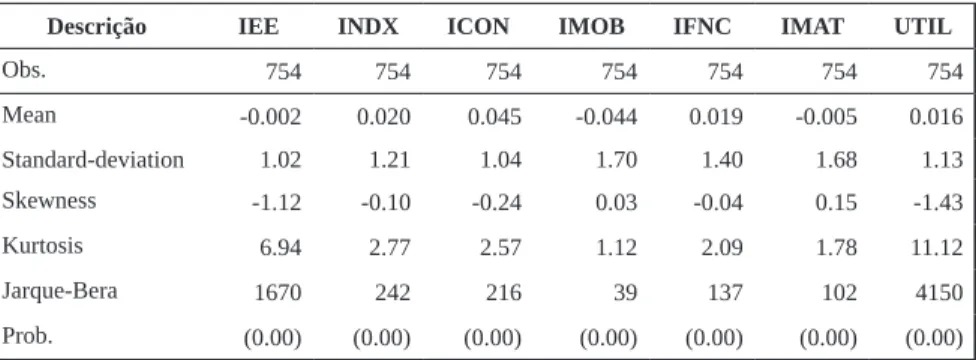
Before modeling the volatility of the series discussed so far, the average return performan-ce, dispersal measures, skewness and kurtosis were analyzed. From Table 02 it can be seen that the average daily return of ICON was higher than the average return of others. Moreover, it is clear that both IMOB and IMAT were those that presented higher volatility during the review period. Table 2 – Descriptive Statistics of Sectorial Indices Return Series
Descrição IEE INDX ICON IMOB IFNC IMAT UTIL
Obs. 754 754 754 754 754 754 754 Mean -0.002 0.020 0.045 -0.044 0.019 -0.005 0.016 Standard-deviation 1.02 1.21 1.04 1.70 1.40 1.68 1.13 Skewness -1.12 -0.10 -0.24 0.03 -0.04 0.15 -1.43 Kurtosis 6.94 2.77 2.57 1.12 2.09 1.78 11.12 Jarque-Bera 1670 242 216 39 137 102 4150 Prob. (0.00) (0.00) (0.00) (0.00) (0.00) (0.00) (0.00) Source: the authors.
To proceed the joint analysis of both skewness and kurtosis measures, pro-posed by Jarque-Bera test, it is possible to observe that the series do not present nor-mal distribution. These are characterized by negative asymmetric distribution (except IMOB and IMAT indexes) and kurtosis excess. Being known that these series don’t present normal distribution, a volatility model that incorporates the typical financial series in its structure must be adopted, such as heavy-tail accommodation and asym-metric distributions. This fact conducts the study of volatility or risk to estimate the conditional distribution of returns series through GARCH-M model, being adopted the AIC and SBC to model section criteria, described in appendix A.
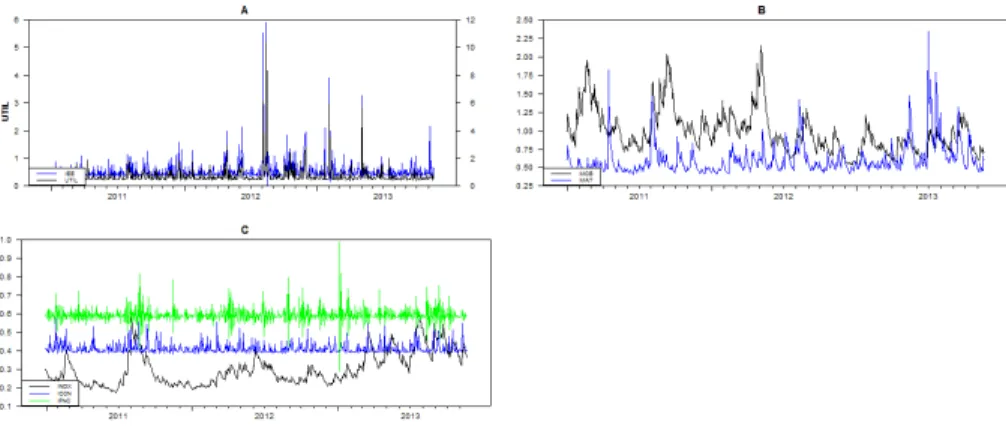
Figure 4 – Conditional volatility series of sectorial indices
Source: the authors.
Note: The panel A is composed by the IEE and UTIL indexes; B by IMOB and IMAT indexes; C by INDX, ICON and IFNC indexes.
In Figure 4 are shown the estimates of conditional volatility to each of the sectorial indexes, obtained through GARCH-M (1,1) univariate models. Generally, it is possible to observe that volatility series of UTIL and IEFF indexes presented simi-lar behavior and were more volatile than other indexes in the analyzed period.
In relation to the similar behavior, the explanation is given by the fact of the in-dexes are formed by shares of the same branch of activity and subject to the same legis-lation. The UTIL index, for example, it is composed by most representative companies of the utilities sector listed on BM&FBOVESPA (electricity, water, sanitation and gas). Thus, changes in the stock prices of the enterprises operating in electric power industry will impact the UTIL index volatility, making these present similar behaviors.
Also draws attention the IMOB and IMAT indexes behavior (panel B), it can be seen that there is strong interaction between these and that this volatility
transmis-sion is justified for the set of economic policies focused on the real estate sector in the analyzes period. Verifying that there is strong an interdependence among the sectors. This result differs from the one found by Pessoa (2013), where it was verified that the IMOB and IFNC indexes have shown more concentrated volatility groups than others in the period from September to December, 2008. The argument given to this fact was that these sectors were directly involved in Subprime financial crisis. 4.2 DYNAMIC CONDITIONAL CORRELATION ANALYSIS
O objetivo desta seção é investigar a estrutura temporal da correlação condi-cional entre os índices IEE, INDX, ICON, IMOB, IFNC, IMAT e UTIL, no período de 04 de janeiro de 2011 a 19 de novembro de 2013 e verificar se há contágio entre esses para o período analisado. Como primeiro indicador será apresentada a matriz de correlações formada a partir do coeficiente de correlação linear de Pearson.
The purpose of this section is to investigate the temporal structure of the conditional correlation between IEE, INDX, ICON, IMOB, IFNC, IMAT and UTIL indexes, from January 04, 2011 to November 19, 2013 and check if in the analyzed period there is contagions among these. As a first indicator it will be presented the correlation matrix created from Pearson’s linear correlation coefficient.
A correlation matrix shows the association degree between analyzed indexes, from this was possible conclude that the indicators have presented positive and very high correlations, mainly, the IEE and UTIL (0.93) and ICON and INDX (0.92) indexes. Table 3 – Correlation matrix - linear correlation coefficient of Pearson
IEE INDX ICON IMOB IFNC IMAT UTIL
IEE 1 INDX 0.54 1 ICON 0.53 0.92 1 IMOB 0.48 0.78 0.72 1 IFNC 0.52 0.77 0.71 0.67 1 IMAT 0.49 0.87 0.68 0.63 0.70 1 UTIL 0.93 0.52 0.51 0.44 0.51 0.46 1
Source: the authors.
A strong association between IEE and UTIL indexes, as described before, may be explained by the fact that the UTIL Index to be composed by electric energy
sector enterprises, causing that performance changes in electric energy sector have strong effects in the stock returns of the public utilities companies. In previous analy-sis made by Jubert et al. (2008) it was found that the higher correlation among sec-torial indexes was between IEE and INDX indexes. This result shows that secsec-torial correlation may be changed according to the temporal cut and this kind of analysis can’t be captured from the linear correlation coefficient of Pearson.
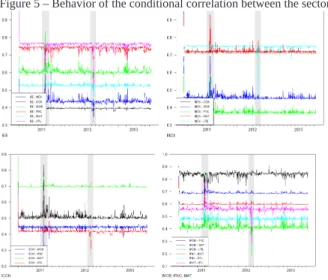
In order to present the main features found by conditional correlation among daily returns rates of sectorial indexes, will be presented the dynamic trajectories of the conditional correlations in the Figure 5. Through this analysis it is possible to segmental some discus-sions that are suppressed by the discussion proposed by Pearson correlation coefficient.
When analyzed the superior left panel of Figure 5 it is possible to describe the conditional correlation behavior between IEE and other indexes. As can be seen, the cor-relation level among IEE and both UTIL and IMOB indexes showed quite strong to the analysis period. In general, this was an expected result, insofar as the period under review was characterized by government incentive policies to companies operating within econo-mic branch represented by these indexes. Among the policies, stands out the program Mi-nha Casa MiMi-nha Vida (My Home My Life) and the infrastructure investments focused on hosting both Fifa World Cup 2014 and the Olympic Games 2016. On the other hand, the other sectors shared low correlation with the IEE Index, giving emphasis to INDX Index. Figure 5 – Behavior of the conditional correlation between the sectorial indexes
Source: the authors.
Note: The left panel represents the correlations of the IEE (higher) and ICON (below) indexes with other indicators; the right panel represents the correlations of the INDX and IMOB (higher), IFNC and IMAT (below) indexes with other indicators.
The upper right panel shows the interaction between the conditional corre-lation of IDNX and movements in other indexes. As it can be seen, the conditional correlation between these exhibited different behaviors to the analyzed period. It is interesting to detach the fact that the correlation among INDX and ICON, IMOB and UTIL indexes are very similar and that the possibility of building a portfolio of assets from these indicators can promote no risk diversification. This result is also valid to the analysis between IMOB and IFNC, IMOB and IMAT, ICON and IMAT indexes, as can be observed.
Another fact that Drew attention in this analysis was that the correlation pa-ttern seems to have changed along the years from 2011 and 2012, period characteri-zed by instability in the international financial markets. The analysis of correlation between sectorial indexes in this period has indicated, for example, that the volatility rising in the INDX index was accompanied of conditional covariance increase and consequently of the conditional correlation of the IMAT and IMOB indexes; the cor-relation among these situated very close to one unity in the review period.
The reverse movement also was verified, mainly, among the indexes asso-ciated to IEE, having as central feature the low association between these indicators. With that, it is concluded that the construction of a portfolio of assets composed by stocks or indexes that possess strong correlation do not allow risk diversification, This fact is verified through conditional correlation among IEE and UTIL, INDX and UTIL, ICON and IMAT, IMOB and IFNC indexes.
5 CONCLUDING REMARKS
Taking into account the importance of risk in decision making and of the factors that compose it, this study sought to analyze the performance and to character-ize the volatility patterns of sectorial indexes of the main stocks of the Bovespa; and investigated the temporal structure of the conditional correlation among these, in the period from January 04, 2011 to November 19 2013.
The performance analysis, performed by both Sharpe’s and Treynor’s indexes showed that ICON was the sectorial index that presented best performance. In relation to the analysis developed from conditional CAPM, it was possible to verify that as the additional information is incorporated, the beta vary significantly and reveal an existent heterogene-ity among portfolios. Particularly, the betas of the IMOB and IMAT indexes vary between maximum values from 1.87 and 1.92 to minimum values from 0.14 and 0.05, respectively.
Lastly, the conditional correlation analysis showed that IEE and UTIL, INDX and UTIL, ICON and IMAT, IMOB and IFNC indexes have presented a strong correla-tion and the intuicorrela-tion that can be taken of this analysis is that the construccorrela-tion of a portfo-lio of assets composed by shares of these indexes does not allow the risk diversification.
Note that this article generates indicators of how the volatility indices behave and interact. However, the investment decision-making should take into consideration, in addition to these factors, the individual characteristics of the shares of each sector, component not observed in this study, but that will be addressed in future studies. Notas explicativas:
1 See Engle, Granger, and Kraft (1984) to an ARCH version. 2 See Engle and Sheppard (2001).
REFERENCES
ACCIOLY, V. B.; MENDES, B. V. M. Avaliação do Impacto do Realized Range sobre a Volatilidade (E)GARCH: Evidência do Brasil. Brazilian Business Review, v. 13, i. 2, p. 1-26, 2016.
ALEXANDER, C. Market Risk Analysis, Value at Risk Models. John Wiley & Sons, 2009. v. 4.
BAUR, D.; JUNG, R. Return and Volatility Linkages Between the US and the German Stock Market. Journal of International Money and Finance, v. 25, p. 598-613, 2006. BESARRIA, C. N. et al.. A qualidade das informações prestadas pelas empresas reduz os riscos de investimento? uma análise empírica para os diferentes níveis de governança corporativa das empresas brasileiras. RACE, Revista de Adminis-tração, Contabilidade e Economia, v. 14, i. 1, p. 11-38, 2015.
BOLLERSLEV, T.; ENGLE, R. F.; WOOLDRIDGE, J. M. A Capital Asset Pricing Model with Time-varying Covariances. Journal of Political Economy, v. 96, i. 1, Feb. 1988. BONOMO, M.; GARCIA, R. Estimando e testando o CAPM condicional com efei-tos ARCH para o mercado acionário brasileiro. In: BONOMO, M. (Ed.). Finanças
aplicadas ao Brasil. Rio de Janeiro: FGV, 2002. p. 41-52.
BORGES, B. K. Avaliação da habilidade preditiva entre modelos Garch multiva-riados: uma análise baseada no critério Model Confidence. Sept. 2012. Available from: <http://www.lume.ufrgs.br/handle/10183/70011>. Access on: April 7 2015.
CAO, D.; LONG, W.; YANG, W. Sector Indices Correlation Analysis in China’s Stock Market. Procedia Computer Science, v. 17, p. 1241-1249, 2013.
CERETTA, P. S.; RIGHI, M. B.; SILVEIRA, V. G. D. Análise de desempenho finan-ceiro setorial no mercado brasileiro. Estudos do CEPE, p. 252-272, 2012.
ENGLE, R. Dynamic conditional correlation: a simple class of multivariate gener-alized autoregressive conditional heteroskedasticity models. Journal of Business & Economic Statistics, v. 20, i. 3, p. 339-350, June 2002.
ENGLE, R. F., GRANGER, C. W., & KRAFT, D. Combining competing forecasts of inflation using a bivariate ARCH model. Journal of economic dynamics and control, v. 8, i. 2, p. 151-165, 1984.
ENGLE, R. F.; SHEPPARD, K. Theoretical and empirical properties of dynamic conditional correlation multivariate GARCH (No. w8554). National Bureau of Economic Research, 2001.
FERREIRA, D. M.; DE MATTOS, L. B. O Efeito Contágio Da Crise Do Subpri-meno Mercado Acionário Brasileiro. In: BRAZILIAN ECONOMICS MEETING, 40., 2014. Proceedings... ANPEC – Brazilian Association of Graduate Programs in Economics, 2014.
GODEIRO, L. L. Testando o CAPM para o mercado acionário brasileiro utilizando GARCH Multivariado. Revista de Economia e Administração, v. 11, i. 3, 2012. HARVEY, A.; RUIZ, E.; SHEPHARD, N. Multivariate stochastic variance mo-dels. The Review of Economic Studies, v. 61, i. 2, p. 247-264, 1994.
JUBERT, R. W. et al. Um estudo do padrão de volatilidade dos principais índices financeiros do Bovespa: uma aplicação de modelos ARCH. Contabilidade, Gestão e Governança, v. 11, n. 1-2, 2009.
LINTNER, J. The aggregation of investors diverse judgments and preferences in purely competitive security markets. Journal of Financial and Quantitative
Anal-ysis, v. 4, p. 347-400, 1969.
LINTNER, J. The Valuation of Risk Assets and the Selection of Risky Investments in Stock Portfolios and Capital Budgets. The Review of Economics and Statistics, v. 47, Feb. 1965.
MANERA, M. STAR-GARCH Models for Stock Market Interactions in the Pacific Basin Region, Japan and US. 2003.
MARKOWITZ, H. Portfolio Selection. The Journal of Finance, v. 7, i. 1, p. 77-91, Mar. 1952. MEDEIROS, L. G. C. Análise quantitativa da volatilidade dos índices setoriais da Bovespa através de modelos GARCH univariados. 2012. Available from: <http://www.lume.ufrgs.br/handle/10183/56103 >. Access on: April 7 2015. MORAIS, I. A. C.; PORTUGAL, M. S. Modelagem e previsão de Volatilidade
Determinística e Estocástica para a Série do IBovespa. Estudos Econômicos, v. 29, n. 3, 1998. MOSSIN, J. Equilibrium in a capital asset market. Econometrica, v. 34, i. 4, Oct. 1966. PESSOA, F. S. de O. Gestão de risco setorial no mercado de ações brasileiro. 2013. Available from: <http://www.repositorio.ufc.br/ri/handle/riufc/9481>. Access on: April 7 2015.
RIGHI, M. B.; CERETTA, P. S. Multivariate generalized autoregressive conditional heteroscedasticity (GARCH) modeling of sector volatility transmission: A dynamic conditional correlation (DCC) model approach. African Journal of Business Man-agement, v. 6, i. 27, p. 8157-8162, 2012.
SCHWERT, G. W. Why Does Stock Market Volatility Change Over Time. Journal of Finance, v. 44, p. 1115-1153, 1989.
SHARPE, W. F. Capital Asset Prices: A Theory of Market Equilibrium under Condi-tions of Risk. The Journal of Finance, v. 19, i. 3, p. 425-442, Sept. 1964.
SOBREIRA, R.; PRATES, C. O índice setorial de energia elétrica da Bovespa como benchmark: algumas considerações críticas. Revista Eletrônica de Gestão Organiza-cional, v. 2, n. 3, 2004.
Como citar este artigo: ABNT
BESARRIA, Cássio Nóbrega et al. Empirical analysis of the performance, risk and conditional correlations of brasizian's sectorial indexes . RACE, Revista de Admin-istração, Contabilidade e Economia, Joaçaba: Ed. Unoesc, v. 15, n. 3, p. 1065-1086, set./dez. 2016. Disponível em: <http://editora.unoesc.edu.br/index.php/race>. Acesso em: dia/mês/ano.
APA
Besarria, C. N., Nóbrega, W. C. L., Araújo, B. S., Alves, J. N., Almeida, F. F., Mon-teiro, V. S., . . . Paula, Â. A. (2016). Empirical analysis of the performance, risk and conditional correlation of the brazilian’s sectorial indexes. RACE, Revista de Ad-ministração, Contabilidade e Economia, 15(3), 1065-1086. Retrieved on month/day/ year, from http://editora.unoesc.edu.br/index.php/race
APPENDIXES
APPENDIX
A: GARCH models selection criteria.
Table
A.1: Empirical overview of GARCH models of sector indices.
IEE INDX ICON IMOB IFNC IMA T UTIL Modelo AIC SBC AIC SBC AIC SBC AIC SBC AIC SBC AIC SBC AIC SBC GARCH-M (1,1) 2.16 2.20 1.61 1.64 1.95 1.98 2.80 2.83 2.32 2.35 2.32 2.35 2.41 2.44 GARCH-M (1,2) 2.16 2.21 1.62 1.66 1.96 2.00 2.83 2.87 2.33 2.36 2.33 2.37 2.41 2.45 GARCH-M (2,1) 2.17 2.21 1.63 1.66 1.96 2.00 2.81 2.84 2.32 2.36 2.33 2.37 2.41 2.45 GARCH-M (2,2) 2.17 2.21 1.62 1.66 1.96 2.00 2.80 2.84 2.33 2.37 2.34 2.38 2.41 2.46
Source: Elaborated by the