Objective: To assess the validity and reliability of a triage system for pediatric emergency care (CLARIPED) developed in Brazil.
Methods: Validity phase: prospective observational study with children aged 0 to 15 years who consecutively visited the pediatric emergency department (ED) of a tertiary hospital from July 2 to 18, 2013. We evaluated the association of urgency levels with clinical outcomes (resource utilization, ED admission rate, hospitalization rate, and ED length of stay); and compared the CLARIPED performance to a reference standard. Inter-rater reliability phase: a convenience sample of patients who visited the pediatric ED between April and July 2013 was consecutively and independently double triaged by two nurses, and the quadratic weighted kappa was estimated.
Results: In the validity phase, the distribution of urgency levels in 1,416 visits was the following: 0.0% red (emergency); 5.9% orange (high urgency); 40.5% yellow (urgency); 50.6% green (low urgency); and 3.0% blue (no urgency). The percentage of patients who used two or more resources decreased from the orange level to the yellow, green, and blue levels (81%, 49%, 22%, and 2%, respectively, p<0.0001), as did the ED admission rate, ED length of stay, and hospitalization rate. The sensitivity to identify patients with high urgency level was 0.89 (confidence interval of 95% [95%CI] 0.78–0.95), and the undertriage rate was 7.4%. The inter-rater reliability in 191 patients classified by two nurses was substantial (kw2=0.75; 95%CI 0.74–0.79).
Objetivo: Avaliar a validade e a confiabilidade de um sistema de classificação de risco para emergências pediátricas (CLARIPED) desenvolvido no Brasil.
Métodos: Fase de validade: estudo observacional prospectivo em crianças de 0 a 15 anos atendidas consecutivamente no serviço de emergência pediátrica (SEP) de um hospital terciário entre 2 e 18 de julho de 2013. Avaliou‑se a associação dos níveis de urgência com desfechos clínicos (utilização de recursos, taxa de admissão no SEP, taxa de hospitalização e tempo de permanência no SEP); e comparou‑se o desempenho do CLARIPED com um padrão de referência. Fase de confiabilidade interobservadores: uma amostra de conveniência de pacientes atendidos entre abril e julho de 2013 foi submetida a duas classificações de risco consecutivas e independentes, e estimou‑se o Kappa ponderado quadrático. Resultados: Em 1.416 atendimentos realizados na fase de validade, a distribuição de níveis de urgência foi: 0,0% vermelho/ emergência; 5,9% laranja/muito urgente; 40,5% amarelo/ urgente; 50,6% verde/pouco urgente; e 3,0% azul/sem urgência. Os percentuais de pacientes que usaram dois ou mais recursos diminuíram do nível laranja para o amarelo, verde e azul (81, 49, 22 e 2%, respectivamente, p<0,0001), assim como a taxa de admissão no SEP, o tempo de permanência no SEP e a taxa de admissão hospitalar. A sensibilidade para discriminar pacientes muito urgentes foi de 0,89 (intervalo de confiança de 95% — IC95% 0,78–0,95), e a taxa de subtriagem foi de 7,4%. A confiabilidade interobservadores em 191 pacientes classificados por duas enfermeiras foi substancial (kw2=0,75; IC95% 0,74–0,79).
ABSTRACT
RESUMO
*Corresponding author. E‑mail: [email protected] (M.C. Magalhães‑Barbosa). aInstituto D’Or de Pesquisa e Ensino, Rio de Janeiro, RJ, Brazil.
bUniversidade Federal do Rio de Janeiro, Rio de Janeiro, RJ, Brazil.
Received on April 15, 2017; approved on September 24, 2017; available online on November 27, 2018.
Validity and reliability of a new triage system
for pediatric emergency care: clariped
Validade e confiabilidade de um novo sistema de classificação de
risco para emergências pediátricas: CLARIPED
Maria Clara de Magalhães-Barbosa
a,*, Arnaldo Prata-Barbosa
a,
Carlos Eduardo Raymundo
a, Antonio José Ledo Alves da Cunha
b,
INTRODUCTION
Triage in the pediatric emergency department (ED) is a chal-lenge. Limited ability to communicate, subclinical presenta-tions in young children, variapresenta-tions in normal vital signs (VS) according to age group, among other factors, make pediatric triage a complex and difficult task.1
The triage systems most commonly used worldwide for pediatric emergency care are the Manchester Triage System (MTS), the Canadian Pediatric Triage and Acuity Scale (PedCTAS), the Emergency Severity Index (ESI), and the Australasian Triage Scale (ATS).2,3 These instruments were
originally designed for adults, and later adapted for children, who represent 20 to 40% of the population treated in emer-gency departments.4
The validity and reliability of these triage systems for chil-dren have been assessed predominantly in the countries they were created or in developed countries with similar cultures.5-22
These instruments are very extensive or complex, and their performance in countries with distinct sociodemographic and/or cultural characteristics has been lower than in their original countries.23-26 Differences in human and
technolog-ical resources, professional qualification, and health policies can interfere in their performance. Simpler algorithms, pro-vided they are valid and reliable, could be more appropriate for countries like Brazil.
The South African Triage Scale (SATS) is a simple and objective tool;27 however, it has only four urgency levels
(ULs) and three age groups for VS evaluation. The tool rec-ommended by the World Health Organization (WHO) for less developed countries, the Emergency Triage Assessment and Treatment (ETAT), prioritizes the identification of patients with a high urgency level.28 This characteristic does
not reflect 70 to 90% of the population who crowds the public and private Brazilian pediatric EDs and have inter-mediate urgency levels.
To meet these demands, a team of pediatric ED experts in Brazil has developed a five-level triage system for pediat-ric emergency care (CLARIPED), which is simple and objec-tive, easy to use and train, and stratified into five age groups.29
The purpose of this study was to assess the validity and reli-ability of this instrument.
METHOD
This is a prospective observational study conducted in the pediatric ED of a private tertiary hospital in the city of Rio de Janeiro (Rio de Janeiro, Brazil), with 3,000 visits per month, daily staff of 3 to 4 doctors, 2 nurses, and 2 nurse technicians, in addition to pediatric residents.
To assess the validity of CLARIPED, all consecutive patients who visited the ED and underwent triage from July 2 to 18, 2013 were included. We excluded patients who did not undergo triage. Data were collected every 24 hours from the medical records of the previous day. Demographic and clinical variables from triage and during ED stay, such as diagnostic/therapeutic resources, ED length of stay, and destination were collected to digital forms. Data were reviewed for consistency.
To evaluate inter-rater reliability, we prospectively selected a convenience sample during daytime shifts (8 to 17h) between April and July 2013. Immediately after the conventional tri-age performed by the regular tritri-age nurse, consecutive patients and their guardians were invited to voluntarily participate in the study. If they agreed and the guardian signed the Informed Consent Form, they were taken to another room, where a research nurse blind to the first classification, performed a new complete triage procedure. The research nurses belonged to the triage team, had the same level of training, and voluntarily par-ticipated in the study, in their extra work hours. In this phase, for ethical reasons, we excluded patients who needed immedi-ate treatment, due to the impossibility of subjecting them to two consecutive triage procedures.
CLARIPED was applied as previously described.29 The first
step was the assessment of four vital signs to calculate the pedi-atric vital signs score (VIPE score), from 0 to 12, classified in five ULs: 0=blue (no urgency); 1 or 2=green (low urgency); 3 to 5=yellow (urgency); 6 to 9=orange (high urgency); and 10 to 12=red (emergency). The second step was the evaluation for the presence of clinical discriminators consisting of signs, symptoms and/or complaints, also distributed into 5 ULs. If an identified discriminator corresponded to a higher UL than the one determined by the VIPE score, the final classification would be the one with greatest UL.29
Due to the lack of a gold standard for triage in pediatric ED, we used two methods to evaluate validity:
Conclusions: The CLARIPED system showed good validity and substantial reliability for triage in a pediatric emergency department.
Keywords: Emergency medical services; Pediatrics; Triage; Risk assessment; Reproducibility of results.
Conclusões: O sistema CLARIPED mostrou boa validade e substancial confiabilidade para classificação de risco em um serviço de emergência pediátrica.
1. the association between the UL designated by CLARIPED and four clinical outcomes (diagnostic/therapeutic resource utilization, admission rate at the ED obser-vation room, ED length of stay, and hospitalization), which were considered proxies of urgency, similarly to other studies;9-12,14,15 and
2. comparison between the CLARIPED classification and the one determined by a reference standard.
The first method was based on the following hypothesis: if CLARIPED adequately identifies the five ULs, a decreas-ing gradient in the frequency of outcomes should occur, from the highest to the lowest UL. The outcome “resource utiliza-tion” included diagnostic tests, therapeutic procedures, and specialty consultations, according to a previously standard-ized and adapted table from Gilboy et al.30 This variable was
dichotomized (<2 resources and ≥2 resources), similarly to other studies.12,14,15,19 The admission rate to the ED observation
room comprised only children who, after occupying an ED bed, were discharged home. ED length of stay was calculated from the beginning of physician assessment until the patient left the ED. Patients who progressed to hospitalization, even those transferred to other institutions, were included in the hospitalization rate.
In the second method, the reference standard was based on a matrix developed by experts to study the MTS in the pediat-ric population19 and adapted for the present study. This matrix
used data extracted from medical records (significant vital signs changes, life-threatening clinical conditions, laboratory and imaging tests, therapeutic approach, and patient destination), alone or in various possible combinations, to retrospectively identify the appropriate urgency level and compare it with the one previously assigned by the triage system.
For the validity, we estimated a sample of 1,385 ED vis-its, based on data from the literature regarding the ED length of stay, which was the outcome that demanded the largest sample. Assuming an alpha error=0.05 and beta error=0.80, we used the difference of 71 minutes between level 2 (high urgency) and level 3 (urgency), reported in a study on the ESI-4 (309 minutes; 95%CI 257–361, SD=225.5 versus 238 min-utes; 95%CI 223–251, SD=112.8, respectively).15
For the inter-rater reliability, the sample calculation was based on a pilot study including 61 visits, which gen-erated a quadratic weighted Kappa (kw2) of 0.57 (95%CI
0.51–0.68). To reduce the confidence interval range to 0.10, we made simulations with increasing samples sizes, and the same distribution of agreements and disagreements between ULs observed in the pilot study, resulting in an estimated sample of 183 visits.
Associations between ULs and outcomes were assessed using the chi-square test or Fisher’s exact test for categorical variables and the Mann-Whitney test or Kruskal-Wallis test for contin-uous variables. We used logistic regressions to estimate odds ratios (OR) resulting from the association of ULs (independent variables) with hospitalization and use of resources (dependent variables), after adjustments for potential confounding fac-tors (age, service time and day of the week). Overtriage and undertriage rates, sensitivity, and specificity in diagnosing high urgency cases were calculated by comparing CLARIPED with the reference standard. Stratification by age group and diagnos-tic categories were performed on an exploratory basis.
For inter-rater reliability, we chose kw2 because this estimate
takes into account the degree of disagreement between catego-ries, in addition to being the most widely used in other studies. The analysis considered a significance level of 0.05 and 95%CI. We used the statistical softwares Stata 12.0 (StataCorp, College Station, Texas, United States) and R 2.15.3 (R Foundation, Vienna, Austria). The Committee for Ethics in Research (CER) of the institution approved this project.
RESULTS
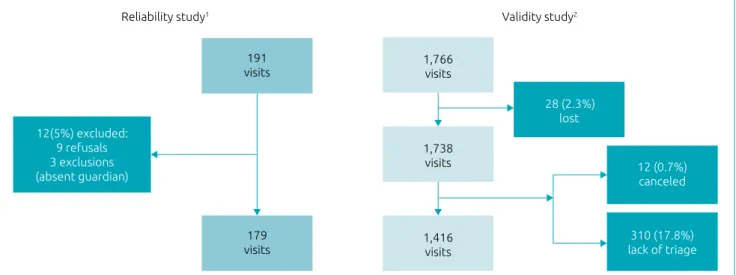
The validity phase included 1,416 consecutive visits (80.2% of those eligible) and excluded 28 cases whose medical records were lost (1.6%), 12 cases who left the ED before triage (0.7%), and 310 cases who did not undergo triage (17.6%). In the reli-ability phase, 179 patients agreed to participate in the study (93.7% of invitees), 9 refused, and 3 were excluded due to the absence of a legal guardian (Figure 1).
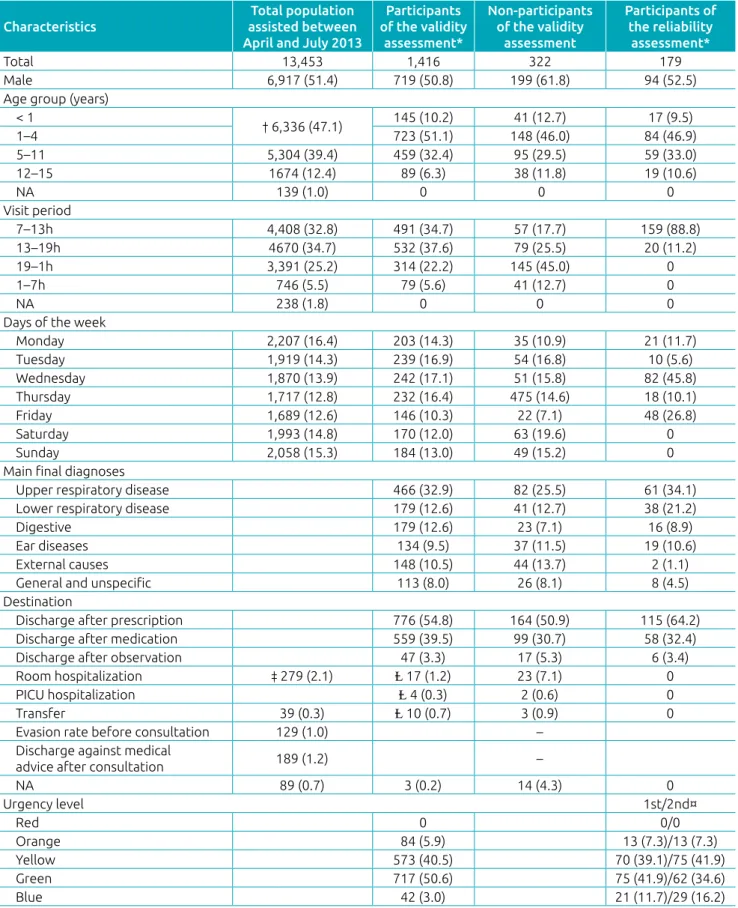
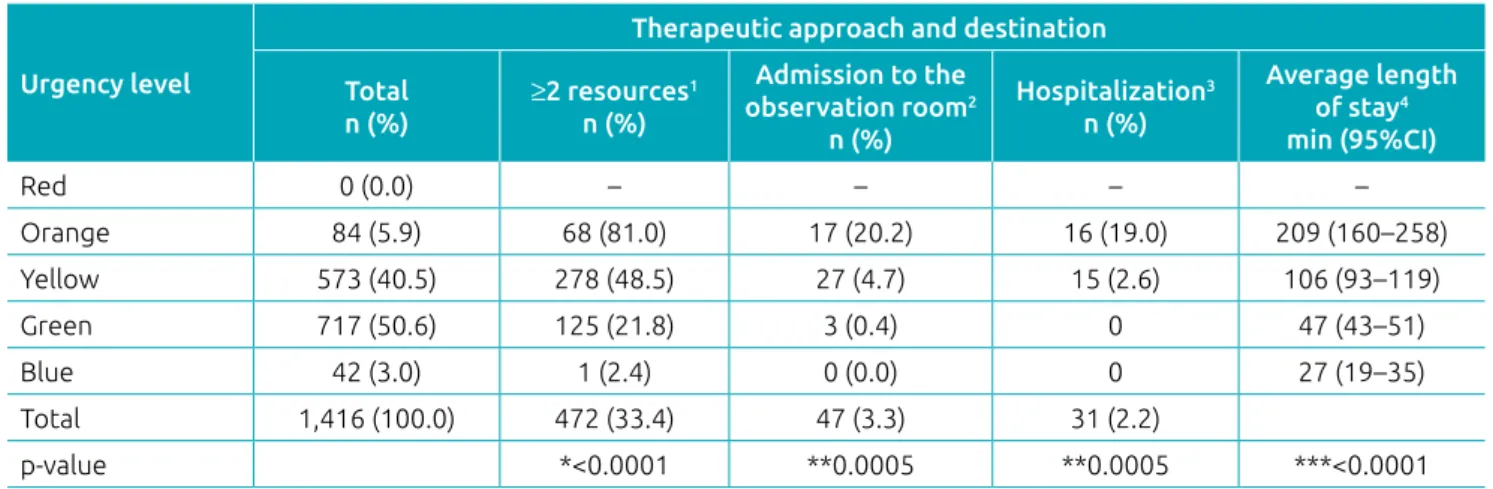
The validity sample had the following distribution: red 0.0%; orange 5.9%; yellow 40.5%; green 50.6%; and blue 3.0% (Table 1). Resource utilization was evaluated in 1,415 visits, while admission to the ED observation room and hospitaliza-tion were evaluated in 1,413 visits and ED length of stay in 1,090 visits (Table 2). The 326 cases with missing data for this last outcome showed an UL distribution similar to the 1,416 included cases (p=0.2181), suggesting missing at random loss. The frequencies of all outcomes decreased as the ULs lowered:
≥2 resources (orange 80.9%, yellow 48.5%, green 21.8%, and blue 2.4%; p<0.0001), admission to the ED observation room (20.2%, 4.7%, 0.4%, and 0.0%; p=0.0005), hospitalization (19.0%, 2.6%, 0.0%, and 0.0%; p=0.0005), and ED length of stay; (209, 106, 47, and 27 minutes; p<0.0001) (Table 2).
Orange level patients had a higher chance of using
The comparison between CLARIPED and the reference standard showed absolute agreement in 33.5% of cases, over-triage in 59.1%, and underover-triage in 7.4%. Most of the disagree-ments represented assigndisagree-ments one category above the correct classification (49.4%), mainly in the green and blue levels, or below it (7.3%), mainly in the yellow level (Table 3). There were no differences between age groups in overtriage (p=0.20 to 0.98) and undertriage (p=0.13 to 0.52) when compared to general rates. Overtriage rates were lower for lower respiratory diseases (29.6%; p<0.01), and higher for upper respiratory dis-eases (67.1%; p=0.002) and ear diseases (76.1%; p=0.0002). No diagnostic category showed an undertriage rate different from the general one of 7.4%.
CLARIPED sensitivity and specificity in identifying high urgency levels were 0.89 (95%CI 0.78–0.95) and 0.98 (95%CI 0.97–0.99), respectively. The stratification of these estimates by diagnostic categories and age group was impaired due to the small number of cases in subgroups (Table 4).
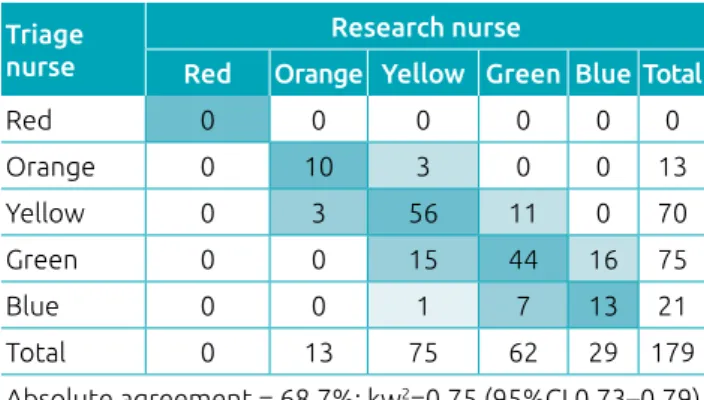
In the reliability phase, 15 nurses with the same training level on CLARIPED participated in pairs in the double tri-age: 13 nurses in the first and two nurses in the second triage. The median age of the nurses was 28 years old (interquartile range [IQR]: 26.0–29.5). Four nurses had over five years of pediatric ED experience, including the two research nurses, while 11 nurses had less than five years of experience. The UL distribution in the first triage was orange 7.3%, yellow 39.1%, green 41.9%, and blue 11.7%; and in the second triage was orange 7.3%, yellow 41.9%, green 34.6%, and blue 16.2% (Table 1). The absolute agreement was 68.7%, and the kw2
was 0.75 (95%CI 0.73–0.79) (Table 5).
DISCUSSION
In addition to having good validity and reliability, an ideal triage system must be feasible and effective. Ensuring team adherence and procedure expedition is essential. CLARIPED showed good validity, demonstrated by a strong association between ULs and clinical outcomes, in addition to substantial inter-rater reliabil-ity. The measures of association with outcomes were comparable to those observed in similar studies with other triage systems. The chance of hospitalization in the orange level was almost 11 times higher than in the yellow and greater than the esti-mate of a multicenter study on PedCTAS (OR=4.93; 95%CI 2.95–8.25).10 However, in the present study, the
hospitaliza-tion rate (2.2%) was lower than those reported in other studies (5–10%),9,10,12,15,26,27 which could be the result of differences in
populations or institutional policies.
Given the low hospitalization rate, the resource utilization was a more appropriate outcome for the population under study. The frequency of patients who used ≥2 resources decreased from highest to lowest UL (81.0; 48.5; 21.8; and 2.4%; p<0.0001). Considering that there were no patients classified as red, these results were similar to those reported with the ESI-4 (100, 70, 45, 17, and 4%)14 and are more discriminant than those
found with the MTS (41.7, 25.4, 30.2, 16.6, and 3.7%).19
The orange level showed an almost 5 times higher chance of using ≥ 2 resources when compared to the yellow level, while the green level showed a 5 times lower chance. This association was also very close to that reported with the PedCTAS, when comparing high urgency level (OR=4.67; 95%CI 2.61–8.34) and low urgency level (OR=0.21; 95%CI 0.17–0.28) to the urgency level cases as reference.10
Figure 1 Patient selection algorithm for the validity and reliability studies.
1Reliability study (convenience sample between April and July 2013); 2validity study (consecutive sample from July 2 to 18, 2013).
Reliability study1 Validity study2
12(5%) excluded: 9 refusals 3 exclusions (absent guardian)
191 visits
179 visits
1,766 visits
1,738 visits
1,416 visits
28 (2.3%) lost
12 (0.7%) canceled
Table 1 Baseline characteristics of the general population and validity and reliability samples, and triage of validity and reliability samples.
*Consecutive sample; **convenience sample; NA: none of the alternatives; PICU: pediatric intensive care unit; †grouping the visits of all children <5 years; ‡grouping all room and PICU hospitalizations=2.1%; Ⱡadding up room hospitalizations (1.2%), PICU hospitalizations (0.3%), and transfers (0.7%), the total hospitalization rate=2.2%; 1st and 2nd triages of the reliability assessment.
Characteristics
Total population assisted between April and July 2013
Participants of the validity
assessment*
Non‑participants of the validity
assessment
Participants of the reliability
assessment*
Total 13,453 1,416 322 179
Male 6,917 (51.4) 719 (50.8) 199 (61.8) 94 (52.5)
Age group (years) < 1
† 6,336 (47.1) 145 (10.2) 41 (12.7) 17 (9.5)
1–4 723 (51.1) 148 (46.0) 84 (46.9)
5–11 5,304 (39.4) 459 (32.4) 95 (29.5) 59 (33.0)
12–15 1674 (12.4) 89 (6.3) 38 (11.8) 19 (10.6)
NA 139 (1.0) 0 0 0
Visit period
7–13h 4,408 (32.8) 491 (34.7) 57 (17.7) 159 (88.8)
13–19h 4670 (34.7) 532 (37.6) 79 (25.5) 20 (11.2)
19–1h 3,391 (25.2) 314 (22.2) 145 (45.0) 0
1–7h 746 (5.5) 79 (5.6) 41 (12.7) 0
NA 238 (1.8) 0 0 0
Days of the week
Monday 2,207 (16.4) 203 (14.3) 35 (10.9) 21 (11.7)
Tuesday 1,919 (14.3) 239 (16.9) 54 (16.8) 10 (5.6)
Wednesday 1,870 (13.9) 242 (17.1) 51 (15.8) 82 (45.8)
Thursday 1,717 (12.8) 232 (16.4) 475 (14.6) 18 (10.1)
Friday 1,689 (12.6) 146 (10.3) 22 (7.1) 48 (26.8)
Saturday 1,993 (14.8) 170 (12.0) 63 (19.6) 0
Sunday 2,058 (15.3) 184 (13.0) 49 (15.2) 0
Main final diagnoses
Upper respiratory disease 466 (32.9) 82 (25.5) 61 (34.1)
Lower respiratory disease 179 (12.6) 41 (12.7) 38 (21.2)
Digestive 179 (12.6) 23 (7.1) 16 (8.9)
Ear diseases 134 (9.5) 37 (11.5) 19 (10.6)
External causes 148 (10.5) 44 (13.7) 2 (1.1)
General and unspecific 113 (8.0) 26 (8.1) 8 (4.5)
Destination
Discharge after prescription 776 (54.8) 164 (50.9) 115 (64.2)
Discharge after medication 559 (39.5) 99 (30.7) 58 (32.4)
Discharge after observation 47 (3.3) 17 (5.3) 6 (3.4)
Room hospitalization ‡ 279 (2.1) Ⱡ 17 (1.2) 23 (7.1) 0
PICU hospitalization Ⱡ 4 (0.3) 2 (0.6) 0
Transfer 39 (0.3) Ⱡ 10 (0.7) 3 (0.9) 0
Evasion rate before consultation 129 (1.0) –
Discharge against medical
advice after consultation 189 (1.2) –
NA 89 (0.7) 3 (0.2) 14 (4.3) 0
Urgency level 1st/2nd¤
Red 0 0/0
Orange 84 (5.9) 13 (7.3)/13 (7.3)
Yellow 573 (40.5) 70 (39.1)/75 (41.9)
Green 717 (50.6) 75 (41.9)/62 (34.6)
The pediatric ED length of stay was calculated from the beginning of the assessment by a doctor, and not on arrival at the ED, as in most studies. The purpose was to avoid dis-tortion in the association between this outcome and the UL since the triage process determines that the lower the urgency level assigned to the patient, the higher the waiting time to be seen by a doctor. The distribution of length of stay showed a decreasing gradient from the highest to the lowest UL, cor-roborating the good validity of the instrument (209, 106, 47, and 27 minutes; p<0.0001). Disregarding the level 1 (red), this gradient was also more discriminant than those identified in two studies on the PedCTAS (191, 250, 191, 96, and 66 min-utes; p<0.0001, and 309, 238, 186, and 160 minutes),9,10 and
two studies on the ESI-4 (334, 221, 207, 151, and 132 min-utes; p<0.001, and 156, 236, 259, 117, and 99 minutes; p<0.0001).12,14 However, the difference in the definition of
this outcome in these studies might have contributed to the less consistent results.
Despite the difference in sample size between this study (n=1,416) and two studies on the MTS (n=13,554 and 11,260),20,22 the use of a similar reference standard by the three
studies allows some comparisons between the performance of the tools. CLARIPED showed absolute agreement similar to MTS (33.5 versus 34.0%); higher overtriage rate (59.1% ver-sus 54.0%), higher sensitivity (89.0 verver-sus 63.0%), and spec-ificity (98.0 versus 79.0%); and lower undertriage rate (7.4% versus 12.0%).20 After modifications in some MTS pediatric
discriminators, specificity increased (87%), overtriage decreased (47%), sensitivity did not change (64%), and undertriage presented a slight increase (15%).22 Nonetheless, it is
import-ant to question whether the reference standard provides the appropriate urgency level in all cases. For example, an infant
who arrives at the pediatric ED weeping, with irritability, and intense pain would be properly classified as orange or yellow by MTS and CLARIPED. If the final diagnosis is acute oti-tis media, which is a very common entity in pediatrics, the patient will be medicated with an analgesic and discharged
Table 3 Urgency level assigned by the reference standard versus triage system for pediatric emergency care (CLARIPED): validity study (n=1,416).
CLARIPED Reference standard
Red Orange Yellow Green Blue Total
Red 0 0 0 0 0 0
Orange 0 55 13 12 4 84
Yellow 0 6 175 271 121 573
Green 0 1 86 214 416 717
Blue 0 0 0 11 31 42
Total 0 62 274 508 572 1,416
Absolute agreement
Undertriage of 1 category Undertriage >1 category Overtriage of 1 category Overtriage >1 category
Absolute agreement = 33.5% (475/1,416) Total overtriage = 59.1%
(837/1,416) Total undertriage = 7.3% (104/1,416)
Overtriage (orange) = 0.0% Undertriage (orange) = 11.3% (7/62)
Overtriage (yellow) = 4.7%
(13/274) Undertriage (yellow) = 31.4% (86/274) Overtriage (green) = 55.7%
(283/508) Undertriage (green) = 2.2% (11/508)
Overtriage (blue) = 94.5%
(541/1,416) Undertriage (blue) = 0
Urgency level
Therapeutic approach and destination
Total n (%)
≥2 resources1
n (%)
Admission to the
observation room2
n (%)
Hospitalization3
n (%)
Average length of stay4
min (95%CI)
Red 0 (0.0) – – – –
Orange 84 (5.9) 68 (81.0) 17 (20.2) 16 (19.0) 209 (160–258)
Yellow 573 (40.5) 278 (48.5) 27 (4.7) 15 (2.6) 106 (93–119)
Green 717 (50.6) 125 (21.8) 3 (0.4) 0 47 (43–51)
Blue 42 (3.0) 1 (2.4) 0 (0.0) 0 27 (19–35)
Total 1,416 (100.0) 472 (33.4) 47 (3.3) 31 (2.2)
p-value *<0.0001 **0.0005 **0.0005 ***<0.0001
Table 2 Distribution of progressive outcomes for different urgency categories: validity study (n=1,416).
with a prescription, being considered green by the reference standard. Actually, the CLARIPED overtriage rate was partic-ularly high for ear diseases. In the same way, a patient with an extensive cut-contusion wound, requiring sutures, would be classified as yellow by CLARIPED and MTS, and green by the reference standard. These and other similar cases could justify the low absolute agreement, as well as the high overtriage rate of both tools compared to the reference standard. In fact, the reference standard was not validated.
This study estimated the reliability by including only patients treated in real time, instead of hypothetical scenarios, which were commonly used in several studies.5,12,16,17,21,27 Clinical scenarios
do not replicate the difficulties of the actual triage process, being subjected to biases. The present study exhibited substantial inter-rater reliability (kw2=0.75; 95%CI 0.74–0.79). This result is
bet-ter than those obtained in the first studies on other instruments with actual patients: MTS (kw2=0.65; 95%CI 0.56–0.72),20
PedCTAS (kw2=0.61; 95%CI 0.42–0.80),8 and ESI-4 (kw2=0.57;
95%CI 0.52–0.62).14 More recent studies showed better
reliabil-ity with PedCTAS,10 (kw2=0.74; 95%CI 0.71–0.76) and
ESI-415,26 (k linear=0.92; p<0.001 and k not specified=0.82; 95%CI
0.67–0.84). The improvement in reliability over time probably reflects the refinement of these tools and a progressive better qualification of the teams. In this regard, the reliability exhibited by the first version of CLARIPED is promising.
This study has some limitations. It was carried out in a sin-gle center, and the researchers could have over-motivated the health team, resulting in an overestimation of the validity and reliability of CLARIPED. However, the easy assimilation and implementation of the tool suggest that it could be appropri-ate for many similar environments, including non-hospital emergency departments.
Another limitation was that participants of the validity phase represented 80.2% of eligible patients and the hospitalization rate was higher among non-participants (8.6% versus 2.2%) (Table 1).
Table 4 CLARIPED sensitivity and specificity in identifying high urgency in the general population, age range
subgroups, and main diagnostic categories.
Subgroup No. of
patients
% of high urgency*
Sensitivity† Specificity†
CLARIPED Reference
Total 1,416 84 (5.9%) 62 (4.4%) 0.89 (0.78–0.95) 0.98 (0.97–0.99)
Age group (years)
<1 145 9 (6.2%) 9 (6.2%) 0.89 (0.52–1.00) 0.99 (0.96–1.00)
1–4 723 31 (4.3%) 25 (3.5%) 0.84 (0.64–0.95) 0.99 (0.97–0.99)
5–11 459 34 (7.4%) 22 (4.8%) 0.91 (0.71–0.99) 0.97 (0.95–0.98)
12–15 89 10 (11.2%) 6 (6.7%) 1.00 (0.42–1.00) 0.95 (0.88–0.99)
Final diagnosis
Upper respiratory 466 5 (1.1%) 4 (1.0%) 0.75 (0.19–0.99) 1.00 (0.98–1.00)
Lower respiratory 179 37 (20.7%) 31 (17.3%) 1.00 (0.84–1.00) 0.96 (0.92–0.99)
Digestive 179 17 (9.5%) 14 (7.8%) 0.79 (0.49–0.95) 0.96 (0.92–0.99)
Ear 134
External causes 148 11 (7.4%) 2 (1.4%) 1.00 (0.09–1.00) 0.94 (0.89–0.97)
General and unspecific 113 4 (3.5%) 4 (3.5%) 0.50 (0.07–0.93) 0.98 (0.94–1.00) *high urgency: red and orange categories; sensitivity†: cases of high urgency (red and orange) designated by CLARIPED/cases of high urgency determined by the reference standard; specificity†: cases of low urgency (yellow, green, and blue) designated by CLARIPED/cases of low urgency determined by the reference standard.
Triage nurse
Research nurse
Red Orange Yellow Green Blue Total
Red 0 0 0 0 0 0
Orange 0 10 3 0 0 13
Yellow 0 3 56 11 0 70
Green 0 0 15 44 16 75
Blue 0 0 1 7 13 21
Total 0 13 75 62 29 179
Absolute agreement = 68.7%; kw2=0.75 (95%CI 0.73–0.79)
Table 5 Urgency level determined by the research nurse versus triage nurse – reliability study (n=179).
The most plausible reason for this difference is that the pedi-atric ED of the present study receives patients referred to hos-pitalization by its assistant pediatricians. These children are sent directly to the ED observation room to start treatment, without undergoing triage; however, the characteristics of the study participants did not differ from the total pediatric ED population (Table 1).
An additional limitation is the lack of patients classi-fied as red in the period studied; however, this fact does not invalidate the results found in the other four urgency levels, which constitute about 99% of emergency pediatric care. Two validity studies on PedCTAS did not include patients requiring immediate care either.6,10 These patients are very
rare in most pediatric EDs around the world,7,9,11,23,25,26 and,
in daily practice, they do not undergo triage, being directly led to the reanimation room, and classified retrospectively. On the other hand, one of the main challenges of triage system is discriminating intermediate UL patients, such as levels 3 (urgency) and 4 (low urgency), which comprise the vast majority of patients who crowd the pediatric EDs. Level 3 patients are those with the potential to have their condition worsen if they wait a long time for medical care, but who might not be easily identified without an objective assessment. Surgical abdominal pain (appendicitis or intus-susception), cases with the risk of severe dehydration (pro-fuse diarrhea or incoercible vomiting), or acute bacterial infection (high fever in small children) are some examples of level 3 (urgent) patients.
Lastly, the present study used clinical outcomes as prox-ies of urgency to determine the convergent construct validity.
However, the goal of triage systems is not to predict clinical outcomes, which are good markers of complexity and severity of diseases, but do not always reflect the level of urgency in all situations, in addition to being influenced by the quality of treatment and institutional policies. For instance, a patient with seizures (red) or having an asthma crisis (orange) can be discharged from the ED observation room a few hours after treatment, without needing hospitalization. On the other hand, a patient with a serious chronic disease can come to the ED with a low urgency complication (green) and need hospital-ization due to the underlying disease.
In conclusion, this is the first study on the validity and reli-ability of a pediatric triage system in Brazil. CLARIPED proved to be a valid and reliable instrument in the center where it was developed. A multicenter study is necessary to corroborate these preliminary findings, indicate the adjustments needed for different health contexts, and assess the external validity of the instrument.
funding
• National Council for Scientific and Technological Development (Conselho Nacional de Desenvolvimento Científico e Tecnológico – CNPq), Brazil, grant No. 448855/2014-3
• Fundação Carlos Chagas Filho de Amparo à Pesquisa do Estado do Rio de Janeiro (FAPERJ), Brazil, grant No. E-26/010.000196/2015
conflict of interests
The authors declare no conflict of interests.
REFERENCES
1. Hohenhaus SM, Travers D, Mecham N. Pediatric triage: a review of emergency education literature. J Emerg Nurs. 2008;34:308-13.
2. Christ M, Grossmann F, Winter D, Bingisser R, Platz E. Modern triage in the emergency department. Dtsch Arztebl Int. 2010;107:892-8.
3. Farrohknia N, Castrén M, Ehrenberg A, Lind L, Oredsson S, Jonsson H, et al. Emergency department triage scales and their components: a systematic review of the scientific evidence. Scand J Trauma Resusc Emerg Med. 2011;19:42. 4. Tang N, Stein J, Hsia RY, Maselli JH, Gonzales R. Trends
and characteristics of US emergency department visits, 1997-2007. JAMA. 2010;304:664-70.
5. Bergeron S, Gouin S, Bailey B, Amre DK, Patel H. Agreement among pediatric health care professionals with the pediatric
Canadian triage and acuity scale guidelines. Pediatr Emerg Care. 2004;20:514-8.
6. Gouin S, Gravel J, Amre DK, Bergeron S. Evaluation of the Paediatric Canadian Triage and Acuity Scale in a pediatric ED. Am J Emerg Med. 2005;23:243-7.
7. Ma W, Gafni A, Goldman RD. Correlation of the Canadian Paediatric Emergency Triage and Acuity Scale to ED resource utilization. Am J Emerg Med. 2008;26:893-7.
8. Gravel J, Gouin S, Manzano S, Arsenault M, Amre D. Interrater agreement between nurses for the Pediatric Canadian Triage and Acuity Scale in a tertiary care center. Acad Emerg Med. 2008;15:1262-7.
10. Gravel J, Gouin S, Goldman RD, Osmond MH, Fitzpatrick E, Boutis K, et al. The Canadian Triage and Acuity Scale for children: a prospective multicenter evaluation. Ann Emerg Med. 2012;60:71-7.
11. Gravel J, Fitzpatrick E, Gouin S, Millar K, Curtis S, Joubert G, et al. Performance of the Canadian Triage and Acuity Scale for children: a multicenter database study. Ann Emerg Med. 2013;61:27-32.
12. Baumann MR, Strout TD. Evaluation of the Emergency Severity Index (version 3) triage algorithm in paediatric patients. Acad Emerg Med. 2005;12:219-24.
13. Durani Y, Brecher D, Walmsley D, Attia MW, Loiselle JM. The Emergency Severity Index Version 4: reliability in pediatric patients. Pediatr Emerg Care. 2009;25:751-3.
14. Travers DA, Waller AE, Katznelson J, Agans R. Reliability and validity of the emergency severity index for pediatric triage. Acad Emerg Med. 2009;16:843-9.
15. Green NA, Durani Y, Brecher D, DePiero A, Loiselle J, Attia M. Emergency Severity Index version 4: a valid and reliable tool in paediatric emergency department triage. Pediatr Emerg Care. 2012;28:753-7.
16. Considine J, LeVasseur SA, Villanueva E. The Australasian Triage Scale: examining emergency department nurses’ performance using computer and paper scenarios. Ann Emerg Med. 2004;44:516-23.
17. Crellin DJ, Johnston L. Poor agreement in application of the Australasian Triage Scale to paediatric emergency department presentations. Contemp Nurse. 2003;15:48‑60. 18. Durojaiye L, O’Meara M. A study of triage of paediatric
patients in Australia. Emerg Med (Fremantle). 2002;14:67-76.
19. Roukema J, Steyerberg EW, Meurs A, Ruige M, Lei J, Moll HA. Validity of the Manchester Triage System in paediatric emergency care. Emerg Med J. 2006;23:906-10.
20. Veen M, Steyerberg EW, Ruige M, Meurs AH, Roukema J, Lei J, et al. Manchester triage system in paediatric
emergency care: prospective observational study. BMJ. 2008;337:a1501.
21. Veen M, Walle VF, Steyerberg EW, Meurs AH, Ruige M, Strout TD, et al. Repeatability of the Manchester Triage System for children. Emerg Med J. 2010;27:512-6.
22. Veen M, Steyerberg EW, Klooster MV, Ruige M, Meurs AH, Lei JV, et al. The Manchester triage system: improvements for paediatric emergency care. Emerg Med J. 2012;29:654-9.
23. Landaluce AF, Pijoan JI, Mingegi S, Benito FJ. Evaluación de la escala canadiense de triaje pediátrico en un servicio de urgencias de pediatría europeo. Emergencias. 2010;22:355-60.
24. Chang YC, Ng CJ, Wu CT, Chen LC, Chen JC, Hsu KH. Effectiveness of a five‑level Paediatric Triage System: an analysis of resource utilisation in the emergency department in Taiwan. Emerg Med J. 2013;30:735-9.
25. Al‑Hindi AA, Al‑Akhfash AA, Fareed AM, Alhusainan KS, Algasomy SF, Althowainy IR. Efficacy of implementation of a 5 scale pediatric triage and acuity scale in pediatric emergency, Saudi Arabia. Saudi Med J. 2014;35:999‑1004. 26. Jafari‑Rouhi AH, Sardashti S, Taghizadieh A, Soleimanpour,
Barzegar M. The Emergency Severity Index, version 4, for pediatric triage: a reliability study in Tabriz Children’s Hospital, Tabriz, Iran. Int J Emerg Med. 2013;6:36. 27. Twomey M, Cheema B, Buys H, Cohen K, Sa A, Louw P, et al.
Vital signs for children at triage: a multicentre validation of the revised South African Triage Scale (SATS) for children. S Afr Med J. 2013;103:304‑8.
28. Robertson MA, Molyneux EM. Description of cause of serious illness and outcome in patients identified using ETAT guidelines in urban Malawi. Arch Dis Child. 2001;85:214-7.
29. Magalhães‑Barbosa MC, Prata‑Barbosa A, Cunha AJ, Lopes CS. CLARIPED: a new tool for risk classification in pediatric emergencies. Rev Paul Pediatr. 2016;34:254-62.