53
PSYCHOMETRIC PROPER
TIES OF THE EBES SCALE
▼ ▼ ▼ ▼ ▼
https://doi.org/10.1590/1982-02752018000100006
1 Universidade São Francisco, Programa de Pós-Graduação Stricto Sensu em Psicologia. R. Alexandre Rodrigues Barbosa, 45, Centro, 13251-900, Itatiba, SP, Brasil. Correspondência para/Correspondence to: L.F. CARVALHO. E-mail: <[email protected]>.
Support: Fundação de Amparo à Pesquisa do Estado de São Paulo and Coordenação de Aperfeiçoamento de Pessoal de Nível Superior. Article based on the doctoral dissertation of L.F. CARVALHO entitled “Desenvolvimento e verificação das propriedades psicométricas do
Inventário Dimensional Clínico da Personalidade”. Universidade São Francisco, 2011.
Como citar este artigo/How to cite this article
Carvalho, L. F., Zano, C., Ambiel, R. A. M., & Ferreira-Rodrigues, C. F. (2018). Psychometric properties of the Subjective Well-Being Scale using the Rating Scale Model. Estudos de Psicologia (Campinas), 35(1), 53-63. https://doi.org/10.1590/1982-02752018000100006
Psychometric properties of the Subjective Well-Being
Scale using the Rating Scale Model
Propriedades psicométricas da Escala de Bem-Estar
Subjetivo pelo Rating Scale Model
Lucas de Francisco CARVALHO1
ORCID iD 0000-0002-3274-9724
Cristian ZANON1
ORCID iD 0000-0003-3822-5275
Rodolfo Augusto Matteo AMBIEL1
ORCID iD 0000-0002-3921-8547
Carla Fernanda FERREIRA-RODRIGUES1
ORCID iD 0000-0002-6590-1681
Abstract
Positive Psychology has gained momentum in the international scenario, and one of its first constructs that has been
studied in Brazil is subjective well-being. This study aims to verify the Escala de Bem-Estar Subjetivo (Subjective
Well-Being Scale) Scale’s psychometric properties by independently applying the Item Response Theory’s rating scale model to each scale component. Evidence of validity was verified based on internal structure and reliability coefficients, which were assessed through internal consistency. In order to do so, a subject database consisting of 182 male and female college students aged between 18 and 57 years old was used (mean age of 24.6 years). Results showed evidence of unidimensionality of all three factors of the scale. In addition, only one of the factors’ response category did not have the expected results. Participants tended to choose mostly Positive Affect items, and negative affect had the lowest theta average. The implications of these findings to the instrument’s psychometric quality are thoroughly discussed.
Keywords: Item response theory; Subjective well-being scale; Test reliability; Test validity.
Resumo
A Psicologia Positiva vem ganhando espaço no cenário mundial e um dos primeiros construtos estudados no Brasil foi o bem-estar subjetivo. Este estudo teve como objetivo verificar as propriedades psicométricas da Escala de Bem-Estar Subjetivo, aplicando o Rating Scale Model, da Teoria de Resposta ao Item, de forma independente, a cada componente da escala. Especificamente, verificou-se evidências de validade com base na estrutura interna e coeficientes de fidedignidade
54
L.F
.
CAR
V
ALHO
et al.
por consistência interna. Para tanto, utilizou-se um banco de dados com 182 sujeitos, estudantes universitários de ambos os sexos, com idades entre 18 e 57 anos (M = 24,6 anos). Os resultados mostraram que os três fatores da Escala de Bem-Estar Subjetivo apresentam evidências de unidimensionalidade. Além disso, apenas uma categoria de resposta de um dos fatores não funcionou conforme o esperado. Verificou-se que os participantes tenderam a endossar com maior facilidade os itens de afetos positivos, enquanto a menor média de theta foi com os afetos negativos. As implicações desses achados em relação à qualidade psicométrica do instrumento são discutidas.
Palavras-chave: Teoria de resposta ao item; Escala de bem-estar subjetivo; Precisão do teste; Validade do teste.
Developing standardized scales to assess positive psychology constructs (subjective well-being, love, hope, etc.) enriches this field of study, as researchers are provided with more alternatives to investigate constructs of interest. Although not new, the study of human virtues and strengths has stood out over the past few decades due to positive psychology. This same branch of psychology can also be credited with the development of new methods and the carrying out of a great deal of empirical research to investigate these constructs. Thus, the use of sophisticated statistical methods such as Item Response Theory (IRT) to improve scales is an important methodological development to better estimate variables of interest.
This paper reassesses the psychometric properties of a scale developed to measure subjective well-being using a different population from that investigated in the original study and a different data analysis procedure. We chose to independently apply the rating scale model to all three factors of the scale. This individual assessment of factors is justified by the fact that unidimensional IRT models (one, two, or three parameters) require unidimensionality evidence. Since subjective well-being has three independent factors, assessing each factor separately would be the most appropriate strategy. The use of these procedures is described in detail to familiarize readers with the use of item response theory in psychological tests.
Positive Psychology and subjective well-being
Psychology has historically prioritized the study of psychopathologies (Diener, 1984; 2012) and neglected researching virtues and strengths that may contribute to a healthy human growth
(Seligman & Csikszentmihalyi, 2000). When Positive Psychology first appeared in the United States, it began to enrich prior knowledge of the positive aspects of Man, without overlooking psychopathology’s relevance. This branch of Psychology, however, is not the first one to emphasize human strengths. This topic was initially extensivally addressed based on the humanist movement, and it has just recently become an object of systematic study within Positive Psychology.
One of Positive Psychology’s fields of study is Subjective Well-Being (SWB) (Diener, Lucas, & Oishi, 2001), which is characterized by an overall assessment of one’s personal level of contentment. SWB consists of a cognitive dimension (Satisfaction with Life) and an affective dimension (Positive and Negative Affect). Satisfaction with life entails the subjective perception of important aspects of one’s life. It is subjective because these aspects are individually chosen and not previously defined. Positive and Negative Affect is also subjectively construed by respondents and is characterized as the frequency and intensity of positive feelings (euphoria, courage, vitality) and negative feelings (guilt, resentment, fear). Life satisfaction, positive, and negative affect can be considered the triad of SWB. However, it must be noted that these three constructs are independent, and assessing them together may result in a considerable loss of information (Diener, 1994; Diener & Chan, 2011).
As of 2000, in Brazil, with the emergence of studies on SWB (Bardagi & Hutz, 2012; Serafini & Bandeira, 2011; Zanon, Bastianello, Pacico, & Hutz, 2013; Zanon & Hutz, 2013), researchers postulated that there was a need for developing instruments adequate for Brazilian culture (Albuquerque & Tróccoli, 2004; Zanon, Bardagi, Layous, & Hutz, in
55
PSYCHOMETRIC PROPER
TIES OF THE EBES SCALE
Subjective Well-Being Scale) – the object of the present study – was one of such instruments developed by Albuquerque and Tróccoli (2004).
Albuquerque and Tróccoli (2004) developed EBES to individually and collectively (general well-being score) assess Positive and Negative Affect and Satisfaction with Life. This scale items were specifically designed to adequately represent Brazilian culture. This scale relies on procedures such as semantic analysis and focus groups, which allow assessing whether its contents are satisfactory. In addition to new items, the authors also complemented the scale with items from other international scales, such as the Positive and Negative Affect Scale (PANAS) (Watson, Clark, & Tellegen, 1988) and the Satisfaction WITH Life Scale (SWLS) (Diener, Emmons, Larsen, & Griffin, 1985). The existence of the three expected factors (Positive and Negative Affect, and Satisfaction with Life) was verified using exploratory factorial analysis, which explained 44.1% of total variance. The authors then analyzed all scale items using IRT. This analysis was carried out with a two-parameter model that estimates levels of discrimination and difficulty. Most items in the EBES were acceptably discriminated (varying between 0.07 and 1.70). As for its difficulty, according to the study carried out by Albuquerque & Tróccoli (2004), the items measuring Positive Affect were considered
extremely easy (b < -1.28) or easy (b between -1.28
and -0.52). Items measuring negative affect were
considered extremely difficult (b > 1.28) or difficult
(b between 0.52 and 1.28). It must be noted that
the original study population was comprised of Brazilian Civil Police Department Officers. This may have influenced the resulting data, which could have differed had a different population been used.
Some studies have used EBES to assess well-being in HIV-positive mothers (Lima, Saldanha, & Oliveira, 2009), health conditions of caregivers providing care for elderly family members with Alzheimer’s disease (Lenardt, Willig, Seima, & Pereira, 2011), and level of marriage satisfaction in couples (Scorsolini-Comin & Santos, 2011; 2012). Although these studies indicate that this Scale is able
to properly assess its respondents, we believe that additional validity evidence is needed to confirm adequacy of its partial or full use In other words, it appears that it may be appropriate to use IRT – established parameters to independently assess satisfaction with life and Positive and Negative Affect since they are different constructs although they were collectively estimated by Albuquerque and Tróccoli (2004), who treated them as a single construct. Considering the aforementioned, the aim of the present study is to independently analyze the three factors of this Scale using IRT and provide specific parameters to interpret each factor.
Since it is believed that this mathematical model can be used to assess subjective well-being, this study also aims to verify EBES item and subject parameters obtained using a rating scale model (Embretson & Reise, 2000; Linacre, 2005; Wright & Masters, 1982). This allowed gathering validity evidence based on internal structure and reliability coefficients analyzed through internal consistency. The instrument factors’ dimensions were investigated, response categories in their respective scales were analyzed, test items and study participants’ parameters were estimated and arranged in graphs, parameter adjustment was compared against values estimated by the mathematical model; reliability and precision indices were also estimated. An explanation for the adopted procedures is conveniently provided throughout this paper.
Method
Participants
A database of 182 EBES respondents was used. Participants were aged between 18 and 57
years old (Mean - M = 24.6; Standard Deviation - SD
= 7.85), 77 of which were male (42.3%) and 105 were female (57.5%). All population subjects were college students from various private universities in
56
L.F
.
CAR
V
ALHO
et al.
Instruments
The Escala de Bem-Estar Subjetivo was used to assess Subjective Well-Being (SWB), (Albuquerque & Tróccoli, 2004). As previously discussed, this Scale is a self-report inventory that measures three subjective well-being components, namely: Positive and Negative Affect and Satisfaction with Life. This instrument consists of 69 items. The first 47 items measure Positive and Negative Affect which are evaluated using a 5-point Likert scale ranging from ‘Not at all’ to ‘To a great extent’. The last 22 items measure satisfaction (or dissatisfaction) with life and are evaluated using a 5-point Likert scale ranging from ‘Strongly disagree’ to ‘Strongly agree’. Estimated time for completion of the EBES is 10 minutes.
Procedures
This study project was approved by the
Institutional Review Board of the Universidade
São Francisco. This study received the local Ethics Committee’s approval, according to the following Protocol nº C.A.A.E. 0350.0.142.000-08. Participants agreed to enroll in this research database by signing an Informed Consent Form. Data were collected on the participants in their university classrooms. The instrument was collectively administered. After structuring all data into a single database, data was analyzed with the Rach’s model – a rating scale model – using Winsteps (Linacre, 2009), a statistical analysis software, to verify the item and respondent parameters.
It is worth noting that one of the basic assumptions when applying IRT modeling is unidimensionality, i.e., a model must assume that all items are related to a main dimension and that secondary dimensions have negligible influence (Hambleton & Swaminatham, 1985). Verifying EBES unidimensionality was the first step before carrying out the other analyses discussed in this study (in this case, using the Statistical Package for the Social Sciences [SPSS Inc., Chicago, Illinois, United States]). Thus, Eigenvalues derived from the exploratory factor analysis using the instrument
factors and the Cronbach’s alpha reliability index (internal consistency) were verified. The criteria used for considering a factor to be unidimensional was the first factor in the exploratory factorial analysis (by EBES dimension) with an Eigenvalue of at least four times larger than the second factor’s Eigenvalue (Hattie, 1985; Morizot, Ainsworth, & Reise, 2007) and Cronbach’s alpha should be equal to or greater than 0.80 (Prieto & Muniz, 2000).
Winsteps was then used to calibrate item parameters (characteristics) with the joint maximum likelihood estimation method. To analyze model adjustment, infit and outfit adjustment indices were taken into consideration. These indices consist of standardized and squared average residual values (observed/modeled score), i.e., Chi-squared values divided by degrees of freedom. Following literature recommendations, values above 1.3 and item/total correlations close to zero were considered a red flag for lack of adjustment to the model (Linacre, 2009; Smith, 1996). Reliability, local precision, and scale response category indices were also considered. Due to the model chosen, the software used required the setting of the initial metrics. The average (b) item difficulty was fixed to zero, which is a standard procedure (Linacre, 2009). In numerical terms, the average item difficulty for all analyzed dimensions will always be zero. This will probably affect the average value of theta of the participants.
Results and Discussion
57
PSYCHOMETRIC PROPER
TIES OF THE EBES SCALE
Negative Affect and Satisfaction with Life should be assessed separately because: (a) they are distinct constructs (Diener, 1994; Diener & Chan, 2011); and (b) there is no evidence of unidimensionality of the item set encompassing all three constructs.
This assumption of Scale unidimensionality was initially checked by analyzing the Eingenvalues from the exploratory factor analysis. Since no predominant factor could be found in the total dataset – given that the first Eigenvalue was found to be at least five times greater than the second one –, independent factorial analyses were applied to each factor, Positive Affect (PA), Negative Affect (NA), and Satisfaction with Life (SL). In all cases, the Eigenvalue of the first factor was equal to or five times larger than that of the second factor:
PAEigenvalue = 10.33 (versus 1.69), NAEigenvalue = 11.64
(versus 1.82), and SLEigenvalue = 6.89 (versus 1.16).
The individual alpha coefficients of the EBES factors were considered high and acceptable for
Figure 1. Response categories of EBES dimensions
Note: EBES: Escala de Bem-Estar Subjetivo (Subjective Well-Being Scale).
appropriately measuring its variables. Coefficients of 0.90 (Satisfaction with Life), 0.94 (Positive Affect and Negative Affect independently) were found, which indicates that the items in each dimension are strongly correlated, and it may also indicate unidimensionality. This suggests that the proposal by Diener (1994) and Diener and Chan (2011) that assessing constructs independently seems to be in line with the data obtained from the EBES analysis.
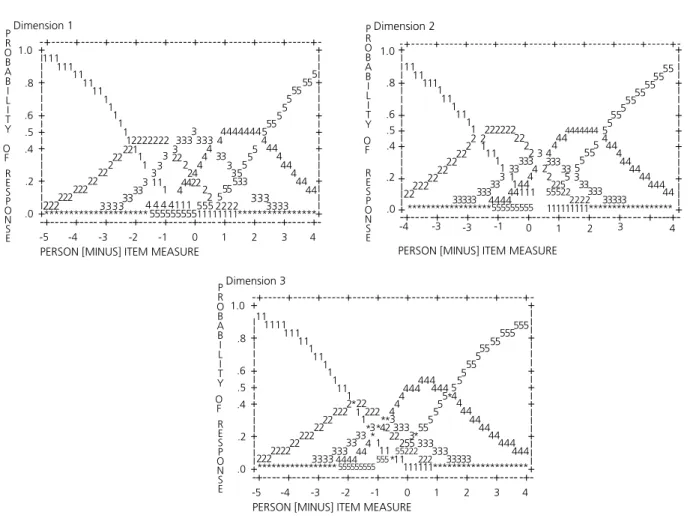
After verifying unidimensionality for Positive Affect, Negative Affect, and Satisfaction with Life, the next step was to verify adequacy of each of EBES factor response categories. Response category analysis allowed us to observe whether the categories in the proposed Likert scale were minimally acceptable. Figure 1 provides a graphic representation of the data from the EBES factor response categories.
Figure 1 illustrates item response categories for each of the three EBES factors. The X-axis
P R O B A B I L I T Y O F R E S P O N S E Dimension 1 1.0 .8 .6 .5 .4 .0 .2 -+---+---+---+---+---+---+---+---+---+-+ + + + + + + + + + + + + + + + + -+ + + + + + +
PERSON [MINUS] ITEM MEASURE
-5 -4 -3 -2 -1 0 1 2 3 4
111 111 11 11 11 1 1 1 1 1
12222222 333 3333 3 3 3 3 3 33 33 3333 33 333 3333 221 22 222 22 222 222 222 1 1 11 1 22 2 24 4422 4 44 44 4444444
4 4 4 4
555555555111 555 2222 2 2 3 555 35 533 55 5 555 55 555 555 4 44 4 44 4 44 44 11111111 ********************* **************** P R O B A B I L I T Y O F R E S P O N S E Dimension 2 -+---+---+---+---+---+---+---+---+---+-+ + + + + + + + + + + + + + + + + -+ + + + + + + 1.0 .8 .6 .5 .4 .0 .2 11 11 111 11 1 1 1 1 11 222222 2 2 22 22 22 22 22222 2 1 11 1 1 33333333 333 33333 3 333 33 3 33 333 33333 22 2 2 1 144 444444111 44 44 444444444 2 2 225 55522 2222
******************555555555 111111111****************** 44 4 4 44 44 44 444 44 5 5 555 5 55 55 5555 55 5 5555
PERSON [MINUS] ITEM MEASURE
-4 -3 -3 -1 0 1 2 3 4
P R O B A B I L I T Y O F R E S P O N S E Dimension 3 1.0 .8 .6 .5 .4 .0 .2 -+---+---+---+---+---+---+---+---+---+-+ + + + + + + + + + + + + + + + + -+ + + + + + +
PERSON [MINUS] ITEM MEASURE
-5 -4 -3 -2 -1 0 1 2 3 4
11 1111 11 11 111 1 1 1 11 1 1 2222222 22222 2222 2222122222
58
L.F
.
CAR
V
ALHO
et al.
represents a theta scale (level of respondents on the latent trait) and the Y-axis represents participant response probability on different theta levels (the average of b values is centered at zero in this graph). This figure also shows the probability of selection of the participants in each of the response categories
and their distribution on different levels of theta
for an item bi = 0 (average difficulty level equal
to zero). An intersection of two categories can be construed as the transition threshold between these categories. Of all factors of the instrument, a curve intersection was observed only with the SL factor. Thus, response category three is not represented in any region of the theta scale (horizontal axis), where it would be more likely to be found. This finding may indicate that participants did not properly use the Likert scale to rate the item set related to satisfaction with life, as there is no clear difference between category three and the other categories (namely, two and four). Another possible interpretation is that it is due to the small number of participants that selected category three. However, there was a reasonable number of subjects (n=38), and only category five was selected by less than 10
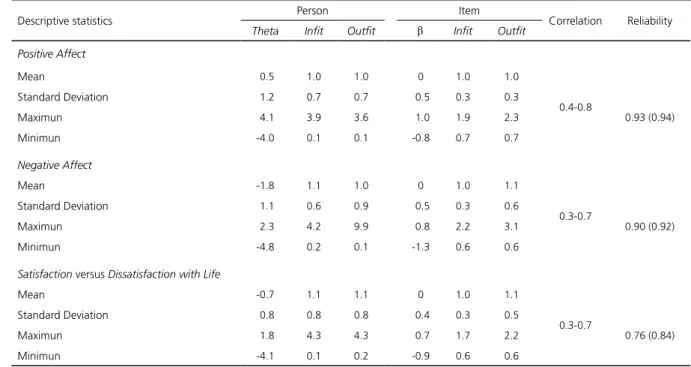
Descriptive statistics Person Item Correlation Reliability
Theta Infit Outfit β Infit Outfit
Positive Affect
Mean -0.5 1.0 1.0 0 1.0 1.0
0.4-0.8
Standard Deviation -1.2 0.7 0.7 -0.5 0.3 0.3
Maximun -4.1 3.9 3.6 -1.0 1.9 2.3 0.93 (0.94)
Minimun -4.0 0.1 0.1 -0.8 0.7 0.7
Negative Affect
Mean -1.8 1.1 1.0 0 1.0 1.1
0.3-0.7
Standard Deviation -1.1 0.6 0.9 -0.5 0.3 0.6
Maximun -2.3 4.2 9.9 -0.8 2.2 3.1 0.90 (0.92)
Minimun -4.8 0.2 0.1 -1.3 0.6 0.6
Satisfaction versus Dissatisfaction with Life
Mean -0.7 1.1 1.1 0 1.0 1.1
0.3-0.7
Standard Deviation -0.8 0.8 0.8 -0.4 0.3 0.5
Maximun -1.8 4.3 4.3 -0.7 1.7 2.2 0.76 (0.84)
Minimun -4.1 0.1 0.2 -0.9 0.6 0.6
Table 1
Descriptive statistics for persons and items
subjects. Adequacy of this factor’s categories should be further explored in future studies.
In addition to the response category visual analysis, it is also worth investigating whether there is an evident progression in the theta scale on the moving from one response category to another one. An evident progression of theta levels was observed with an increase in the Likert scale for EBES’ NA
and (mainly) PA factors. However, the SL theta
average values for the moving between categories 2–3 and 3–4 are very close (-0.35 and -0.38, respectively), indicating that there is no difference between categories 3 and 4 in this dimension. These data further confirm the assumption that there is a difference in the assessment of these three constructs.
59
PSYCHOMETRIC PROPER
TIES OF THE EBES SCALE
Overall, the scales’ latent trait average level
( ) indicates a population tendency not to select certain items, given that only the Positive Affect factor had a positive average theta value.
Negative Affect showed the lowest average theta
value (-1.8), indicating that its items were the least selected by participants. In other words, these results indicate that item content may have been deemed less appealing or acceptable by the assessed population, especially regarding negative affect and satisfaction with life. On the other hand, it is possible that this item set is more acceptable by a clinical population since in this item set lower levels of well-being than those of this study population.
Although the participants showed a low average latent trait level, scoring variability was observed in all scales. This suggests that the population consists of people with different levels
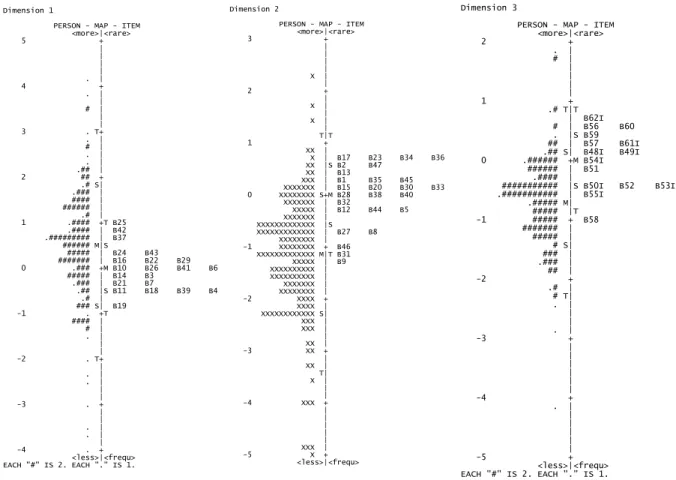
Figure 2. Item map of EBES dimensions
Note: EBES: Escala de Bem-Estar Subjetivo (Subjective Well-Being Scale).
( )
=−0.66∑
Xθof certain subjective well-being characteristics. To support this statement, it was assumed that both moderate and high scores indicate these subjects’ level of psychological functioning in subjective well-being. In Figure 2, item maps are presented as a visual aid for better understanding the data in Table 1.
In each of the item maps, subjects are distributed on the left side of a line defining the construct for each EBES factor, and the items are distributed on the right side of that same line. The greater the number of subjects or items on the vertical line, the higher the intensity in latent construct and vice-versa. We can than conclude that there is less discrepancy between the items and subjects in EBES Positive Affect and more evident discrepancies between the other two factors. Average values for subjects and items are shown in the map with the letter A. Moreover, since all three factors represent subjective well-being, future
Dimension 1
PERSON - MAP - ITEM <more>|<rare> 5 + | | | | . | 4 + . | | # | | |
3 . T+
. | # | . | . | .## |
2 ## +
.# S| .### | #### | ###### | .# | 1 .#### +T B25
.#### | B42 .######### | B37
###### M|S
##### | B24 B43 ####### | B16 B22 B29 0 .### +M B10 B26 B41 B6
##### | B14 B3 .### | B21 B7
.## |S B11 B18 B39 B4 .# |
### S| B19
-1 . +T
#### | # | . | | |
-2 . T+
| . | . | | |
-3 . +
| | . | . | |
-4 . +
<less>|<frequ> EACH "#" IS 2. EACH "." IS 1.
Dimension 2
PERSON - MAP - ITEM <more>|<rare> 3 + | | | | X | | 2 + | X | | X | | T|T 1 + XX |
X | B17 B23 B34 B36 XX |S B2 B47
XX | B13
XXX | B1 B35 B45 XXXXXXX | B15 B20 B30 B33 0 XXXXXXXX S+M B28 B38 B40
XXXXXXX | B32
XXXXX | B12 B44 B5 XXXXXXX |
XXXXXXXXXXXXX |S XXXXXXXXXXXXX | B27 B8
XXXXXXXX | -1 XXXXXXXX + B46
XXXXXXXXXXXXX M|T B31 XXXXX | B9 XXXXXXXXXX | XXXXXXXXXX | XXXXXXX | XXXXXXXX |
-2 XXXX +
XXXX | XXXXXXXXXXXX S| XXX | XXX | | XX |
-3 XX +
| XX | T| X | | |
-4 XXX +
| | | | | XXX |
-5 X +
<less>|<frequ>
Dimension 3
PERSON - MAP - ITEM <more>|<rare> 2 + . | # | | | | | 1 + .# T|T | B62I # | B56 B60 . |S B59 ## | B57 B61I .## S| B48I B49I 0 .###### +M B54I
###### | B51 .#### |
########### |S B50I B52 B53I .########### | B55I
.##### M| ##### |T -1 ##### + B58
60
L.F
.
CAR
V
ALHO
et al.
instrument revisions should be aimed at developing less intense construct items in order for lower levels to be also contemplated, as they are currently less contemplated by the existing items.
Based on the infit and outfit adjustment indices, there were discrepancies between the expected and observed respondent theta values. These values tended to be acceptable (Linacre, 2009) since their average value was lower than 1.3 in all scales. However, maximum adjustment index values greater than 1.3 were observed for a few subjects, suggesting that the discrepancies are greater than those estimated by the model. The reliability index of theta estimates calculated by the Rasch model varied from 0.76 to 0.93 (real)
and 0.84 to 0.94 (modeled). These indices may be considered satisfactory (Embretson & Reise, 2000). The weighing of these discrepancies can be done by error calculation or local precision (Figure 3).
One of the advantages of using IRT is the ability to identify the precision of a given scale, to identify the scale region with the greatest precision. This can be accomplished by an information curve showing the level of precison according to the theta levels. One way to represent this curve on a scale from zero to one is through local precision (Daniel, 1999).
The reliability index allows verifying the theta levels (latent trait) that have the largest number of
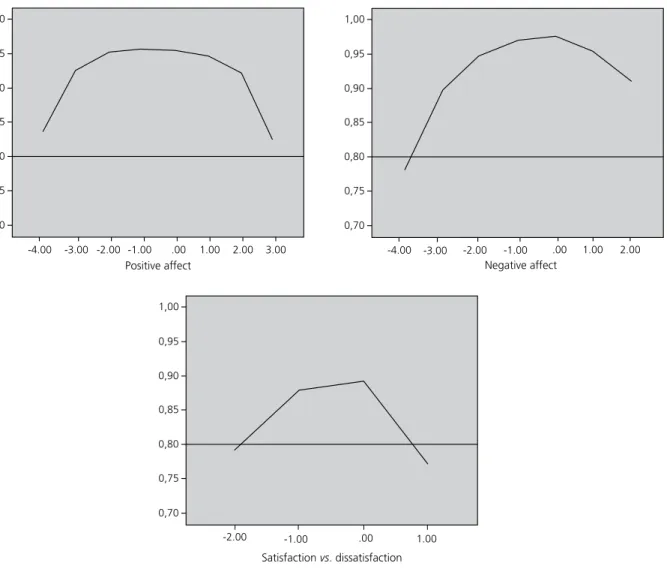
Figure 3. Local reliability of EBES dimensions
Note: EBES: Escala de Bem-Estar Subjetivo (Subjective Well-Being Scale).
1,00
0,95
0,90
0,85
0,80
0,75
0,70
-4.00 -3.00 -2.00 -1.00 .00 1.00 2.00 3.00
Positive affect
1,00
0,95
0,90
0,85
0,80
0,75
0,70
-4.00 -3.00 -2.00 -1.00 .00 1.00 2.00
Negative affect
1,00
0,95
0,90
0,85
0,80
0,75
0,70
-2.00 -1.00 .00 1.00
61
PSYCHOMETRIC PROPER
TIES OF THE EBES SCALE
items (factors) that are free of measurement error, the most reliable factors. A moderately reliable factor can be highly reliable in a certain group of latent traits but not very reliable in another given group.
In Figure 3, the horizontal X-axis represents theta, and the vertical Y-axis represents the reliability index. The horizontal line cutting through the graph divides the curve into reliability indices equal to or greater than 0.80 and lower reliability indexes. This provides an illustration of the theta groups that have the most reliable EBES factors individually. The Figure also shows that all dimensions had at least three logits with reliability equal to or greater
than 0.80. In addition, the first factor (X = 0.94)
includes a larger group of high reliability levels, the
third one ( X = 0.86) includes a smaller group, and
the second one (X = 0.94) lies between the other
two. This graph supports the data in Figure 3, in which the factors with the highest reliability indices in terms of variation and average were Positive Affect and Negative Affect; the third factor showed a slightly lower index. In all cases, considering the theta levels to verify reliability allowed determining the levels of latent construct of EBES in which the evaluation would be more adequate (Daniel, 1999).
This study presents the application of an Item Response Theory (IRT) rating scale model to a subjective well-being scale. The three dimensions that constitute this scale were individually analyzed. This method was shown to be more adequate to the study population and to the issue of unidimensionality. Since these constructs are theoretically independent, verifying that the scale consists of three main dimensions supports international literature findings. The resulting data are evidence of validity and reliability of the EBES, which has been proven to adequately and independently assess Positive and Negative Affect and Satisfaction with Life. Such evidence supports an assumption that differs from the one adopted by the authors (Albuquerque & Tróccoli, 2004) of the original version of this instrument – namely a total subjective well-being score, instead of an independent assessment of its three different
constructs. This paper thus contributes to literature by providing an alternative interpretation of EBES whose score informational quality can be further verified in future studies and in contexts of professional practice.
It is worth noting that these data suggest a need for revising the EBES items and/or including more moderate and more difficult items, according to the latent construct to be measured. It seems that the current structure of this instrument comprises only its constructs’ highest levels, which may be detrimental to its discrimination capacity. Future studies should investigate this issue further.
Additionally, different difficulty levels dependent on the investigated item set were observed. In other words, the EBES factors seem to differ in terms of latent construct level to be measured. Regardless of the differences in the quality among the three factors of the instrument, this quantitative difference may have a significant impact in terms of item selection, as shown in the present study. These findings must be considered in future EBES revisions.
This study shows a significant limitation in terms of the population studied. The sample does not reflect the overall Brazilian population. Due to this limitation, the research findings must be carefully construed when used in the analysis of different population samples. This study could also have used other scales and other associated variables, such as self-esteem, optimism, and hope to assess the three constructs in question. Correlations between these elements could provide other types of EBES construct validity evidence.
62
L.F
.
CAR
V
ALHO
et al.
Contributors
All authors contributed equally to the conception and design of this study, data analysis, manuscript writing, and final revision.
References
Albuquerque, A. S., & Tróccoli, B. T. (2004). Desen-volvimento de uma escala de bem-estar subjetivo.
Psicologia: Teoria e Pesquisa, 20(2), 153-164.
Bardagi, M. P., & Hutz, C. S. (2012). Mercado de trabalho, desempenho acadêmico e o impacto sobre a satisfação
universitária. Revista de Ciências Humanas, 46(1),
183-198.
Daniel, M. H. (1999). Behind the scenes: using new measurement methods on the DAS and KAIT. In S. E.
Embretson & S. L. Hershberger (Eds.), The new rules of
measurement: What every psychologist and educator should know. Mahwah, NJ: Lawrence Erlbaum.
Diener, E. (1984). Subjective well-being. Psychological
Bulletin, 95(3), 542-575. https://www.doi.org/10.10 37/0033-2909.95.3.542
Diener, E. (1994). Assessing subjective well-being:
Progress and opportunities. Social Indicators Research,
31(2), 103-157. https://www.doi.org/10.1007/BF0
1207052
Diener, E. (2012). New findings and future directions for
subjective well-being research. American Psychologist,
67(8), 590-597. https://www.doi.org/10.1037/a00
29541.
Diener, E., & Chan, M. Y. (2011). Happy people live longer: Subjective well-being contributes to health and
longevity. Applied Psychology: Health and Well-Being,
3(1), 1-43. https://www.doi.org/10.1111/j.1758-08
54.2010.01045.x
Diener, E., Emmons, R. A., Larsen, R. J., & Griffin, S.
(1985). The Satisfaction with Life Scale. Journal of
Personality Assessment, 49(1), 71-75. https://www. doi.org/10.1207/s15327752jpa4901_13
Diener, E., Lucas, R., & Oishi, S. (2001). Subjective well-being: The science of happiness and life satisfaction.
In C. R. Snyder & S. J. Lopez (Eds.), The handbook of
positive psychology. New York: Oxford University Press.
Embretson S. E., & Reise, S. P. (2000). Item response
theory for psychologists. Mahwah: Lawrence Erlbaum.
Hambleton, H. K., & Swaminatham, H. (1985). Item
response theory: Principles and applications. Boston: Kluwer.
Hattie, J. (1985). Methodology review: Assessing
unidimensionality of tests and items. Applied Psychological
Measurement, 9(2), 139-164.
Lenardt, M. H., Willig, M. H., Seima, M. D., & Pereira, L. F. (2011). A condição de saúde e satisfação com a vida do cuidador familiar de idoso com Alzheimer.
Colombia Médica, 42(1), 17-21.
Lima, F. L. A., Saldanha, A. A. W., & Oliveira, J. S. C. (2009). Bem-estar subjetivo em mães de crianças
sorointerrogativas para o HIV/AIDS. Psicologia em
Revista, 15(1), 141-157. https://www.doi.org/10. 5752/P.1678-9523.2009V15N1P141
Linacre, J. M. (2005). The Partial Credit Model and the
One-Item Rating Scale Model. Rasch Measurement
Transactions, 19(1), 1000-1002.
Linacre, J. M. (2009). WINSTEPS: Multiple-choice, rating
scale, and partial credit Rasch analysis. Chicago, Ill: MESA Press.
Morizot, J., Ainsworth, A. T., & Reise, S. P. (2007). Toward modern psychometrics: Application of item response theory models in personality research. In
R. W. Robins, R. C. Fraley & R. F. Krueger, Handbook
or research methods in personality psychology. Nova Iorque: Guilford.
Prieto, G., & Muñiz, J. (2000). Un modelo para evaluar la
calidad de los tests utilizados en España. Papeles del
Psicólogo, 77, 65-71.
Scorsolini-Comin, F., & Santos, M. A. (2011). Relações entre bem-estar subjetivo e satisfação conjugal
na abordagem da Psicologia Positiva. Psicologia:
Reflexão e Crítica, 24(4), 658-665. https://www.doi. org/10.1590/S0102-79722011000400005
Scorsolini-Comin, F., & Santos, M. A. (2012). A medida positiva dos afetos: bem-estar subjetivo em pessoas
casadas. Psicologia: Reflexão e Crítica, 25(1), 11-20.
https://www.doi.org/10.1590/S0102-79722012000 100003
Seligman, M. E. P., & Csikszentmihalyi, M. (2000). Positive
psychology: An introduction. American Psychologist,
55(1), 5-14.
Serafini, A. J., & Bandeira, D. R. (2011). A influência da rede de relações, do coping e do neuroticismo na
satisfação de vida de jovens estudantes. Estudos de
Psicologia (Campinas), 28(1), 15-25. http://dx.doi. org/10.1590/S0103-166x2011000100002
Smith R. M. (1996). Polytomous Mean-Square Fit
Statistics. Rasch Measurement Transactions, 10(3),
516-517.
Watson, D., Clark, L. A., & Tellegen, A. (1988). Development and validation of brief measures of positive and negative affect: The PANAS scales.
Journal of Personality and Social Psychology, 54(6), 1063-1070.
Wright, B. D., & Masters, G. N. (1982). Rating scale
analysis. Chicago: MESA.
63
PSYCHOMETRIC PROPER
TIES OF THE EBES SCALE
Universitas Psychologica, 12(2), 403-411. https:// www.doi.org/10.11144/Javeriana.UPSY12-2.adts
Zanon, C., Bardagi, M. P., Layous, K., & Hutz, C. S. (in press). Validation of the Satisfaction with Life Scale to Brazilians: Evidences of Measurement Noninvariance
Across Brazil and US. Social Indicators Research,
119(1), 443-453.
Zanon, C., Bastianello, M, R., Pacico, J. C., & Hutz, C. S. (2013). Desenvolvimento e validação de uma escala
de afetos positivos e negativos. Psico-USF, 18(2),
193-201.