PROGRAMA DE PÓS-GRADUAÇÃO EM ZOOLOGIA
UNIVERSIDADE FEDERAL DO PARÁ MUSEU PARAENSE EMÍLIO GOELDI
NARAIANA LOUREIRO BENONE
Heterogeneidade ambiental e diversidade de peixes de riachos na Amazônia
NARAIANA LOUREIRO BENONE
Heterogeneidade ambiental e diversidade de peixes de riachos na Amazônia
Tese apresentada ao Programa de Pós-graduação em Zoologia, do convênio da Universidade Federal do Pará e Museu Paraense Emílio Goeldi, como requisito parcial para obtenção do título de Doutor em Zoologia. Área de concentração: Biodiversidade e conservação Linha de pesquisa: Ecologia animal
Orientadora: Profª. Drª. Maria Cristina Esposito Co-orientador: Prof. Dr. Luciano F. de A. Montag
Dados Internacionais de Catalogação na Publicação (CIP) Sistema de Bibliotecas da Universidade Federal do Pará
Gerada automaticamente pelo módulo Ficat, mediante os dados fornecidos pelo(a) autor(a)
B473h Benone, Naraiana Loureiro
Heterogeneidade ambiental e diversidade de peixes de riachos na Amazônia / Naraiana Loureiro Benone. - 2017.
182 f. : il. color.
Tese (Doutorado) - Programa de Pós-graduação em Zoologia (PPGZOOL), Instituto de Ciências Biológicas, Universidade Federal do Pará, Belém, 2017.
Orientação: Profa. Dra. Maria Cristina Esposito
Coorientação: Prof. Dr. Luciano Fogaça de Assis Montag.
1. Partição de variância. 2. Modelos hierárquicos. 3. Dispersão limitada. 4. Diversidade funcional. 5. Distinção taxonômica. I. Esposito, Maria Cristina, orient. II. Título
FOLHA DE APROVAÇÃO
NARAIANA LOUREIRO BENONE
Heterogeneidade ambiental e diversidade de peixes de riachos na Amazônia
Tese apresentada ao Programa de Pós-graduação em Zoologia, do convênio da
Universidade Federal do Pará e Museu Paraense Emílio Goeldi, como requisito parcial
para obtenção do título de Doutor em Zoologia, sendo a COMISSÃO JULGADORA
composta pelos seguintes membros:
Prof. Dra. MARIA CRISTINA ESPOSITO
Universidade Federal do Pará (Presidente) Prof. Dr. FABRICIO BARRETO TERESA
Universidade Estadual de Goiás Prof. Dr. JANI HEINO Finnish Environment Institute Prof. Dr. KIRK WINEMILLER
Texas A&M University Prof. Dra. LILIAN CASATTI
Universidade Estadual Paulista Júlio de Mesquita Filho Prof. Dra.
MARIA APARECIDA LOPES
Universidade Federal do Pará
Prof. Dr. RAFAEL PEREIRA LEITÃO Universidade Federal de Minas Gerais Prof. Dr. ROGÉRIO ROSA DA SILVA
In all things of nature there is something of the marvelous
AGRADECIMENTOS
Gostaria de agradecer às seguintes pessoas e instituições:
À minha orientadora, Drª. Maria Cristina Esposito, pela orientação e por todo apoio durante o período de doutorado;
Ao meu co-orientador, Dr. Luciano Montag, pela orientação e amizade ao longo desses sete anos de parceria;
Aos pesquisadores Drª. Cecília Leal, Drª. Cristiane Ferreira, Dr. Leandro Juen, Dr. Paulo Pompeu, Dr. Raphael Ligeiro e Dr. Rogério Rosa pelas excelentes contribuições aos manuscritos e por todos os conselhos;
Aos meus amigos do Laboratório de Ecologia e Conservação por todo o apoio no campo e no laboratório. Nossas discussões foram fundamentais para o desenvolvimento deste trabalho, e as ótimas conversas sempre tornaram tudo muito mais divertido: Ana Luiza Andrade, Bruno Prudente, Dani Ribeiro, Facundo Alvarez, Gilberto Salvador, Híngara Leão, José Max Barbosa, Karina Dias, Leandro Brasil, Maíra Cardoso, Maria José Anacleto, Renata Frederico, Sara Almeida, Thiago Barbosa, Thiely Garcia, Tiago Begot e Yulie Shimano;
À Evelyn Nunes e Lidia Brasil, que foram fundamentais em tantas etapas desta tese; À Luciana Lameira, pela ajuda essencial ao longo da tese e pela amizade;
Aos queridos membros do Shoshana, por todas as conversas loucas e por toda a parceria: Bruno Eleres, Cléo Lobato, Dani Torres, Danny Raiol e Thiago Mendes;
Aos pesquisadores Dr. André Ferreira, Dr. Guilherme Dutra, M.Sc. Luiz Peixoto e Dra. Marina
Mendonça pelas identificações das espécies de peixes;
Ao Conselho Nacional de Pesquisa e Desenvolvimento (CNPq) pela concessão da bolsa;
À CAPES, pela oportunidade de realizar estágio na Universidade Federal de Goiás através do Programa Nacional de Cooperação Acadêmica (PROCAD), e aos pesquisadores Dr Marcus V. Cianciaruso e Dr Paulo de Marco Jr, por terem sido tão receptivos e solícitos durante esse período; À minha família, por todo o apoio incondicional;
Ao Douglas de Oliveira, por todo o amor e paciência;
SUMÁRIO
ABSTRACT ... 11
RESUMO ... 12
INTRODUÇÃO GERAL ... 13
REFERÊNCIAS BIBLIOGRÁFICAS ... 27
Capítulo 1 ... 33
SUPPLEMENTARY MATERIAL ... 56
Capítulo 2 ... 89
SUPPORTING INFORMATION ... 113
Capítulo 3 ... 130
SUPPORTING INFORMATION ... 149
CONCLUSÕES GERAIS ... 159
ANEXO 1 ... 160
ANEXO 2 ... 165
Environmental heterogeneity and fish diversity of Amazon streams
ABSTRACT
Amazon streams are highly heterogeneous systems that encompass a remarkable diversity. Due to the increasing threats to these systems, it is necessary to understand how ecological process in natural areas affect streams and their fish biota. This thesis was divided in three chapters and aims to answer the following questions: 1) How much do catchment variables affect the physical habitat of small streams in the Amazon? 2) What is the relative contribution of environmental and spatial variables on taxonomic and functional alpha and beta diversity of stream fish? 3) How much are distinct components of biodiversity (species diversity, taxonomic distinctness, and functional diversity) congruent and how much can they be predicted from catchment variables? Fifty seven streams were sampled across six river basins in the Amazon region. For environmental characterization, a standardized protocol was used to obtain more than 140 local variables, and 11 catchment variables were obtained from aerial images. Fish assemblages were sampled with hand nets during a six-hour period. Stream catchments were divided in two groups based on altitude and slope. These two variables influenced streams habitats, regulating flow velocity and the types and proportions of substrates. The taxonomic and functional patterns of fish assemblages were affected by environmental filters operating at the catchment scale. Nonetheless, variables at the local scale were particularly important to taxonomic and functional alpha diversity. Despite the significant role of environmental filters, limited dispersal was the main driver of variation in fish diversity, indicating a strong biogeographic factor. Finally, various components of diversity exhibited intermediate congruence, which suggests that no single component can describe patterns of fish diversity. In addition, catchment variables alone could not accurately predict diversity patterns, and therefore it is recommended that additional explanatory variables, including descriptors of local environmental conditions, are important to include in studies of stream fish diversity.
Heterogeneidade ambiental e diversidade de peixes de riachos na Amazônia
RESUMO
Os riachos amazônicos são sistemas altamente heterogêneos e que abrigam uma enorme biodiversidade. Devido às crescentes ameaças a esses sistemas, aumenta-se a necessidade de entender como processos ecológicos em áreas naturais afetam os riachos e suas assembleias de peixes. Esta tese foi dividida em três capítulos e busca responder as seguintes questões: 1) O quanto das variáveis em escala de bacia regulam o hábitat físico de riachos amazônicos? 2) Qual a contribuição relativa do ambiente e do espaço sobre a diversidade alfa e beta, tanto taxonômica quanto funcional, de peixes de riachos? 3) O quanto diferentes componentes da biodiversidade (diversidade de espécies, distinção taxonômica e diversidade funcional) são congruentes e o quanto eles podem ser preditos a partir de variáveis em escala de bacia? Para responder estas questões, foram amostrados 57 riachos em seis bacias da região amazônica. Para a caracterização ambiental, foi aplicado um extenso protocolo padronizado, que gerou mais de 140 métricas locais, além da utilização de 11 variáveis em escala de bacia. As assembleias de peixes foram coletadas com redes de mão durante seis horas. Com os resultados, detectou-se que as bacias podem ser divididas em dois grupos a partir da altitude e declividade. Estas duas variáveis influenciaram os hábitats dos riachos, controlando a velocidade do fluxo e o tipo e proporção de substrato. Este controle foi fundamental para os padrões taxonômicos e funcionais das assembleias de peixes, que são afetadas pelo filtro ambiental na escala da bacia. Entretanto, variáveis locais foram particularmente importantes para a diversidade alfa, tanto taxonômica quanto funcional das espécies. Apesar do papel significativo dos filtros ambientais, a dispersão limitada foi o principal fator responsável por mudanças em todos os níveis de diversidade de peixes, o que indica um forte fator biogeográfico. Por fim, os diferentes componentes da diversidade exibiram congruência intermediária, o que demonstra que eles são complementares e que não é possível resumir a diversidade de peixes a um único componente. Além disso, as variáveis na escala de bacia mostraram capacidade intermediária de prever padrões de diversidade, sendo recomendável utilizar outras métricas preditoras, como variáveis locais, em estudos de diversidade de peixes.
INTRODUÇÃO GERAL
INTRODUÇÃO
A Bacia Amazônica é a maior bacia hidrográfica do mundo, drenando uma área de mais de seis milhões de Km² (Barthem et al. 2004). A mesma é formada por inúmeros corpos d’água de tamanhos variados, com destaque para os ambientes lóticos (rios e riachos). Essa bacia abriga a maior diversidade de peixes de água doce do mundo, com aproximadamente 2.000 espécies conhecidas e com estimativas de mais 1.000 espécies a serem descritas (Lundberg et al. 2010). Apesar da grande importância e diversidade da Bacia Amazônica, a maioria dos estudos ainda foca nos grandes rios e dá pouca ênfase aos riachos, que formam a maior parte das redes hidrográficas (Junk et al. 2007). Estes são fundamentais para a heterogeneidade da paisagem e para a manutenção da biota, pois são uma importante fonte de água para organismos terrestres (Meyer et al. 2007) e sustentam aproximadamente metade das espécies conhecidas de peixes na Amazônia (Junk et al. 2007).
Uma das razões por trás da grande diversidade encontrada nos riachos é sua alta heterogeneidade ambiental, e esta deriva de mudanças na paisagem. Características do hábitat, como tipo e proporção de substratos, morfologia do canal e velocidade da água, são diretamente reguladas por variáveis na escala de bacia, tais como a declividade, altitude e uso de solo (Leal et al. 2016; Snelder and Biggs 2002). Esta dependência entre escalas levou Hynes (1975) a declarar que “o vale controla o riacho”, o que levou pesquisadores a formular diversos modelos hierárquicos (p.ex. Frissell et al. 1986; Snelder and Biggs 2002) buscando interpretar a variabilidade natural dos riachos no contexto da bacia de drenagem. Em ambientes bem preservados, determinar a extensão em que variáveis em escala de bacia controlam fatores em escala local é útil para fins conservacionistas, pois pode fornecer informações importantes sobre as condições de referência de riachos (Stoddard et al. 2006; Thieme et al. 2007). Entretanto, os riachos amazônicos ainda carecem desse tipo de informação (Thieme et al. 2007). Com as crescentes ameaças à biodiversidade e aos ambientes naturais, é fundamental caracterizar os fatores envolvidos no controle da variabilidade natural dos riachos. A Amazônia, região que ainda mantém áreas extensamente conservadas, apresenta condições ideais para uma avaliação detalhada da heterogeneidade ambiental dos riachos e de seus efeitos na diversidade aquática, fornecendo informações essenciais para estratégias de conservação (Castello et al. 2013; Portocarrero-Aya and Cowx 2016).
profundidade do canal, cobertura vegetal e substrato (Leitão et al. 2017; Mendonça et al. 2005; Pease et al. 2011). Porém, variáveis como o clima e a geologia são encarregados por formar as principais feições dentro das bacias, podendo ser as principais responsáveis por dissimilaridades nas assembleias de peixe ao se comparar diferentes redes de drenagem (Hoeinghaus et al. 2007; Paller et al. 2016). Além disso, a inclusão de variáveis espaciais pode fornecer pistas adicionais sobre os processos que controlam as assembleias aquáticas. A autocorrelação espacial de variáveis ambientais faz com que riachos mais próximos sejam mais similares em seus fatores abióticos e, portanto, em seus conjuntos de espécies (Hoeinghaus et al. 2007). Além disso, o formato linear e dendrítico das redes de drenagem limita as possibilidades de dispersão e colonização de espécies obrigatoriamente aquáticas como os peixes (Sharma et al. 2011; Shurin et al. 2009). Esta dispersão limitada leva à maior similaridade entre riachos dentro da mesma bacia, e está diretamente associada a fatores históricos e biogeográficos (Reyjol et al. 2007; Sharma et al. 2011).
A influência da dispersão limitada e dos filtros ambientais têm sido avaliadas como potenciais processos que causam dissimilaridade nas assembleias de peixes de riachos, mas estudos recentes mostram que a diversidade funcional de peixes pode apresentar respostas distintas de sua contraparte taxonômica (Cilleros et al. 2016; Hoeinghaus et al. 2007). A diversidade funcional é definida como o valor e abrangência de atributos funcionais que influenciam o funcionamento do ecossistema (Tilman 2001), podendo ser mais sensível aos filtros ambientais que a diversidade taxonômica, já que a diversidade funcional é um reflexo da adaptação das espécies às condições locais (Dı́az and Cabido 2001; Villéger et al. 2010). Assim, fica claro que o estudo da diversidade funcional fornece informações complementares para a compreensão dos fatores que controlam a distribuição das espécies.
(Heino et al. 2007; Warwick and Clarke 1995) e pode indicar a capacidade de um sistema para gerar novas soluções evolutivas em respostas a mudanças ambientais (Meynard et al. 2011).
A relação entre diferentes componentes de diversidade pode ajudar na tomada de decisões conservacionistas ao informar se diferentes áreas possuem níveis distintos ou não de diversidade em relação diversas facetas (Pool et al. 2014). Além disso, é importante determinar se essas métricas respondem de maneira similar a variáveis de grande escala, mais facilmente obtidas que variáveis de hábitat físico (Heino et al. 2007; Heino et al. 2008). A congruência entre diferentes componentes da diversidade e uma forte previsibilidade em relação a métricas de grande escala tornariam as medidas conservacionistas muito mais simples, baratas e rápidas (Carvalho and Tejerina-Garro 2015b; Heino et al. 2008).
Considerando o exposto acima, os objetivos gerais desta tese são avaliar o quanto variáveis do hábitat físico de riachos são reguladas por variáveis em escala de bacia e como variáveis ambientais e espaciais afetam as assembleias de peixes na Amazônia. Estes objetivos foram avaliados utilizando 57 riachos em bom estado de conservação distribuídos em seis bacias na Amazônia. Este trabalho foi dividido em três capítulos para investigar detalhadamente os objetivos gerais.
No primeiro capítulo, intitulado “Regional controls on physical habitat structure of Amazon streams”, buscou-se determinar a relação entre diversas métricas do hábitat físico e métricas na escala de bacia. A hipótese testada é a de que as variáveis da bacia controlam fortemente as características do hábitat.
No segundo capítulo, intitulado “Partitioning taxonomic and functional diversity of Amazon stream fish between environment and space”, o objetivo foi determinar o papel de variáveis espaciais e ambientais (divididas entre locais e de bacia) na diversidade alfa e beta taxonômica e funcional de peixes. Testou-se a hipótese que a diversidade alfa e beta taxonômica são mais afetadas elas variáveis de bacia, enquanto a diversidade alfa e beta funcionais são mais afetadas por variáveis do hábitat.
MATERIAL E MÉTODOS Área de estudo
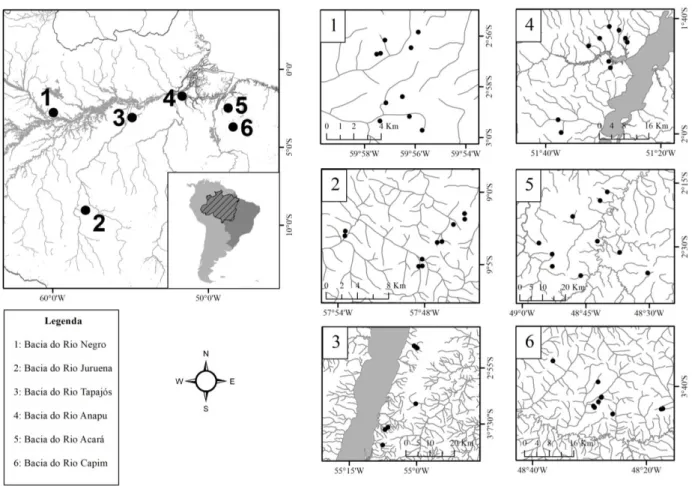
Foram amostrados 57 riachos durante o período de seca entre 2012 e 2015. Estes riachos encontram-se distribuídos em seis bacias (Figura 1): Bacias dos rios Juruena (10 riachos amostrados), Negro (10), Anapu (10), Tapajós (7), Acará (10) e Capim (10). Os riachos das bacias do Juruena, Negro, Anapu, Tapajós estão localizados dentro de unidades de conservação, já os riachos das Bacias do Acará e do Capim estão em fragmentos florestais protegidos em áreas particulares.
Figura 1. Localização das seis bacias de estudo amostradas na Amazônia. Foram amostrados 57 riachos nos períodos de seca de 2012 a 2015.
Bacia do rio Juruena
definido como tropical quente e úmido, com curto período de seca e sazonalidade bem definida (Peel et al. 2007). A temperatura média é de 25,7 °C, com máxima de 32 °C e mínima de 15 °C. A pluviosidade média anual varia de 2.000 a 2.500 mm, com período chuvoso de outubro a abril (350 mm) e período de estiagem de junho a setembro (10 mm) (ICMBio 2011).
Bacia do rio Negro
Os riachos amostrados nessa região (Figura 2B) encontram-se na Reserva Florestal Adolpho Ducke. A reserva, localizada próximo da cidade de Manaus, ocupa uma área de 10.000 ha coberta principalmente por floresta de terra firme. O clima é do tipo “Am” na classificação de Köppen (Peel et al. 2007), com temperatura anual média de 26,7 °C. A precipitação média é de 2.286 mm por ano, com período chuvoso se estendendo de novembro a maio e o seco, de junho a outubro (Mendonça et al. 2005).
Bacia do rio Tapajós
Todos os riachos amostrados na bacia do rio Tapajós (Figura 2C) foram amostrados na Floresta Nacional do Tapajós. A reserva, que ocupa quase 545 mil ha, está localizada nos municípios de Belterra, Aveiro, Placas e Rurópolis, no Estado do Pará. A vegetação do tipo Floresta Ombrófila Densa cobre mais de 85% do território da FLONA. O clima é do tipo Am na classificação de Köppen. A temperatura média anual é de 25,5 ºC, com mínima de 21 ºC e máxima de 30,6 ºC. A precipitação média anual é de 1.820 mm, com o período chuvoso se estendendo de janeiro a maio e o seco, de junho a dezembro (IBAMA 2004).
Bacia do rio Anapu
Bacia do rio Acará
Os riachos amostrados na bacia do rio Acará (Figura 2E) estão localizados na área da empresa Agropalma, nos municípios de Tailândia, Tomé-Açu, Acará e Moju. A empresa possui oito fragmentos florestais que somam 50.000 ha, sendo que 90% desse montante são de Floresta Ombrófila Densa de Terra Firme. O clima local é do tipo “Af”, caracterizado como equatorial úmido (Peel et al. 2007). A pluviosidade média é de 2.344 mm, com ápice do período de chuvas em março (427 mm) e ápice do período de estiagem em setembro (54 mm) (Albuquerque et al. 2010). A temperatura média é de 26 °C (Luiza-Andrade et al. 2017).
Bacia do rio Capim
Figura 2. Exemplo de riachos amostrados nas bacias dos rios Juruena (A), Negro (B), Tapajós (C), Anapu (D), Acará (E) e Capim (F) entre os anos de 2012 e 2015.
Delineamento amostral
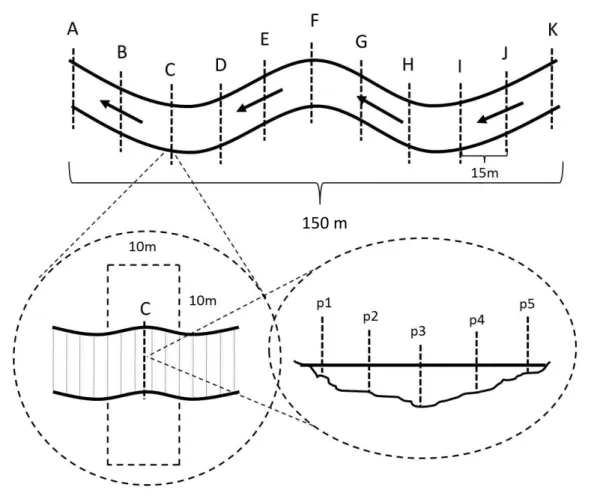
Figura 3. Esquema do trecho de riacho. As letras (A-K) indicam as transecções, marcadas a cada 15m. As seções longitudinais se referem aos segmentos entre as transecções.
Coleta de variáveis locais
Para mensuração das variáveis estruturais do ambiente, foi aplicada uma versão modificada (Callisto et al. 2014) do Protocolo de Avaliação e Monitoramento Ambiental (US-EPA) descrito por Kaufmann et al. (1999) e Peck et al. (2006). Originalmente, este protocolo visa avaliar as condições físicas em que os riachos se encontram, considerando as mudanças antrópicas afetando os corpos d’água. Entretanto, como o presente estudo foi aplicado apenas em riachos bem conservados, o mesmo foi utilizado apenas como protocolo de caracterização do hábitat físico.
Nas transecções, foram tomadas as seguintes variáveis:
1) Largura molhada (m): largura do canal, medida através de fita métrica.
2) Profundidade do canal (cm): medida com o uso de um cano graduado em cinco pontos equidistantes
3) Tipo de substrato e imersão: tomado nos mesmos cinco pontos da profundidade do canal. A classificação é feita em categorias (ex: areia, silte, banco de folhas, cascalho grosso)
determinadas a partir do tamanho do sedimento (Figura 4). A imersão do substrato no sedimento fino é estimada visualmente.
Figura 4. Diferentes substratos encontrados nos leitos dos riachos amostrados na Bacia Amazônica.
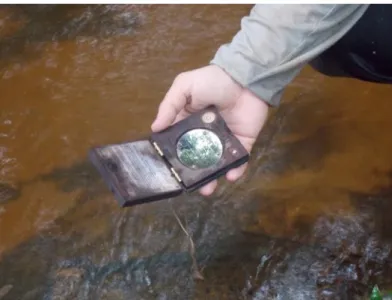
4) Cobertura de dossel: mensurado em seis pontos (direita, centro direita, centro montante, centro jusante, centro esquerda e esquerda) com o uso de densiômetro (Figura 5).
5) Abrigo para peixes: estimativa visual de alguns componentes estruturais do riacho, como banco de folhas, algas filamentosas e matacões. Essa estimativa é feita considerando os 5 m anteriores e posteriores à transecção, cobrindo uma extensão de 10 m.
6) Zona ripária: estimativa visual da cobertura proporcionada pela zona ripária em ambas as margens. Inclui desde árvores de grande porte até plantas rasteiras e solo nu. Essa estimativa é feita considerando os 5 m anteriores e posteriores à transecção, e uma extensão de 10 m a partir de cada margem, formando plots de 100 m2.
Nas seções longitudinais, foram tomadas as seguintes variáveis em 15 pontos equidistantes: 1) Profundidade do talvegue (cm): medido com o uso de um cano graduado.
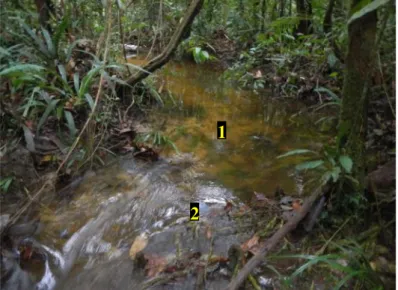
2) Tipo de unidade do hábitat do canal: determinada a partir do tipo principal de classe de hábitat do canal em uma linha transversal (Figura 6). A unidade do canal varia de fluxo suave até cascata e queda d’água, podendo haver formação de vários tipos de piscina.
Figura 6. Exemplo de alternância de unidades de canal nos riachos das seis áreas amostradas na Bacia Amazônica. 1 = Fluxo suave; 2 = Rápido.
3) Largura molhada: medidas no 1º e 8º pontos da seção longitudinal.
4) Tipo de substrato: medido em cinco pontos transversais equidistantes no 8º ponto da seção longitudinal.
5) Presença de pedaços grandes de madeira: foram contados tanto os que estão imersos na água quanto os que estão suspensos sobre o canal. Os pedaços de madeira foram registrados a partir de categorias de tamanho que incluem o volume ocupado pela madeira.
1
6) Declividade do canal: determinada com o uso de uma mangueira e duas réguas.
7) Velocidade da água (medida uma única vez): mensurada através do método do objeto flutuante.
Essas variáveis foram combinadas para formar novas variáveis seguindo o descrito por Kaufmann et al. (1999). Em cada capítulo, há tabelas nos materiais suplementares com o resumo estatístico das métricas utilizadas.
Variáveis de bacia
Foram utilizadas 11 variáveis como características das bacias de drenagem a montante de cada sítio amostral: temperatura média anual (ºC), temperatura do trimestre mais seco (ºC), precipitação média anual (mm), precipitação do trimestre mais seco (mm), altitude (m), declividade da bacia (%), área drenada (Km²) e proporção de fragmentos grandes (> 2 mm, %), argila (%), areia (%) e silte (%) no solo.
As variáveis climáticas foram obtidas pelo BioClim (http://www.worldclim.org/bioclim). A altitude, declividade e área drenada foram calculadas com a ferramenta ArcHydro no software ArcGIS a partir de imagens de satélite (Shuttle Radar Topography Mission – SRTM) com 30 m de altitude, obtidas no site EarthExplorer (http://earthexplorer.usgs.gov/). Os dados de solo, todos com profundidade de 0 cm, foram obtidos no site SoilsGrid1km (http://soilgrids1km.isric.org/). A proporção de cada variável de solo foi calculada utilizando a ferramenta Spatial Analyst tool no software ArcGis.
Coleta de peixes
Figura 7. Exemplo de coleta de peixes utilizando rede mão nos riachos amostrados na Bacia Amazônica.
Dados funcionais
Foram obtidos traits funcionais de cinco indivíduos de tamanho similar de cada espécie. Para espécies com dimorfismo sexual, foram selecionados apenas indivíduos do sexo feminino (Ribeiro et al. 2016). Traits quantitativos foram obtidos a partir de 16 medidas morfológicas: comprimento padrão (CP), altura máxima do corpo (AMC), largura máxima do corpo (LMC), comprimento do pedúnculo caudal (CPC), altura máxima do pedúnculo caudal (APC), largura máxima do pedúnculo caudal (LPC), comprimento da nadadeira peitoral (CNP), altura máxima da nadadeira peitoral (AMNP), altura da linha média do corpo (ALMC), altura da linha média do olho (ALMO), comprimento da cabeça (CC), altura da cabeça (AC), largura da boca (LB), área do corpo (ADC), área da nadadeira peitoral (ANP) e orientação da boca (OB) (Ohlberger et al. 2006; Watson and Balon 1984).
Tabela 1. Traits funcionais quantitativos analisados em peixes de riachos amostrados na Bacia Amazônica (Ohlberger et al. 2006; Watson and Balon 1984).
Característica Fórmula Explicação
Índice de compressão IC = AMC/LMC Altos valores indicam espécies comprimidas que habitam ambientes lênticos Altura relativa do corpo AR = AMC/CP Valores menores indicariam peixes que habitam águas rápidas
Comprimento relativo do pedúnculo caudal
CRP = CPC/CP Altos valores estão associados a maior capacidade de natação
Índice de compressão do pedúnculo caudal
ICP = APC/LPC Valores elevados indicam pedúnculos comprimidos, associados a nadadores pouco ativos
Índice de aplanamento ventral IAV = ALMC/AMC Valores menores indicam peixes hidrodinâmicos, que mantém sua posição espacial inclusive parados
Área relativa da nadadeira peitoral
ARP = ANP/ADC Valores altos indicam nadadores lentos que realizam manobras com as nadadeiras peitorais, ou peixes que de águas turbulentas que precisam ficar
aderidos ao substrato Aspecto proporcional da
nadadeira peitoral
RAP = CNP/AMNP Valores elevados indicam nadadeiras compridas, próprias para percorrer distâncias longas ou natação constante
Comprimento relativo da cabeça CRC = CC/CP Altos valores indicam consumo de presas grandes
Posição relativa dos olhos PRO = ALMO/AC Altos valores indicam olhos dorsais, encontrados normalmente em peixes bênticos
Orientação da boca OB A orientação da boca indica em que parte do hábitat o peixe obtém seu alimento. Inferior = entre 10° e 80°; Terminal = 90°; Superior = entre 100° e
170°; Ventral= 0°. Os valores em graus foram convertidos em radianos (unidade de ângulo plano), para permitir a comparação com atributos com
unidades de outra natureza, mas com a mesma dimensão Coeficiente de finura CF = CP/√(AMC *
LMC)
REFERÊNCIAS BIBLIOGRÁFICAS
Albuquerque MF, Souza EB, Oliveira MCF, Souza Jr JA (2010) Precipitação nas mesorregiões do estado do Pará: climatologia, variabilidade e tendências nas últimas décadas (1978-2008). Revista Brasileira de Climatologia 6: 151-168
Barthem RB, Charvet-Almeida P, Montag LFA, Lanna AE (2004) Amazon Basin, GIWA Regional Assessment 40b. University of Kalmar, Kalmar-Sweden, 76 pp.
Behling H, Costa ML (2000) Holocene environmental changes from the Rio Curuá record in the Caxiuanã region, eastern Amazon Basin. Quaternary Research 53: 369-377. DOI: 10.1006/qres.1999.2117
Brejão GL, Gerhard P, Zuanon J (2013) Functional trophic composition of the ichthyofauna of forest streams in eastern Brazilian Amazon. Neotropical Ichthyology 11: 361-373
Callisto M, Alves CBM, Lopes JM, Castro MA (Eds) (2014) Condições ecológicas em bacias hidrográficas de empreendimentos hidrelétricos. CEMIG, Belo Horizonte-Brazil, 264 pp. Carvalho RA, Tejerina‐Garro FL (2015a) Environmental and spatial processes: what controls the
functional structure of fish assemblages in tropical rivers and headwater streams? Ecology of Freshwater Fish 24: 317-328. DOI: 10.1111/eff.12152
Carvalho RA, Tejerina‐Garro FL (2015b) Relationships between taxonomic and functional components of diversity: implications for conservation of tropical freshwater fishes. Freshwater Biology 60: 1854-1862. DOI: 10.1111/fwb.12616
Castello L, McGrath DG, Hess LL, Coe MT, Lefebvre PA, Petry P, Macedo MN, Renó VF, Arantes CC (2013) The vulnerability of Amazon freshwater ecosystems. Conservation Letters 6: 217-229. DOI: 10.1111/conl.12008
Cilleros K, Allard L, Grenouillet G, Brosse S (2016) Taxonomic and functional diversity patterns reveal different processes shaping European and Amazonian stream fish assemblages. Journal of Biogeography 43: 1832-1843. DOI: 10.1111/jbi.12839
Dı́az S, Cabido M (2001) Vive la différence: plant functional diversity matters to ecosystem processes. Trends in Ecology & Evolution 16: 646-655
Frissell CA, Liss WJ, Warren CE, Hurley MD (1986) A hierarchical framework for stream habitat classification: viewing streams in a watershed context. Environmental Management 10: 199-214
stream macroinvertebrates. Freshwater Biology 52: 1846-1861. DOI: 10.1111/j.1365-2427.2007.01801.x
Heino J, Mykrä H, Kotanen J (2008) Weak relationships between landscape characteristics and multiple facets of stream macroinvertebrate biodiversity in a boreal drainage basin. Landscape Ecology 23: 417-426. DOI: 10.1007/s10980-008-9199-6
Hoeinghaus DJ, Winemiller KO, Birnbaum JS (2007) Local and regional determinants of stream fish assemblage structure: inferences based on taxonomic vs. functional groups. Journal of Biogeography 34: 324-338. DOI: 10.1111/j.1365-2699.2006.01587.x
Hynes HBN (1975) The stream and its valley. Verhandlungen der Internationalen Vereinigung fur theoretische und angewandte Limnologie 19: 1-15
IBAMA (2004) Floresta Nacional do Tapajós: plano de manejo. Instituto Brasileiro do Meio Ambiente e dos Recursos Naturais Renováveis. Ministério do Meio Ambiente, Brasília, Brazil ICMBio (2011) Plano de manejo do Parque Nacional do Juruena. Instituto Chico Mendes de
Conservação da Biodiversidade, Brasília, Brazil
Junk WJ, Soares MGM, Bayley PB (2007) Freshwater fishes of the Amazon River basin: their biodiversity, fisheries, and habitats. Aquatic Ecosystem Health & Management 10: 153-173. DOI: 10.1080/14634980701351023
Kaufmann PR, Levine P, Robison EG, Seeliger C, Peck DV (1999) Quantifying physical habitat in wadeable streams. Environmental Monitoring and Assessment Program, National Health and Environmental Effects Research Laboratory, Office of Research and Development, US Environmental Protection Agency
Leal CG, Pompeu PS, Gardner TA, Leitão RP, Hughes RM, Kaufmann PR, Zuanon J, Paula FR, Ferraz SF, Thomson JR (2016) Multi-scale assessment of human-induced changes to Amazonian instream habitats. Landscape Ecology: 1-21. DOI: 10.1007/s10980-016-0358-x Leary S, Underwood W, Anthony R, Cartner S, Corey D, Grandin T, Greenacre C, Gwaltney-Brant
Lisboa PLB (Ed) (2002) Caxiuanã: populações tradicionais, meio físico e diversidade biológica. Museu Paraense Emílio Goeldi, Belém-Brazil
Luiza-Andrade A, Brasil LS, Benone NL, Shimano Y, Farias APJ, Montag LFA, Dolédec S, Juen L (2017) Influence of oil palm monoculture on the taxonomic and functional composition of aquatic insect communities in eastern Brazilian Amazonia. Ecological Indicators 82: 478-483. DOI: 10.1016/j.ecolind.2017.07.006
Lundberg JG, Sabaj Pérez MH, Dahdul WM, Aguilera OA (2010) The amazonian Neogene fish fauna. In: Hoorn C, Wesselingh F (Eds) Amazonia: Landscape and Species Evolution: A look into the past. Wiley-Blackwell, West Sussex-UK, 281-301
Magurran AE, Queiroz H (2010) Evaluating tropical biodiversity: do we need a more refined approach? Biotropica 42: 537-539. DOI: 10.1111/j.1744-7429.2010.00670.x
Mendonça FP, Magnusson WE, Zuanon J (2005) Relationships between habitat characteristics and fish assemblages in small streams of Central Amazonia. Copeia 4: 751-764
Meyer JL, Strayer DL, Wallace JB, Eggert SL, Helfman GS, Leonard NE (2007) The contribution of headwater streams to biodiversity in river networks. Journal of the American Water Resources Association 43: 86-103. DOI: 10.1111/j.1752-1688.2007.00008.x
Meynard CN, Devictor V, Mouillot D, Thuiller W, Jiguet F, Mouquet N (2011) Beyond taxonomic diversity patterns: how do α, β and γ components of bird functional and phylogenetic diversity respond to environmental gradients across France? Global Ecology and Biogeography 20: 893-903. DOI: 10.1111/j.1466-8238.2010.00647.x
Montag LFA, Freitas TMS, Castro NC, Wosiacki WB, Barthem RB (2009) Ictiofauna: biodiversidade e conservação. In: Lisboa PLB (Ed) Caxiuanã: desafios para a conservação de uma floresta nacional na Amazônia. Museu Paraense Emílio Goeldi, Belém-Brazil, 605-628
Ohlberger J, Staaks G, Hölker F (2006) Swimming efficiency and the influence of morphology on swimming costs in fishes. Journal of Comparative Physiology B 176: 17-25. DOI: 10.1007/s00360-005-0024-0
Pease AA, Taylor JM, Winemiller KO, King RS (2011) Multiscale environmental influences on fish assemblage structure in central Texas streams. Transactions of the American Fisheries Society 140: 1409-1427. DOI: 10.1080/00028487.2011.623994
Peck DV, Herlihy AT, Hill BH, Hughes RM, Kaufmann PR, Klemm DJ, Lazorchak JM, McCormick FH, Peterson SA, Ringold PL, Magee T, Cappaert MR (2006) Environmental monitoring and assessment program – surface waters western pilot study: Field operations manual for wadeable streams. EPA 600/R-06/003. U.S. Environmental Protection Agency, Washington-USA, 332 pp.
Peel MC, Finlayson BL, McMahon TA (2007) Updated world map of the Köppen-Geiger climate classification. Hydrology and Earth System Sciences 11: 1633-1644
Pool TK, Grenouillet G, Villéger S (2014) Species contribute differently to the taxonomic, functional, and phylogenetic alpha and beta diversity of freshwater fish communities. Diversity and Distributions 20: 1235-1244. DOI: 10.1111/ddi.12231
Portocarrero‐Aya M, Cowx IG (2016) Conservation of freshwater biodiversity in key areas of the Colombian Amazon. Aquatic Conservation: Marine and Freshwater Ecosystems 26: 350-363. DOI: 10.1002/aqc.2582
Prudente BS, Pompeu PS, Juen L, Montag LFA (2017) Effects of reduced‐impact logging on physical habitat and fish assemblages in streams of Eastern Amazonia. Freshwater Biology 62: 303-316. DOI: 10.1111/fwb.12868
Reyjol Y, Hugueny B, Pont D, Bianco PG, Beier U, Caiola N, Casals F, Cowx I, Economou A, Ferreira T, Haidvogl G, Noble R, de Sostoa A, Vigneron T, Virbickas T (2007) Patterns in species richness and endemism of European freshwater fish. Global Ecology and Biogeography 16: 65-75. DOI: 10.1111/j.1466-822x.2006.00264.x
Ribeiro MD, Teresa FB, Casatti L (2016) Use of functional traits to assess changes in stream fish assemblages across a habitat gradient. Neotropical Ichthyology 14: e140185. DOI: 10.1590/1982-0224-20140185
Sharma S, Legendre P, De Cáceres M, Boisclair D (2011) The role of environmental and spatial processes in structuring native and non‐native fish communities across thousands of lakes. Ecography 34: 762-771. DOI: 10.1111/j.1600-0587.2010.06811.x
Shurin JB, Cottenie K, Hillebrand H (2009) Spatial autocorrelation and dispersal limitation in freshwater organisms. Oecologia 159: 151-159. DOI: 10.1007/s00442-008-1174-z
Snelder TH, Biggs BJF (2002) Multiscale river environment classification for water resources management. Journal of the American Water Resources Association 38: 1225-1239
Stirling G, Wilsey B (2001) Empirical relationships between species richness, evenness, and proportional diversity. The American Naturalist 158: 286-299
Stoddard JL, Larsen DP, Hawkins CP, Johnson RK, Norris RH (2006) Setting expectations for the ecological condition of streams: the concept of reference condition. Ecological Applications 16: 1267-1276
Thieme M, Lehner B, Abell R, Hamilton SK, Kellndorfer J, Powell G, Riveros JC (2007) Freshwater conservation planning in data-poor areas: an example from a remote Amazonian basin (Madre de Dios River, Peru and Bolivia). Biological Conservation 135: 484-501. DOI: 10.1016/j.biocon.2006.10.054
Tilman D (2001) Functional diversity. In: Levin SA (Ed) Encyclopedia of biodiversity. Academic Press, San Diego-USA, 109-120
Villéger S, Miranda JR, Hernández DF, Mouillot D (2010) Contrasting changes in taxonomic vs. functional diversity of tropical fish communities after habitat degradation. Ecological Applications 20: 1512-1522. DOI: 10.1890/09-1310.1
Warwick RM, Clarke KR (1995) New 'biodiversity' measures reveal a decrease in taxonomic distinctness with increasing stress. Marine Ecology Progress Series 129: 301-305
Watrin OS, Rocha AMA (1991) Levantamento da vegetação natural e do uso da terra no município de Paragominas (PA) utilizando imagens TM/LANDSAT. Boletim de pesquisa EMBRAPA-CPATU, Belém-Brasil, 40 pp.
Watson DJ, Balon EK (1984) Ecomorphological analysis of fish taxocenes in rainforest streams of northern Borneo. Journal of Fish Biology 25: 371-384
Wilsey BJ, Chalcraft DR, Bowles CM, Willig MR (2005) Relationships among indices suggest that richness is an incomplete surrogate for grassland biodiversity. Ecology 86: 1178-1184 Zbinden ZD, Matthews WJ (2017) Beta diversity of stream fish assemblages: partitioning variation
Capítulo 1
Regional controls on physical habitat structure of
Amazon streams
Regional controls on physical habitat structure of Amazon streams
Benone, NL1,2*; Esposito, MC3; Juen, L1; Pompeu, PS4; Montag, LFA1
1Laboratório de Ecologia e Conservação, Instituto de Ciências Biológicas, Universidade Federal do Pará – UFPA, Augusto Corrêa street, 01, Guamá, zip code 66075-110, Belém, PA, Brasil.
2Programa de Pós-graduação em Zoologia, Instituto de Ciências Biológicas, Universidade Federal do Pará/ Museu Paraense Emílio Goeldi – UFPA/MPEG, Augusto Corrêa street, 01, Guamá, zip code 66075-110, Belém, PA, Brasil.
3Laboratório de Zoologia de Invertebrados, Instituto de Ciências Biológicas, Universidade Federal do Pará – UFPA, Augusto Corrêa street, 01, Guamá, zip code 66075-110, Belém, PA, Brasil.
4Departamento de Biologia, Universidade Federal de Lavras – UFLA, Doutor Sylvio Menicucci avenue, 1001, Kennedy, zip code 37200-000, Lavras, MG, Brasil.
*Author for correspondence: nbenone@gmail.com (NLB)
Running title: Regional and physical habitat in Amazon streams
DOI: 10.1002/rra.3137
ABSTRACT
Altitude was the most important catchment variable, strongly affecting flow velocity and regulating channel morphology and sediment transport. Spatial differences in environmental heterogeneity indicate that different processes act at each scale; this emphasizes how difficult it is to choose the most relevant spatial scale in ecological studies. Our results highlight the importance of regional variables, especially altitude and slope, as drivers of local-scale environmental heterogeneity. We hope these results will help in developing more efficient monitoring projects and restoration practices to better understand and conserve aquatic resources in the Amazon Basin.
INTRODUCTION
Streams are highly heterogeneous ecosystems, and their configurations are primarily determined by regional factors at catchment scale, such as climate, geology, and land cover (Vannote et al., 1980; Frissell et al., 1986; Snelder and Biggs, 2002). The links between local physical habitat and regional features of drainage basins have led to the development of several hierarchical models, which define drainage basins as a series of nested subsystems, where the functions and structure of lower levels depend on the features of higher levels (Hynes, 1975; Frissell et al., 1986; Snelder and Biggs, 2002).
For a comprehensive understanding of the functioning of streams and rivers systems, it is necessary to identify which factors are important at each scale and how they interact (Vannote et al., 1980; Frissell et al., 1986; Snelder and Biggs, 2002; Grabowski et al., 2014). This knowledge can provide information for several ecological processes and conservation efforts. For example, differences in environmental filters at local and regional scales are responsible for variation in diversity patterns and aquatic community compositions; therefore, detecting key variables helps to determine the relative importance of each scale to biotic patterns (Vannote et al., 1980; Wang et al., 2003). In streams assessment and management approaches, reference streams (preserved or less impaired) are usually compared to impaired streams to quantify anthropogenic impacts on biotic and abiotic stream components. However, natural variations at both scales must be considered when selecting and characterizing reference sites, so that they are properly contrasted against impaired streams (Hughes et al., 1986; Grabowski et al., 2014).
In the Amazon Basin, the huge network formed by streams is a key contribution to landscape heterogeneity; its importance lies on the fact that it is a source of water, it maintains aquatic biodiversity, and it supplies ecosystemic services (Barthem et al., 2004; Junk et al., 2007; Castello et al., 2013). Despite their importance, Amazon streams are still poorly studied, and little is known on factors that regulate their variability (Junk et al., 2007; Castello et al., 2013). Since the Amazon still has large relatively preserved areas, a proper assessment would provide essential information to guide management strategies (Thieme et al., 2007; Castello et al., 2013; Portocarrero‐Aya and Cowx, 2016), biodiversity assessment, and species distribution modelling (Frederico et al., 2014; Fagundes et al., 2016).
study them (Chaves et al., 2008; Castello et al., 2013). Without basic knowledge about the structure and function of Amazon streams ecosystems, the development of methods capable of preventing or mitigating impacts is severely hampered (Bleich et al., 2016; Leal et al., 2016). Therefore, identifying associations between physical habitat in small streams of protected drainages and the natural environmental factors that likely control stream habitat will help to factor out natural variability and allow more accurate diagnosis of anthropogenic effects.
The use of regional variables at catchment scale as drivers of local physical habitat variability is useful to identify stream conditions in first assessments of remote areas, minimizing the need for expensive, time-consuming field surveys. Considering the importance of assessing stream conditions and heterogeneity in the Amazon, we aimed to answer the following question: How much is the local physical habitat of streams affected by regional features at catchment scale? Our hypothesis is that regional variables will be important drivers of local physical habitat due to the hierarchical nature of drainage systems.
MATERIAL AND METHODS Study area
We sampled 55 streams distributed in six river basins (Figure 1): Juruena (10 streams), Negro (10), Anapu (10), Tapajós (7), Acará (8), and Capim (10) River Basins. All streams are in protected areas: the first four basins are situated in conservation units and the last two are in protected forested fragments of private areas. We aimed to capture the largest possible variability inside each basin.
Figure 1. Location of the 55 sampled streams, distributed in six river basins of the Amazon.
Local physical habitat structure
In each stream, we sampled a 150-m reach, divided into ten 15-m longitudinal sections by 11 equidistant cross-sections. We applied a modified version (Callisto et al., 2014) of the physical habitat assessment protocol of the U. S. Environmental Protection Agency (US-EMAP, Kaufmann et al., 1999; Peck et al., 2006), which resulted in 146 instream variables divided in six blocks: channel morphology (e.g. width, depth), substrate (e.g. bedrock, sand), channel habitat units (e.g. riffle, pool), riparian vegetation cover (e.g canopy cover, barren ground), large woody pieces (> 1,5 m long and > 10 cm at small end diameter), and instream cover for aquatic organisms (e.g. coarse and fine litter). All local physical metrics are listed in Table S1.
According to Peck et al. (2006), this protocol is more efficient under low flow conditions, which occur during dry season. Thus, all streams were sampled during that season.
Catchment-scale variables
driest quarter (ºC), mean annual precipitation (mm), precipitation of the driest quarter (mm), altitude (m), catchment slope (%), drainage area (km²), and proportion of coarse fragments (> 2 mm, %), clay (%), sand (%) and silt (%) in soil. Temperature and precipitation were obtained at BioClim (http://www.worldclim.org/bioclim). Using Shuttle Radar Topography Mission (SRTM) images, obtained at EarthExplorer (http://earthexplorer.usgs.gov/), we calculated altitude, catchment slope, and drainage area using the ArcHydro tool with ArcGis software. Soil data at 0 cm depth were obtained at SoilsGrid1km (http://soilgrids1km.isric.org/). We calculated the proportion for each soil variable using Spatial Analyst tool with ArcGis software. The complete list of catchment metrics can be found in Table S1. These variables were chosen for being well known natural drivers of local variation in small waterbodies (Frissell et al., 1986; Snelder and Biggs, 2002; Grabowski et al., 2014; Schneider et al., 2015).
Data analysis
To reduce the number of local variables, we excluded metrics with low coefficient of variation (≤ 10 %) and variables with zero values at many (≥ 80%) sites. After that, all proportion variables were transformed (ln (x+1)) to improve data fitness to normal distribution. Other variables were z-score transformed to remove the effect of measures in different units (Legendre and Legendre, 2012). We used Pearson correlation coefficient to assess multicollinearity, excluding one correlated variable until all correlation pairs were ≤ 0.7. For each block with more than three remaining variables, we used Euclidean distance among streams and applied a Canonical Analysis of Principal Coordinates (CAP, Anderson and Willis, 2003), using the six basins as a categorical constrained factor to test whether there were differences between local characteristics of streams in distinct river basins. We selected only canonical axes with δ ≥ 0.6, as they had the strongest associations with the multivariate data cloud and the hypothesis of group differences (Anderson et al., 2008), and retained metrics with loadings ≥ 0.6 on these axes. We assessed multicollinearity again with the retained variables. The same sequence of steps was followed using catchment metrics.
Multivariate Variance (PERMANOVA, Anderson, 2001), followed by a Permutational Analysis of Multivariate Dispersions (PERMDISP, Anderson, 2006) to detect if river basins had different levels of environmental heterogeneity. The higher the mean distance to group centroid, the higher the environmental heterogeneity.
Finally, we used multiple regressions with forward selection procedure to determine if local physical habitat variables were structured by catchment features, with the former as dependent variables and the latter as independent variables. In this case, data were not separated by river basins. All analyses were run in R software (R Development Core Team, 2016) using vegan package (Oksanen et al., 2016), with 4999 permutations and α = 0.05.
RESULTS
Table 1. List of remaining local and catchment metrics, with mean and standard deviation (SD) for each river basin. Size class 1 = woody pieces ≥ 0.3 m at small end diameter and ≥ 0.1 m length. Size class 4 = woody pieces ≥ 0.6 m at small end diameter and ≥ 15 m length.
Block of variables Variable name Acará Anapu Capim Negro Juruena Tapajós
Channel morphology SD thalweg depth (cm) 9.16 ± 3.83 11.35 ± 2.06 10.58 ± 2.72 13.92 ± 3.29 11.52 ± 5.88 2.59 ± 0.58
Substrate
Proportion of silt/muck/clay (%) 6.5 ± 3.73 26.1 ± 31.18 9.59 ± 6.97 0.67 ± 1.01 20.09 ± 9.44 10.8 ± 17 Fine substrates (< 16 mm diameter) (fine
gravel, sand and silt/muck/clay) (%) 37.17 ± 13.55 26.1 ± 31.18 37.76 ± 12.06 38.75 ± 11.62 54.98 ± 15.34 49.3 ± 11.37 Proportion of wood (%) 6.50 ± 4.30 21.14 ± 8.18 5.10 ± 4.29 5.27 ± 2.17 4.70 ± 3.75 5.88 ± 2.52 Proportion of roots and trees (%) 7.67 ± 4.98 6.86 ± 9.64 6.48 ± 4.70 36.57 ± 9.76 3.05 ± 4.51 22.36 ± 7.59
Channel habitat units
Proportion of rapids (%) 0.08 ± 0.24 0.00 ± 0.00 0.60 ± 0.58 3.67 ± 4.80 13.67 ± 20.97 10.98 ± 15.19 Fast channel habitats (falls + cascade +
rapids + riffles) (%) 34.61 ± 30.55 7.53 ± 22.45 23.80 ± 17.62 54.67 ± 18.10 64.20 ± 31.03 46.95 ± 29.44
Riparian vegetation cover
SD canopy at banks (%) 2.69 ± 1.35 3.62 ± 2.59 5.98 ± 4.62 4.87 ± 1.81 9.19 ± 6.03 4.39 ± 1.57 SD barren ground (%) 1.22 ± 2.06 0.50 ± 1.32 2.21 ± 2.54 3.06 ± 4.88 2.41 ± 1.72 3.30 ± 4.64 Total riparian cover (%) 200.5 ± 56.2 237.59 ± 34.21 180.35 ± 23.07 265.16 ± 41.55 242.52 ± 31.14 230.84 ± 24.86
Large woody pieces
Number of large woody pieces inside +
above channel / m² - size class 1 0.22 ± 0.17 0.1 ± 0.05 0.12 ± 0.06 0.14 ± 0.05 0.07 ± 0.03 0.06 ± 0.03 Volume of large woody pieces inside +
Instream cover for aquatic organisms
Mean natural cover (wood + roots and trees + coarse litter + overhanging vegetation + undercut banks + boulder) (%)
159.26 ± 51.95
249.64 ± 109.92
111.80 ± 42.23
160.89 ±
32.03 98.09 ± 42.47 97.08 ± 28.36 Proportion of undercut banks (%) 0.23 ± 0.24 0 ± 0 0.7 ± 0.22 0.23 ± 0.19 0.48 ± 0.21 0.32 ± 0.27 Proportion of large cover (wood + trees and
roots + coarse litter + overhanging
vegetation + undercut banks + boulder) (%) 0.85 ± 0.20 0.94 ± 0.12 0.93 ± 0.07 0.52 ± 0.22 0.67 ± 0.22 0.49 ± 0.23
Catchment variables
Altitude (m) 39.5 ± 9.86 25.1 ± 5.55 119.6 ± 13.47 72 ± 12.81 265.5 ± 70.65 58.71 ± 29.94 Catchment slope (%) 5.55 ± 1.02 6.85 ± 0.59 5.96 ± 1.05 11.1 ± 1.1 10.23 ± 2.12 10.68 ± 3.16 Drainage area (km²) 2.19 ± 2.38 9.62 ± 10.64 1.57 ± 2.76 1.13 ± 1.51 11.13 ± 18.24 13.02 ± 17.75 Proportion of coarse fragments in soil (> 2
mm, %) 0.17 ± 0.42 0.9 ± 0.34 0.1 ± 0.19 0.02 ± 0.04 0.18 ± 0.22 0.56 ± 0.24
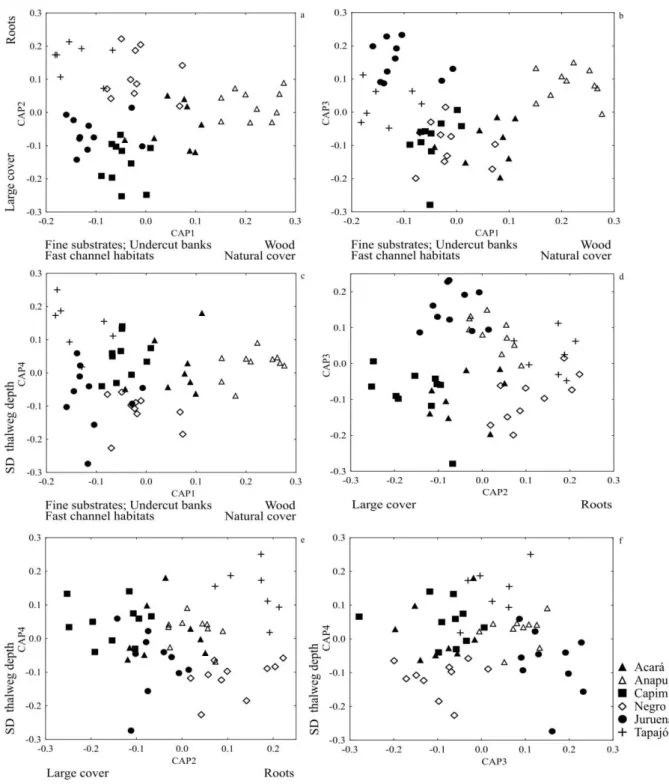
The final CAP with local physical habitat variables (δ² = 0.879; p < 0.001) (Figure 2) selected four axes (Table 2). Streams from different basins had very different physical structures (Pseudo-F = 7.955; p < 0.001, see Table S3 for pairwise results). For example, the first CAP axis for Anapu streams showed strong positive correlations with proportion of wood and mean natural cover, and negative correlations with fast channel habitats, undercut banks, and fine substrates (< 16 mm); the opposite pattern occurred in streams of other basins, especially in Juruena, Negro, and Tapajós (Figure 2 a-c). On the second CAP axis, Tapajós and Negro showed strong positive associations with roots, and Capim and Acará were strongly associated with proportion of large cover (Figure 2 a, d, e). Tapajós showed the weakest association with SD thalweg depth on the fourth CAP axis (Figure 2 c, e, f). Generally, streams showed marked differences in environmental heterogeneity levels for physical habitat variables within different basins (F = 5.016; p = 0.004; see Table S4 for pairwise results), with higher variability in Anapu (Figure 3).
Table 2. Loadings of the four selected axes of the Canonical Analysis of Principal Coordinates (CAP) with local physical habitat variables of streams. Bold values highlight strong loadings (≥ 0.6).
δ = 0.938 CAP1 δ = 0.880 CAP2 δ = 0.859 CAP3 δ = 0.770 CAP4
SD thalweg depth 0.250 -0.217 -0.068 -0.779
Proportion of silt/muck/clay -0.039 -0.403 0.489 0.248
Fine substrates -0.611 -0.050 -0.122 -0.112
Proportion of wood 0.662 0.231 0.262 0.180
Proportion of roots and trees -0.199 0.616 -0.584 -0.063
Proportion of rapids -0.519 0.264 0.227 -0.122
Fast channel habitats -0.722 0.074 -0.160 -0.355
SD canopy at banks -0.415 -0.132 0.276 -0.276
SD barren ground -0.429 -0.046 0.002 -0.050
Total riparian cover -0.003 0.549 0.301 -0.471
Mean natural cover 0.687 0.203 -0.124 -0.146
Proportion of undercut banks -0.600 -0.526 -0.102 0.077 Proportion of large cover 0.392 -0.621 -0.073 0.188 Number of large woody pieces inside
+ above channel / m² - size class 1 0.208 0.010 -0.438 -0.009 Volume of large woody pieces inside
Figure 3. Result of Permutational Analysis of Multivariate Dispersions (PERMDISP) with local physical habitat variables of 55 streams distributed in six river basins of the Amazon.
Table 3. Loadings of the two first axes of Canonical Analysis of Principal Coordinates (CAP) with catchment variables of 55 streams distributed in six river basins of the Amazon. Bold values highlight strong loadings (≥ 0.6).
CAP1
δ = 0.963 δ = 0.834 CAP2 δ = 0.754 CAP3
Altitude 0.966 0.246 0.052
Slope 0.487 -0.785 -0.338
Drainage area -0.057 -0.382 0.503 Coarse fragments -0.374 -0.503 0.753
Silt 0.219 0.285 0.235
Figure 5. Result of Permutational Analysis of Multivariate Dispersions (PERMDISP)with catchment variables of 55 streams distributed in six river basins of the Amazon.
Table 4. Results of multiple regressions between local and catchment variables of 55 streams distributed in six river basins of the Amazon. Bold values indicate significant values at α ≤ 0.05. SE = standard error.
Local variable Multiple regression Catchment variables β SE of β t p
SD thalweg depth R²= 0.059; F(1,53) = 3.345, p = 0.073 Coarse fragments -0.244 0.133 -1.829 0.073
Fine substrates R² = 0.227; F(3,51) = 4.994, p = 0.004
Altitude 0.337 0.144 2.345 0.023 Coarse fragments -0.159 0.139 -1.144 0.258
Slope 0.129 0.128 1.008 0.318
Proportion of wood R² = 0.445; F(3,51) = 13.658, p < 0.001
Altitude -0.441 0.122 -3.615 <0.001 Coarse fragments 0.349 0.118 2.958 0.005
Slope 0.157 0.108 1.452 0.153
Proportion of roots
and trees R² = 0.295; F(3,51) = 7.139, p < 0.001
Slope 0.371 0.122 3.035 0.004
Altitude -0.506 0.137 -3.684 <0.001 Coarse fragments -0.444 0.133 -3.340 0.002 Fast channel
habitats R² = 0.39; F(3,51) = 10.887, p < 0.001
Altitude 0.306 0.128 2.397 0.020
Slope 0.386 0.114 3.399 0.001
Coarse fragments -0.186 0.124 -1.504 0.139 Mean natural cover R² = 0.323; F(1,53) = 25.276, p < 0.001 Altitude -0.568 0.113 -5.028 <0.001
Undercut banks R² = 0.394; F(1,53) = 34.555, p < 0.001 Altitude 0.628 0.107 5.878 <0.001
Large cover R² = 0.205; F(2,52) = 6.708, p = 0.002 Slope -0.433 0.124 -3.502 <0.001
DISCUSSION
Our results showed high heterogeneity among streams in both their local physical habitat structure as well as their catchment characteristics, and their strong associations confirmed the importance of regional metrics at catchment scale as predictors of local variables. According to our results, altitude is the main driver of variation in local physical habitats, and is closely related to flow. The interaction of altitude and slope with substrate and flow velocity explained most of the environmental structures of streams, separating flat, low altitudinal river basins with slow flowing waterbodies, e.g. Anapu and Acará streams, from fast flowing sites with steeper slopes and higher altitude basins, such as Juruena and Negro streams.
Variations in altitude and slope can cause several changes across the longitudinal gradient due to their influence in flow velocity, one of the most important local structural stream variables, leading to several changes across the longitudinal gradient (Vannote et al., 1980; Snelder and Biggs, 2002; Grabowski et al., 2014), altering channel morphology, bank erosion and mobilization, transportation and deposition of sediments and substrates (Florsheim et al., 2008; Grabowski et al., 2014; Schneider et al., 2015). Our results showed that sites with high altitude and steeper slopes had lower proportion of wood and large cover, which can be linked to higher rates of sediment transport because of higher flows and shear stress (Grabowski et al., 2014). The positive association between altitude and velocity also affects channel morphology (Schneider et al., 2015), because enhanced shear stress, especially during floods, increases bank erosion and creates undercut banks (Florsheim et al., 2008), which were also correlated with altitude. Other studies showed similar results (Richards et al., 1996; Mugodo et al., 2006), highlighting the importance of altitude and slope as drivers of physical habitat variation in small streams.
involved with stream channel morphology; it can intensify meander formation, and is used as cover for aquatic organisms (Florsheim et al., 2008).
Increased proportion of coarse fragments in basin soils also affects flow velocity, because it enhances stream bed roughness and water percolation, increasing flow resistance and reducing runoff and flow velocity (Beibei et al., 2009; Schneider et al., 2015). Slow flowing streams with great accumulation of wood showed negative association with coarse fragments in soil, possibly due to reduced velocity. Another outcome is the lower proportion of roots in soils rich in coarse fragments, which are harder to penetrate by plant roots. Initial roots must first mechanically break rocks to provide easier access to new plant roots (Pawlik et al., 2016).
Environmental heterogeneity patterns within basins were not the same at different scales, indicating that different processes act on each scale, which reflects the complex nature of drainage systems. At a large scale, basins with high heterogeneity in catchment-scale variables were closer to Brazilian and Guiana Shields, with higher altitudes and steeper slopes. As explained before, these features are responsible for several characteristics of channel gradients (Grabowski et al., 2014; Schneider et al., 2015). Locally, high heterogeneity in physical habitat variables is highest in streams that are in river basins with low altitude and low slope; this instream heterogeneity is due to variations in substrates, reflecting variations in riparian cover, stream size, incision and lateral erosion, and stream power (Rigon et al., 2012). These spatial differences in heterogeneity emphasize how difficult it is to choose the most relevant spatial scale in ecological studies. Leal et al. (2016) pointed out the different responses of instream habitat variables to land use changes and large-scale variables in the Amazon Basin, while Fernandes et al. (2013) showed that local and regional variables play different roles on fish assemblage attributes.
Conclusions
Considering that human impacts are increasing at high rates in the Amazon and that small streams are the most affected watercourses (Thieme et al., 2007; Davidson et al., 2012; Leal et al., 2016), it is important to characterize the natural conditions of streams. Our results highlighted the high environmental heterogeneity both in physical habitat and catchment variables of such waterbodies in the Amazon Basin and pointed out some links between local and regional scales; moreover, our results provide parameters for the reference conditions of small streams.
settings for better strategic planning. To protect biodiversity, for example, the fact that aquatic fauna is extremely dependent on the environmental structure of waterbodies must be considered (Vannote et al., 1980; Wang et al., 2003; Kemenes et al., 2010; Frederico et al., 2014; Kemenes and Forsberg, 2014; Portocarrero-Aya and Cowx, 2016), as well as the fact that natural variations across the Amazon Basin are one of the reasons behind its high diversity (Junk et al., 2007; Castello et al., 2013). Therefore, the creation of protected areas surrounding river basins should involve the highest possible variability of environmental conditions to capture high variations in species composition. We hope these results serve as a basis to support more efficient monitoring projects and restoration practices, establishing better scenarios for the future of the Amazon.
ACKNOWLEDGEMENTS
The authors are grateful to B. Prudente, H. Leão, and M. Ferreira for providing part of the data used in this study and to R. G. Frederico, B. Prudente, and T. Bernardi for their constructive comments on this manuscript. We also thank the The Brazilian National Council for Scientific and Technological Development (CNPq) for the PhD scholarship (NLB: 161350/2013-5) and productivity grants (LJ: 303252/2013-8; LFAM: 301343/2012-8; PSP 304002/2014-3). Amazon Foundation for the Support of Studies and Researches (FAPESPA) (003/2011; 085/2014; 128/2014) and CNPq (475611/2012-8; 481015/2011-6) provided funding for this study, while National Biodiversity Research Program (PPBio), Conservation International (CI-Brasil), Foundation for the Support and Development of Research (FADESP), Cikel, 33 Forest, and Agropalma Group provided logistic support.
REFERENCES
Anderson M, Gorley RN, Clarke RK. 2008. Permanova+ for Primer: Guide to software and statistical methods. PRIMER-E: Plymouth, UK.
Anderson MJ. 2001. A new method for non‐parametric multivariate analysis of variance. Austral ecology 26: 32-46.
Anderson MJ. 2006. Distance‐based tests for homogeneity of multivariate dispersions. Biometrics 62: 245-253. DOI: 10.1111/j.1541-0420.2005.00440.x.
Barthem RB, Charvet-Almeida P, Montag LFA, Lanna AE. 2004. Amazon Basin, GIWA Regional Assessment 40b. University of Kalmar: Kalmar, Sweden.
Behling H, Costa ML. 2000. Holocene environmental changes from the Rio Curuá record in the Caxiuanã region, eastern Amazon Basin. Quaternary Research 53: 369-377. DOI: 10.1006/qres.1999.2117.
Beibei Z, Ming’an S, Hongbo S. 2009. Effects of rock fragments on water movement and solute transport in a Loess Plateau soil. Comptes Rendus Geoscience 341: 462-472. DOI: 10.1016/j.crte.2009.03.009.
Bleich ME, Mortati AF, André T, Piedade M. 2016. Structural dynamics of pristine headwater streams from Southern Brazilian Amazon. River Research and Applications 32: 473-482. DOI: 10.1002/rra.2875.
Callisto M, Alves CBM, Lopes JM, Castro MA. 2014. Condições ecológicas em bacias hidrográficas de empreendimentos hidrelétricos. CEMIG: Belo Horizonte, Brazil.
Castello L, McGrath DG, Hess LL, Coe MT, Lefebvre PA, Petry P, Macedo MN, Renó VF, Arantes CC. 2013. The vulnerability of Amazon freshwater ecosystems. Conservation Letters 6: 217-229. DOI: 10.1111/conl.12008.
Chaves J, Neill C, Germer S, Neto SG, Krusche A, Elsenbeer H. 2008. Land management impacts on runoff sources in small Amazon watersheds. Hydrological Processes 22: 1766-1775. DOI: 10.1002/hyp.6803.
Davidson EA, Araújo AC, Artaxo P, Balch JK, Brown IF, Bustamante MMC, Coe MT, DeFries RS, Keller M, Longo M, Munger JW, Schroeder W, Soares-Filho BS, Souza Jr CM, Wofsy SC. 2012. The Amazon Basin in transition. Nature 481: 321-328. DOI: 10.1038/nature10717. Fagundes CK, Vogt RC, De Marco Júnior P. 2016. Testing the efficiency of protected areas in the
Amazon for conserving freshwater turtles. Diversity and Distributions 22: 123-135. DOI: 10.1111/ddi.12396.
Fernandes IM, Lourenço LS, Ota RP, Moreira MM, Zawadzki CH. 2013. Effects of local and regional factors on the fish assemblage structure in Meridional Amazonian streams. Environmental biology of fishes 96: 837-848. DOI: 10.1007/s10641-012-0079-1.
Frederico RG, De Marco P, Zuanon J. 2014. Evaluating the use of macroscale variables as proxies for local aquatic variables and to model stream fish distributions. Freshwater Biology 59: 2303-2314. DOI: 10.1111/fwb.12432.
Frissell CA, Liss WJ, Warren CE, Hurley MD. 1986. A hierarchical framework for stream habitat classification: viewing streams in a watershed context. Environmental management 10: 199-214.
Grabowski RC, Surian N, Gurnell AM. 2014. Characterizing geomorphological change to support sustainable river restoration and management. Wiley Interdisciplinary Reviews: Water 1: 483-512. DOI: 10.1002/wat2.1037.
Hoover TM, Richardson JS, Yonemitsu N. 2006. Flow-substrate interactions create and mediate leaf litter resource patches in streams. Freshwater Biology 51: 435–447. DOI:10.1111/j.1365-2427.2005.01499.x
Hughes RM, Larsen DP, Omernik JM. 1986. Regional reference sites: a method for assessing stream potentials. Environmental management 10: 629-635.
Hynes HBN. 1975. The stream and its valley. Verhandlungen der Internationalen Vereinigung fur Theoretische und Angewandte Limnologie 19: 1-15.
Junk WJ, Soares MGM, Bayley PB. 2007. Freshwater fishes of the Amazon River basin: their biodiversity, fisheries, and habitats. Aquatic Ecosystem Health & Management 10: 153-173. DOI: 10.1080/14634980701351023.
Kaufmann PR, Levine P, Robison EG, Seeliger C, Peck DV. 1999. Quantifying physical habitat in wadeable streams. EPA/620/R-99/003. U.S. Environmental Protection Agency: Washington, USA.
Kemenes A, Forsberg BR. 2014. Factors influencing the structure and spatial distribution of fishes in the headwater streams of the Jaú River in the Brazilian Amazon. Brazilian Journal of Biology
74: S23-S32. DOI: dx.doi.org/10.1590/1519-6984.06812.
Kemenes A, Forsberg BR, Magalhães C, Anjos H. 2010. Environmental factors influencing the community structure of shrimps and crabs (Crustacea: Decapoda) in headwater streams of the Rio Jaú, Central Amazon, Brazil. Pan-American Journal of Aquatic Sciences 5: 36-46. Leal CG, Pompeu PS, Gardner TA, Leitão RP, Hughes RM, Kaufmann PR, Zuanon J, Paula FR,