Temporal variations in the availability of feeding resources are known to be responsible for diet plasticity of tropical fishes (KNÖPPEL 1970). The daily continuous food ingestion often char-acterizing tropical fishes, and reflected by relatively fast meta-bolic processes, hampered proper daily feeding rhythm defini-tion (FONTELES FILHO 1989, PAULY 1994). As a result, difficulties are often encountered to estimate daily food consumption and energetic contribution of each food items for a given predator. In addition, a proper identification of the preys, specially of fish larvae or juveniles, is limited by their advanced digestion state (TORNO 1976).
Many studies on fishes trophic ecology include a quali-tative approach of the diet through the identification of the most abundant preys present in the stomach. However, proper construction of trophic models also require data on preys abun-dance and biomass, as well as additional information on the way each of these food items contributes to the energetic flow
within the aquatic ecosystem. Therefore, as already explained by WORTHMANN (1979) it appears as fundamental to first restore size and body weight of all ingested preys, to better under-stand their contribution in the food chain.
This study aims to first of all, estimate morphometrical relationships of Stelliferrastrifer (JORDAN, 1889), Stellifernaso (JOR -DAN, 1889) and Macrodonancylodon (BLOCH & SCHNEIDER, 1801) preys, to subsequently calculate average biomass and energetic values of the ingested food groups, in accordance to the devel-opment stage of the predator.
MATERIAL AND METHODS
In order to define the food groups more frequently in-gested by each predator, 1.086 stomachs (469 for Macrodon ancylodon, 459 for Stelliferrastrifer, and 158 for S.naso) from fishes of different sizes were dissected. Once all fed items iden-tified and gathered into taxonomic groups, the indigestible
Sciaenid
Sciaenid
Sciaenid
Sciaenid
Sciaenid Macr
Macr
Macr
Macr
Macrodon
odon
odon
odon
odon
ancylodon
ancylodon
ancylodon (Bloch & Schneider),
ancylodon
ancylodon
(Bloch & Schneider), and the congener
(Bloch & Schneider),
(Bloch & Schneider),
(Bloch & Schneider),
and the congener
and the congener
and the congeneric f
and the congener
ic f
ic f
ic f
ic fishes
ishes
ishes
ishes
ishes
Stellif
Stellif
Stellif
Stellif
Stellifer
er
er
er
er rrrrrastrif
astrif
astrif
astrif
astrifer
er
er
er (J
er
(Jor
(J
(J
(J
or
or
ordan) and
or
dan) and
dan) and
dan) and
dan) and Stellif
Stellif
Stellif
Stellif
Stellifer
er
er naso
er
er
naso
naso
naso
naso (J
(J
(J
(J
(Jor
or
or
or
ordan) (Pisces,
dan) (Pisces,
dan) (Pisces,
dan) (Pisces, Per
dan) (Pisces,
Per
Per
Percif
Per
cif
cif
cifor
cif
or
or
or
ormes)
mes)
mes)
mes)
mes)
in the Caeté Estuar
in the Caeté Estuar
in the Caeté Estuar
in the Caeté Estuar
in the Caeté Estuary
y
y
y,,,,, Norther
y
Norther
Norther
Northern Coast of Br
Norther
n Coast of Br
n Coast of Br
n Coast of Br
n Coast of Brazil
azil
azil
azil
azil
Mauricio Camargo & Victoria Isaac
Laboratório de Biologia Pesqueira e Manejo de Recursos Aquáticos, Universidade Federal do Pará. Avenida Tancredo Neves 2651, 66077-530 Belém, Pará, Brasil. E-mail: zorro@ufpa.br; victoria@amazon.com.br
ABSTRACT. A quantitative method to estimate fish feeding consumption and energy intake from different food categories through the reconstruction of ingested preys based on hard not digestible body structures is presented. In order to establish the equations of the functional relationships between preys weight and body structures, stomachs of 1.086 specimens of Macrodonancylodon (Bloch & Schneider, 1801), Stelliferrastrifer (Jordan, 1889), and Stellifernaso (Jordan, 1889) fish species were dissected. Consequently, preys reconstruction enabled a quantitative evaluation of food categories consumption. Results indicate a marked difference in diet composition and energy requirements according to fish species ontogenetic development.
KEY WORDS. Energetic values, feeding ingestion rates.
RESUMO. Um método quantitativo para se estimar o consumo alimentar e o aporte energético das diferentes categorias alimentares é apresentado através da reconstrução das presas ingeridas com base em estruturas corporais não digeríveis. Para tal, o presente estudo estabelece, através do exame dos conteúdos estomacais de 1.086 exemplares dissecados de Macrodon ancylodon (Bloch & Schneider, 1801), Stellifer rastrifer (Jordan, 1889) e Stellifernaso (Jordan, 1889), as equações das relações funcionais entre o peso das presas e estruturas corporais. Com as categorias reconstruídas foi possível quantificar o alimento ingerido pelos espécimes. Os resultados indicaram que existe uma marcada diferença, tanto na composição das categorias alimentares, bem como no aporte energético acompanhando o desenvolvimento ontogênico do predador.
body parts such as exoskeletons, otoliths and eyes, were picked up and identified to the highest taxonomic level possible.
In parallel, preys most commonly encountered in fish stomachs were collected in the wild within the same estuary, then weighted, measured and dissected in order to assess the size of all the indigestible parts already found in the stomachs of the three predators.
Zooplanktonic organisms were measured (mm), from the head up to the caudal thorns (Lct), using a micrometric magni-fying glass. Length-weight relationships, were then established for five or six length classes (mm) including 100 to 200 indi-viduals pending on the species and defined based on the fish size frequency data. Average individual body weight was esti-mated through the total weight (g) obtained for each length class divided by the number of weighed individuals. Results were plotted, and the regression between weight and length was estimated using the least squares method.
In the case of crustacean decapods, the indigestible struc-tures included eyes and carapace. Relations between carapace length (Lcar) and ocular peduncle (Lpeye) of 48 individuals of
Acetesamericanus Ortmann, 1893, and between carapace length (Lcar) and eye diameter (Deye) of 128 individuals of Xiphopenaeus kroyeri (Heller, 1862) were established. In the case of the crus-tacean Uca sp., the relationship was established between body weight (g) and carapace width Wcar (mm) of the individuals. Obtention of these relationships enabled subsequent plotting of preys body structure size vs preys weight and definition of mathematical equations for the obtained regressions
Collection of otoliths from preyed fishes and subsequent study of their shape in relation to preys size enabled to define mathematical equations between these two parameters. Hence sagitta width Wotol (mm) was plotted vs preys standard length (mm) (Ls) or preys weight, and respective linear or exponen-tial regressions were calculated.
Mathematical functions between preys body parts were given as linear regressions, obtained after logarithmic trans-formations in the case of exponential relationships. Once the mathematical relations established, body weights of various length classes of each food categories were reconstructed. Av-erage consumption of all three studied predators was assessed through the sum of weights of all feeding categories per de-fined length class. Additionally, lengths at first maturation as defined by CAMARGO & ISAAC (in press) enabled dividing the predators into three ontogenic groups, namely the younger, pre-adult and adult groups. Predators energetic intake (Kcal) for each food category, and expressed per gram of predator, was calculated based on the energetic contents of the preys (Kcal/gram of preys), as available in the literature.
RESULTS
Diet composition of the three predator species varies along the ontogeny. While young individuals feed more ex-clusively on zooplanktonic organisms such as Pseudodiaptomus
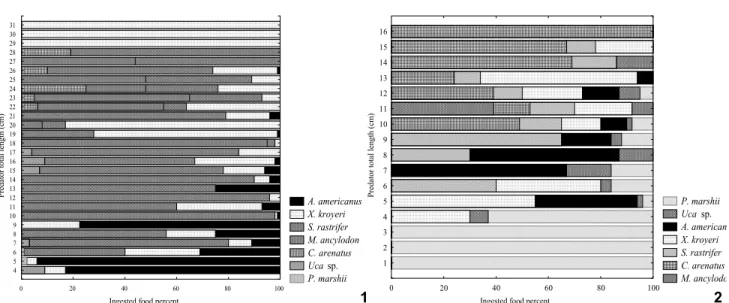
marshi Wright, 1936 and Acartialilljerborgii Giesbrecht, 1889 copepods, pre-adults also include in their diet invertebrates like Acetesamericanus, Xiphopenaeuskroyeri, and Uca sp. Other hand, adults can also feed on young fishes like Cathorops arenatus (Valenciennes, 1840), Macrodonancylodon, and Stellifer rastrifer, hence demonstrating a cannibalism behavior (Figs 1-3). Fresh body weight of the preys, obtained through math-ematical equations themselves issued from body structure re-lationships, is presented in table I.
For each of the three preyed species, namely: Stellifer rastrifer, Macrodonancylodon and Cathoropsarenatus, linear equa-tions between otolith width and individual standard length, and exponential equations between body weight and otolith width or standard length were established. It is important to note that otoliths, known as body growth indicators, present an exponential relationship with fish body weight up to the juvenile stage, after which parameters of the equation change. Therefore, as in this case predators consume exclusively young organisms, equations were only defined for young preys.
Once preys weight reconstructed, food consumptions (per gram of body weight) were defined by predator group class of 1 cm. In the case of juveniles Macrodon ancylodon (Lt ≤ 21 cm) consumption rate ranged from 0.002g of prey/g of preda-tor to 0.800g of prey/g of predapreda-tor. For specimens of Lt ≥ 21 cm, consumption rate was comprised between 0.001 g of prey/g of predator and 0.400 g of prey/g of predator. Results indicate that M.ancylodon of a total length comprised between 4 and 6 cm fed preferentially on juvenile decapods of Sergestidae (Acetes americanus) and Penaeidae (Xiphopenaeus kroyeri). Acartia lilljeborgii and Pseudodiaptomusmarshi were the more common copepods consumed by the three predators; however due their small size they represented a relatively small proportion of the overall stomach contents. Above 6 cm standard length, diet of the younger specimens was complemented by fish juveniles, principally Stelliferrastrifer and Macrodonancylodon and to a lower extends Cathoropsarenatus (Fig. 1).
In the case of juveniles Stelliferrastrifer of length ranging between 1 and 10 cm, results indicate a consumption rate com-prised between 0.001 g of prey/g of predator to 0.085 g of prey/ g of predator. For bigger individuals up to 16 cm of length, the rate ranged between 0.007 g of prey/g of predator and 0.075 g of prey/g of predator. Juveniles of 1 to 3 cm of total length fed mainly on zooplankton, and especially on copepods such as
Pseudodiaptomusmarshi. At 4 cm of total length, this diet was complemented by juveniles of crustacean decapods like Acetes, Xiphopenaeus and Uca sp. At last, diet of bigger individuals (i.e.
≥ 6 cm standard length) also included fish juveniles, mainly
Ingested food percent
Predator total length (cm)
A. americanus X. kroyeri S. rastrifer M. ancylodon C. arenatus Uca sp. P. marshii
0 20 40 60 80 100
4 5 6 7 8 9 10 11 12 13 14 15 16 17 18 19 20 21 22 23 24 25 26 27 28 29 30 31
length. Specimens of 4 cm fed mainly on copepods like
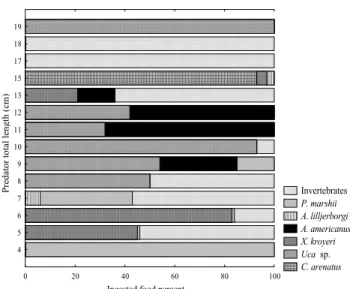
Pseudodiaptomus marshii and Acartia lilljerborgi, while individu-als of standard length ³ 5 cm individu-also eat decapods and barnacles larvae. Larger individuals showed preferences for crustacean decapods of Uca sp. and Acetesamericanus, and to a lower ex-tend for juveniles of Cathoropsarenatus (Fig. 3).
Based on the conversion factors mentioned in the litera-ture for the most common fed items, the different categories were transformed into energy units (Kcal) (Tab. II).
Based on the performed calculations presented in table II, the relative energetic intake for each prey and by predator was estimated (Tab. III).
The main energetic intake in the diet was due to fishes, whose size increases concomitantly with predators size.
DISCUSSION
The main energy flow in the Caeté Estuary was found to be of benthic origin (WOLFFet al. 2000). The present results
Ingested food percent
Predator total length (cm)
P. marshii Uca sp. A. american X. kroyeri S. rastrifer C. arenatus M. ancylodo
0 20 40 60 80 100
1 2 3 4 5 6 7 8 9 10 11 12 13 14 15 16
1
2
Figures 1-2. Percentage of food categories in ingested by length class of (1) Macrodonancylodon and (2) Stelliferrastrifer.
Table I. Mathematical relatinships established for various body structures of the main food resources of M. ancylodon, S. rastrifer, and S. naso.
Feeding Category Species Equation Range (mm) n R2
Zooplankton Pseudodiaptomus marshii Weight = 7x10⁻⁵ *L
ct
3.47 0.89-1.27 750 0.96
Acartia lilljerborgi Weight = 4.4x10⁻⁵*L
ct
3.85 0.82-1.16 860 0.95
Crustaceans Decapods Acetes americanus Lcar = -0.128+3.537LPeye
Weight = 0.01*CPeye
4.64 0.65-1.65 48
0.98 0.82
Xiphopenaeus kroyeri Lcar = 3.15+5.340*Deye
Weight = 5x10⁻⁴ *L car 3.10 0.61-2.21 4-16 128 140 0.85 0.97
Uca sp. Weight = 3x10⁻⁴*W
Car
3.17 7-19 27 0.98
Fishes Cathorops arenatus Ls = -12.17+24.94Wotol
Weight = 9x10⁻⁶*L s 2.86 1.6-3.2 27-70 47 47 0.96 0.98
Stellifer rastrifer Ls = -8.24+26.02Wotol
Weight = 9.1x10⁻³*L s
3.04
1.34-3.40
2.1-8.2 48
0.96 0.97
Macrodon ancylodon Ls = 5.23+27.8*Wotol
Weight = 4x10⁻⁶*L s
3.25
0.6-2.2
28-78 43
indicate that demersal preys constitute the main feeding re-sources for the three fish species studied. However, it was showed clear difference in the qualitative composition of the diet between individuals of different sizes but belonging to a same species. This variation was related to predators digestive structures efficiency as a function of individual age, and to preys availability within the estuary. Based on the energetic
input from planktonic preys, it can be hypothesized that juve-niles have a higher feeding frequency in order to compensate for the relatively low supply in energy provided by their diet. On the other hand, the adults, who feed on bigger preys, would present a lower feeding frequency. The relatively high frequency of fishes and shrimps in predators stomachs, could be explained by the relatively high energetic value of these preys. The present results support WEATHERLEY (1972) finding, who reported higher
metabolic rates for young fishes when compared to the adults, hence suggesting bigger feeding requirements of the formers. The reconstruction of preys size and weight for several groups of vertebrate has already been applied to different aquatic environments as in HANSELetal. (1988), and PRENDA & GRANADO-LORENCIO (1992). This methodology, pursued in details, can provide accurate information on the energy requirements of an individual all along its ontogeny, but also on the rela-tionships between preys and predators.
ACKNOWLEDGEMENTS
We are grateful to Dr Valérie Sarpédonti for her english corrections.
REFERENCES
BUTLER, M. & H.G. DAM. 1994. Production rates and characteristics of fecal pellets of the copepod Acartiatonsa under simulated phytoplankton bloom conditions: implications for vertical flu-xes. MarineEcologyProgressSeries, Oldendorf, 114: 81-91. CAMARGO, M. & V. ISAAC. (in press). Reproductive biology in
relation to the spatio-temporal distribution of Stellifer ras-trifer, Stellifer naso and Macrodon ancylodon (perciformes-Sciaenidae) in the Caeté Estuary, Northern Coast of Brazil. BrazilianJournalofOceanography, São Paulo.
GOLLEY, F.B. 1961. Energy values of ecological materials. Ecology, New York, 42 (3): 581-584.
FONTELES FILHO, A.A. 1989. Recursospesqueiros: Biologiae Di-nâmicaPopulacional. Fortaleza, Imprensa Oficial do Cea-rá, 296p.
HANSEL, H.C.; S.D. DUKE; P.T. LOFY & G.A. GRAY. 1988. Use of diagnostic bones to identify and estimated original lengths of ingested prey fishes. Transactions of AmericanFish Society, Washington, 117: 55-62.
HONJO, S. & M.R. ROMAN. 1978. Marine copepod fecal pellets: production, preservation and sedimentation. Journal of MarineResearch, New Haven, 36: 45-57.
KNÖPPEL, H.A. 1970. Food of Central Amazonian fishes. Contri-bution to the nutrient-ecology of Amazonian rain-forest streams. Amazoniana, Kiel, 2 (3): 257-352.
PAULY, D. 1994. Onthesexoffishandthegenderofscientists: essaysinfisheriesscience. London, Chapman & Hall, 250p. PRENDA, J. & C. GRANADO-LORENCIO. 1992. Claves de identificación de Barbussclateri, Chondrostomapolylepis, Leucisuspyrenaius
y Cyprinuscarpio mediante algunas de sus estructuras óseas.
Table II. Caloric values (kcal) for food categories per fresh weight unit (g), as indicated in the litterature.
Feeding Categories Fresh Weight
(Kcal/g) Source for Calculation
Peneidae 1.09 THAYERet al. (1973)
Fishes 1.54 WHITFIELD & BLADER (1980)
Acartia tonsa 0.79 HONJO & ROMAN (1978)
BUTLER & DAM (1994)
Pseudodiaptomus marshi 0.83 UYE & KANAME (1994 )
Uca sp. 0.45 GOLLEY (1961)
Table III. Energetic contribution (Kcal) of each food categories expressed per body weight unit (g) of predator.
Feeding Categories Predator Kcal/g
M. ancylodon S. rastrifer S. naso
Fishes 0.031-1.170 0.031-0.072 0.005-0.054
Acetes-Xiphopenaus 0.011-0.087 0.001-0.092 0.002-0.008
Uca sp. 0.005-0.007 0.001-0.002 0.0001-0.018
Pseudodiaptomus-Acartia 0.004-0.008 0.001-0.002 0.001-0.004
Ingested food percent
Predator total len
g
th
(cm
)
Invertebrates P. marshii A. lilljerborgi A. americanus X. kroyeri Uca sp. C. arenatus
0 20 40 60 80 100
4 5 6 7 8 9 10 11 12 13 15 17 18 19
DoñanaActaVertebrata, Sevilla, 19 (1-2): 25-36. THAYER, G.W.; W.E. SCHAAF; J.W. ANGELOVIC, & M.W. LACROIX, 1973.
Caloric measurements of some estuarine organisms. Fishery Bulletin, Seattle, 71: 289-296.
TORNO, A 1976. Descripcion y comparação de los otólitos de algunas familias de peces de la plataforma Argentina. Re-vista del Museo Argentino de Ciencias Naturales “BernardinoRivadavia”, Buenos Aires, 12 (4): 27-43. UYE, S.I. & K. KANAME. 1994. Relations between fecal pellet
volumeand body size for major zooplankters of the Inland Sea of Japan. JournalofOceanography, Japan, 50: 43-49. WEATHERLEY, A.H. 1972. Growth and ecology of fish
popula-Received in 30.IX.2002; accepted in 26.I.2004.
tions. Londres, Academic Press, 293p.
WHITFIELD, A.K. & S.J.M. BLADER. 1980. The diet of Atilax
paludi-nosus (water mongoose) at St. Lucia, South Africa. Mamma-lia, Paris, 44: 315-318.
WOLFF, M; V. KOCH, & V. ISAAC. 2000. A trophic flow model of the Caeté mangrove estuary (North Brazil) with considerations for the sustainable management of its resources. Estuarine CostalandShelfScience, Amsterdam, 50 (6): 789-803. WORTHMANN, H.A. 1979. A relação entre o desenvolvimento do