2017
UNIVERSIDADE DE LISBOA
FACULDADE DE CIÊNCIAS
DEPARTAMENTO DE BIOLOGIA VEGETAL
Dating evolution on island ecosystems: a case-study with the
Cape Verde terrestrial biodiversity
Ana Rita Leal Pena
Mestrado em Bioinformática e Biologia Computacional
Bioinformática
Dissertação orientada por:
Professora Doutora Maria Manuel Romeiras
Professor Doutor Octávio Salgueiro Paulo
i
ACKNOWLEDGEMENTS | AGRADECIMENTOS
First, I would like to express my sincere gratitude to both of my advisors Prof. Doutora Maria Romeiras and Prof. Doutor Octávio Paulo, for the continuous support, patience, motivation, and immense knowledge. The amount of work that went into this thesis wouldn’t at all be possible if not for their help and intelligent advice.
I would also like to express my sincere thanks to Doutora Raquel Vasconcelos (CIBIO/Universidade do Porto), for her support in reviewing and correcting many of the results, and for the great suggestions to help improve them.
A special thanks to Tiago Menezes for his helpful advice on running and improving the analysis with *BEAST2.
And of course, a special thanks to my family and friends, in particular to my sister, for the continuous motivation and support to finish this massive project.
ii
GENERAL CONTENTS
Resumo iii
Abstract vi
Acronyms and Abbreviations vii
Figures List viii
Tables List ix
1. INTRODUCTION
1.1. Bioinformatic tools for evolutionary biology………... 1
1.1.1. Main software packages………... 4
1.2. Macaronesia Islands as model systems in evolution………. 6
1.3. The study system – value of Cape Verde’s biodiversity for study evolution……… 7
1.4. Aims of the study……….. 11
2. MATERIALS AND METHODS 2.1. Data Collection………... 12
2.2. Data Analysis………... 13
2.2.1. Phylogenetic analyses………. 14
2.2.2. Divergence time estimation……… 15
2.2.3. Phylogenetic Networks………... 19
3. RESULTS 3.1. Phylogenetic analyses……….. 20
3.1.1 Separate mtDNA and nrDNA gene regions……….. 20
3.1.2. Combined data……….... 23
3.2. Divergence time estimation……… 29
3.3. Phylogenetic Networks…...……… 35
3.4. Reptiles richness and endemism………... 38
4. DISCUSSION 4.1. Using Bioinformatic tools to study evolution on island species ……… 40
4.2. Phylogenetic relationships among Cape Verde reptiles ……… 41
4.3. Patterns of islands diversity and diversification hypotheses ……… 43
5. FINAL REMARKS AND PERSPECTIVES ……….. 45
6. REFERENCES ………. 46
iii
RESUMO
A área da bioinformática nasceu da necessidade de desenvolver e utilizar metodologias capazes
de estudar grandes volumes de dados biológicos, em particular sequências de DNA ou
proteínas. Nos últimos anos diversas áreas científicas beneficiaram da introdução de
ferramentas computacionais especializadas em tarefas como a análise de dados e interpretação
de resultados biológicos. Na área da Biologia Evolutiva o desenvolvimento do conhecimento
foi substancial desde a introdução de métodos bioinformáticos, em especial nas análises
filogenéticas e datação da origem e diversificação das espécies. Atualmente é possível analisar
em larga escala sequências de DNA, recorrendo a vários métodos que permitem construir
filogenias informativas e bem suportadas. Particular interesse é colocado na origem da grande
diversidade de espécies endémicas existentes nas ilhas oceânicas, e neste âmbito, refira-se que
desde Darwin, que os ecossistemas insulares são considerados verdadeiros laboratórios naturais
para estudos evolutivos.
A região da Macaronésia (i.e. Açores, Madeira e Selvagens, Canárias e Cabo Verde) constitui
um hotspot de Biodiversidade, dentro da bacia do Mediterrâneo, sendo que, Cabo Verde é o
único arquipélago situado geograficamente numa região tropical. As 10 ilhas do arquipélago de
Cabo Verde apresentam uma grande diversidade de espécies terrestres e marinhas, muito delas
endémicas. De entre os principais grupos da fauna terrestre, refira-se os répteis, que dentro da
Região da Macaronésia constituem a maior radiação nas ilhas de Cabo Verde. Neste
arquipélago ocorrem três géneros que incluem 22 espécies endémicas (13 das quais restritas a
uma única ilha), nomeadamente: i) Chioninia, que inclui as espécies de escincídeos de Cabo
Verde; ii) Hemidactylus, que apresenta uma grande diversidade e distribuição por diversas
partes do Mundo; e iii) Tarentola, que para além de ser encontrado no arquipélago de Cabo
Verde, ocorre também nas Canárias e Selvagens, dentro da Região da Macaronésia.
O elevado número de endemismos e habitats ricos com uma elevada diversidade de espécies,
bem como existência de um grande número de sequências de DNA, pretendeu-se com este
estudo utilizar diferentes ferramentas bioinformáticas de modo a explorar a relações evolutivas
dos répteis nas ilhas de Cabo Verde. Também foram usados diferentes métodos de datação que
permitiram de forma robusta e inovadora, relacionar o tempo de divergência entre diferentes
espécies, contribuindo para compreender eventos evolutivos e padrões de colonização na
Região da Macaronésia.
A metodologia escolhida teve por base a consulta exaustiva de bases de dados públicas, como
o GenBank, que permitiu obter sequências de DNA para os répteis de Cabo Verde, bem como
de possíveis espécies ancestrais. As sequências, de DNA mitocondrial e DNA nuclear, foram
descarregadas em formato fasta, e utilizando o programa Geneious, foi possível efetuar revisões
e correções nas mesmas. O alinhamento foi também feito com recurso a esta ferramenta, que
disponibiliza vários pacotes acessórios, em concreto o programa de alinhamento MAFFT.
Outros três programas de domínio geral, BioEdit, DNASp e MEGA foram utilizados para
verificar a qualidade das sequências e dos alinhamentos. O programa DNASp foi também
utilizado para correr análises de polimorfismo e haplótipos, que foram depois úteis para análises
posteriores.
iv
Utilizando o programa MEGA, construímos árvores filogenéticas utilizando métodos simples,
como a Máxima Parcimónia, que permitiu verificar possíveis erros ou problemas nos dados.
Foi encontrado um elevado número de sequências, em particular para as espécies endémicas
em Cabo Verde, sendo que o número de sequências de genes de regiões do DNA mitocondrial,
era muito superior em relação aos genes do DNA nuclear. No total foram recolhidas 1725
sequências de DNA (1447 originárias de Cabo Verde), provenientes de 15 genes diferentes e
um total de 67 espécies de répteis. De modo a minimizar possíveis erros aquando a construção
das árvores, foi realizada uma análise preliminar para selecionar as melhores sequências. Esta
análise teve em conta a sua representatividade para cada espécie e gene (i.e., se o individuo a
qual pertencia tinha sequências disponíveis para outros genes), o alinhamento obtido e por fim
as árvores criadas com estes dados. Deste modo reduziu-se a redundância dos dados e o tempo
de processamento das várias análises, bem como a qualidade dos resultados obtidos. Para tal
foram realizadas várias análises filogenéticas para cada um dos genes, bem como criados
ficheiros concatenados, utilizando o programa Concatenator, dos genes mitocondriais,
nucleares e ambos, para analisar os resultados em conjunto. Para avaliar os modelos e partições
associados aos nossos dados, foram feitas análises com o programa PartitionFinder. Os modelos
e partições obtidos nestas análises foram depois introduzidos em três ferramentas de construção
de árvores filogenéticas - RAxML, MrBayes e BEAST (incluindo a versão mais recente e o
pacote *BEAST2) – que são atualmente os programas mais usados no estabelecimento das
relações filogenéticas. O primeiro programa (i.e. RaxML), utiliza o método de máxima
verosimilhança; complementarmente foi utilizando um outro programa – RAxMLGUi – que
facilitou a conexão direta para os servidores da plataforma Cipres Gateway. Esta plataforma
online, providencia servidores para diversas ferramentas de análise filogenética, tendo sido
usada para correr as nossas análises com o RAxML, MrBayes e BEAST. Deste modo, foi
possível reduzir substancialmente o tempo de processamento dos programas, bem como
providenciar um local secundário para guardar alguns dos dados. Para testar os resultados
obtidos com Inferência Bayesiana, utilizamos o programa MrBayes para as análises “clássicas”
e a ferramenta BEAST na sua versão base e utilizando a mais recente versão do pacote
*BEAST2, para fazer datações nas análises. Os resultados obtidos com estes programas foram
verificados com a ferramenta Tracer, para assegurar a convergência dos vários parâmetros
durante as várias corridas realizadas. Para além destas análises, pretendemos testar possíveis
eventos de recombinação e hibridização genética, tendo sido para o efeito construídas redes
filogenéticas para cada um dos géneros utilizando vários programas, como o SplitsTree4.
Os resultados obtidos explorando diferentes ferramentas bioinformáticas, permitiram construir
um grande número de árvores filogenéticas, reveladoras das relações evolutivas entre várias
espécies de répteis das ilhas da Macaronésia. De uma forma geral a topologia obtida foi
semelhante à obtida em estudos anteriores, com resultados ligeiramente melhores nas análises
que usaram Inferência Bayesiana. As redes filogenéticas criadas apresentaram um reticulado
que parece indiciar que terão de facto ocorrido a presença de eventos de hibridização e
recombinação nas linhagens de Cabo Verde nos três géneros analisados, sendo necessárias
análises complementares para clarificar estes resultados.
v
Os resultados sugerem diferentes origens para cada género, e revelaram diferentes padrões e
eventos de colonização nas ilhas de Cabo Verde. O género Chioninia terá tido origem em
linhagens africanas, apresentando uma maior semelhança ao género Trachylepis, oriundo de
África com exceção de um espécime do Brasil. As espécies de Hemidactylus endémicas em
Cabo Verde apresentam uma relação com espécies de São Tomé e Príncipe (África), Trindade
e Brasil (América Latina), o que põe em evidência a grande capacidade de dispersão deste
género, inclusive através do Oceano Atlântico. Por fim, as espécies de Tarentola endémicas em
Cabo Verde, parecem ter evoluído de ancestrais que colonizaram outras ilhas da Macaronésia
(i.e. Canárias e Selvagens) e que diversificaram no Norte de África, com um possível ancestral
na América Central. A aplicação do relógio molecular usando métodos Bayesianos (MrBayes,
BEAST e *BEAST2) permitiu testar hipóteses evolutivas, sugerindo que o género Chioninia
terá sido o primeiro a colonizar Cabo Verde, a partir de ancestrais da região Centro Africana,
tendo colonizado este arquipélago há cerca de 16,7 milhões de anos. As espécies de
Hemidactylus terão colonizado as ilhas de Cabo Verde a partir de espécies ancestrais africanas
que diversificaram nas ilhas entre 2,4 – 11,5 milhões de anos. Por fim, o género Tarentola
poderá ter tido origem no final da época do Mioceno (5,8 – 7,5 milhões de anos), com uma
grande diversificação no arquipélago entre 5,1 – 5,8 milhões de anos, a partir de ancestrais das
ilhas das Canárias e do Norte de África.
Os resultados obtidos no presente estudo oferecem uma nova compreensão sobre a história
evolutiva de um dos maiores grupos da fauna terrestre das ilhas da Macaronésia – os répteis,
que apresentam o maior centro de diversidade nas ilhas de Cabo Verde. Com o elevado número
de métodos, programas e dados utilizados, foi possível construir árvores filogenéticas e aplicar
técnicas de datação molecular inovadoras, como é o caso do *BEAST2, para os répteis de Cabo
Verde. Contudo, para além dos tempos de divergência das diferentes espécies, podia-se ter
explorado as áreas de distribuição ancestral e com base nos resultados dessas análises propostos
cenários biogeográficos, para além dos evolutivos agora apresentados.
Por fim, refira-se que os ecossistemas insulares, reconhecidos como laboratórios naturais,
mostraram mais uma vez serem são modelos únicos para testar métodos e programas
bioinformáticos, evidenciando a grande utilidade da existência de programas e tutoriais
disponíveis online e gratuitamente, permitindo ter uma base muito bem suportada para explorar
qualquer análise na área da Biologia Evolutiva.
vi
ABSTRACT
The interdisciplinary field of bioinformatics was born from the need to develop and employ methodologies to study large amounts of biological data, namely proteins and DNA. Many science areas benefited greatly from the introduction of specialized and powerful tools that improved the implementation of databases, data analysis and biological interpretations. For evolutionary study fields such as phylogenetics, the knowledge jump has been substantial since the introduction of bioinformatic methods in their analysis. Making use of highly advanced software packages is now possible to perform high-throughput DNA sequencing, and thoroughly analyse this data with several methods of phylogenetic inference, to obtain informative and well supported phylogenies. Even though many important evolutionary discoveries were made in the last few years, understanding the evolutionary origin of biological diversity on island ecosystems is still a critical issue within the hotspot area of the Macaronesia Islands (i.e. Azores, Canary Islands, Madeira and Cape Verde). One of the least studies archipelagos is Cape Verde, which houses a huge diversity of endemic species whose evolution is still largely understudied. In these islands, the reptiles are one of the most diverse radiations among the terrestrial groups, hosting three genera with 22 endemic species. Chioninia, a group of skins formerly included in the genus Mabuya; Hemidactylus, a widespread and diverse group of house geckos; and Tarentola, a genus of wall geckos that also occurs on other Macaronesia archipelagos. Some of these species are single islands endemics (SIE) and are threatened species, which puts them at high risk of extinction. This study aims to reconstruct a phylogeny for this group with large-scale taxon sampling using a wide sample of the most current bioinformatic tools available. DNA data was retrieved from the Genbank and subsequently analysed using several software packages for alignment, model fitting and finally phylogenetic inference. The collected data was composed of 1725 DNA sequences (1447 coming from Cape Verde) and 15 different genes, which originated from a total of 67 reptilian species. Both approaches – Maximum Likelihood and Bayesian Inference – were used to achieve more thorough results. Divergence time estimation was also performed using a classical BEAST and *BEAST2 across the three reptile groups to assess their evolution story in the Cape Verde Islands. Phylogenetic networks were also created to assess possible hybridization or recombination events in the Cape Verdean reptiles. This macroevolutionary perspective also combines data from ecology and distribution of the species to an integrated vision of Cape Verde evolution of terrestrial biodiversity. The results suggest different origins for each genus and different colonization patterns and events along the Cape Verde Islands, ranging from the Macaronesia region to Africa and South America: i) Chioninia originated 21.7 – 39.6 Mya, radiating along the islands 14.9 – 18.5 Mya, with a probable colonization from central African regions; ii) the Hemidactylus species having colonized the archipelago 2.4 – 11.5 Mya and originating from African ancestral species; and iii) the endemic Cape Verdean Tarentola are likely descendants of Northern African and Canary Islands lineages, that colonized the islands during the end of Miocene (5.8 – 7.5 Mya) and later diversified (5.1 – 5.8 Mya). In conclusion, presently the huge amount of DNA sequences available in international databases and the most up-to-date bioinformatic tools and methodologies, allow us to contribute to better understand the origin and colonization of insular ecosystems, using insular endemic species, as an excellent case-study in the field of Evolutionary Biology.
vii
ACRONYMS AND ABBREVIATIONS
ACM4 - Acetylcholinergic Receptor M4 AICc - corrected Akaike Information Criterion
BEAST - Bayesian Evolutionary Analysis Sampling Trees *BEAST - StarBEAST
BI - Bayesian Inference
C-mos - Oocyte maturation factor Mos COI - Cytochrome c oxidase subunit I cyt b - Cytochrome B
DDBJ - DNA Data Bank of Japan DNA - Deoxyribonucleic Acid
EMBL - European Molecular Biology Laboratory ESS – Effective Sample Size
GIGO - Garbage In, Garbage Out HPD - Highest Probability Density
IUCN - International Union for Conservation of Nature MC1R - Melanocortin 1 Receptor
ML - Maximum-Likelihood mtDNA - Mitochondrial DNA Mya – Millions of years ago nDNA - Nuclear DNA
NGS – Next Generation Sequencing NJ - Neighbour Joining
PDC - Phosducin
RAG2 - Recombination activating gene 2
RAxML - Randomized Axelerated Maximum Likelihood SIE - Single Islands Endemics
viii
FIGURES LIST
Figure 1.1: Map of the Macaronesian.
Figure 1.2: Map of the Cape Verde Islands.
Figure 2.1: Diagram of the workflow performed along this study.
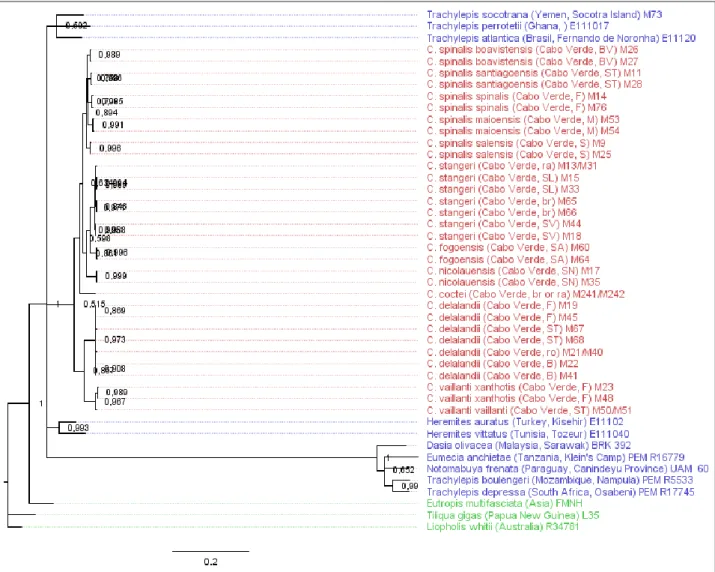
Figure 3.1: Phylogenetic tree obtained in the BI analysis using external outgroups for the combined
set with all the genes for Chioninia.
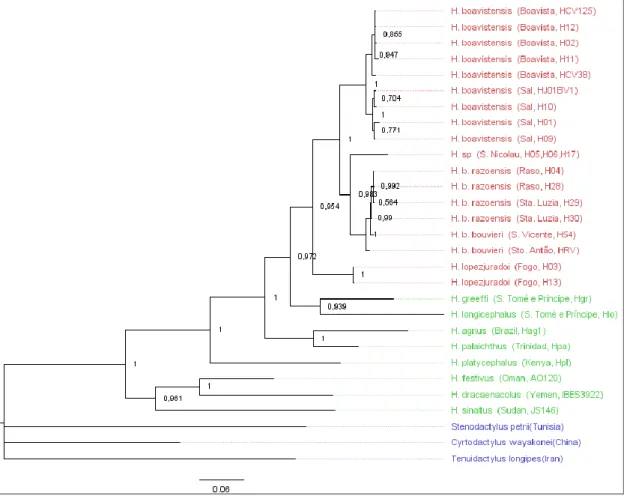
Figure 3.2: Phylogenetic tree obtained in the BI analysis using external outgroups for the combined
set with all the genes for Hemidactylus.
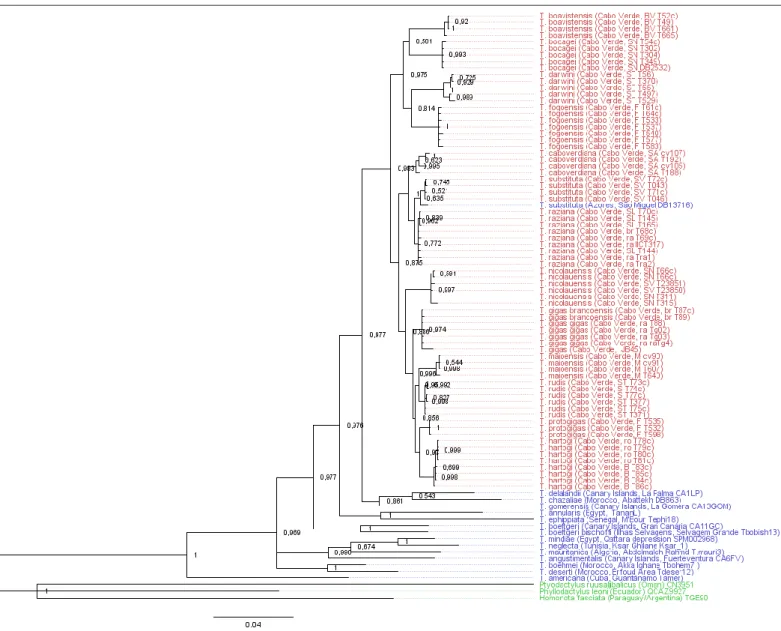
Figure 3.3: Phylogenetic tree obtained in the BI analysis using external outgroups for the combined
set with all the genes for Tarentola.
Figure 3.4: Results from BEAST for the Chioninia genus with divergence times estimated using all
the genes.
Figure 3.5: Results from BEAST for the Hemidactylus genus with divergence times estimated using
all the genes.
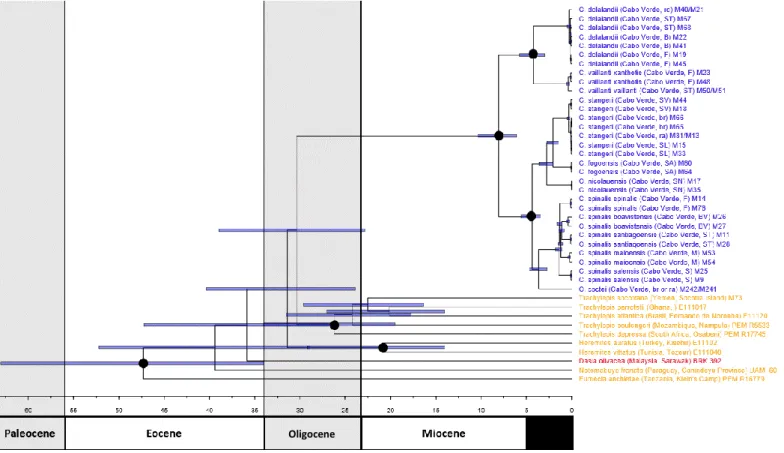
Figure 3.6: Results from BEAST for the Tarentola genus with divergence times estimated using all
the genes.
Figure 3.7: Results from *BEAST2 for the Chioninia genus with divergence times estimated using all
the genes.
Figure 3.8: Results from *BEAST2 for the Hemidactylus genus with divergence times estimated
using all the genes.
Figure 3.9: Results from *BEAST2 for the Tarentola genus with divergence times estimated using all
the genes.
Figure 3.10: Phylogenetic networks created for Hemidactylus.
Figure 3.11: Phylogenetic networks created for Chioninia.
Figure 3.12: Phylogenetic networks created for Tarentola without the Azorean specimen.
Figure 3.13: Phylogenetic networks created for Tarentola with the Azorean specimen.
ix
TABLES LIST
Table 1.1: Summary of the software packages used in this study, competing programs and the
advantages we found in their use.
Table 1.2. List of the reptile species and subspecies found in the Cape Verde archipelago
Table 2.1: Summary of the partitions obtained in PartitionFinder in the final version of the analysis in
both sets of analysis.
Table 2.2: Fossil calibrations used for estimating divergence dates in BEAST (adapted from Zheng &
Wiens 2016).
Table 2.3 Calibrations points used in the *BEAST2 analysis for all three groups.
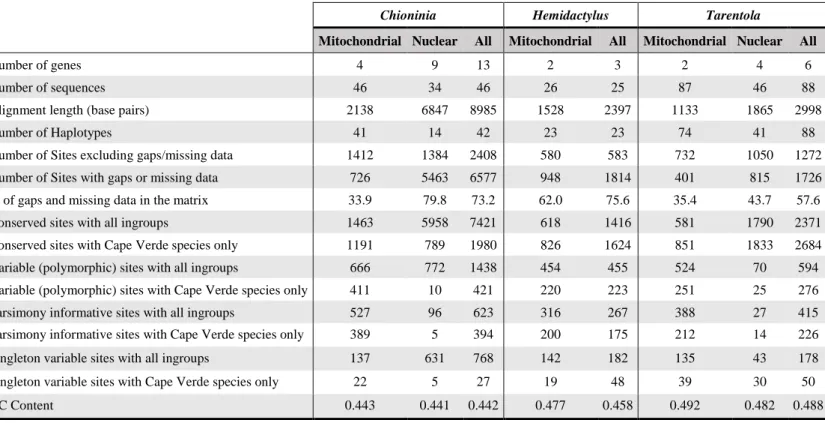
Table 3.1: Summary of the polymorphism data of the final set of sequences used in our analysis for
1
1. INTRODUCTION
1.1
Bioinformatic tools for evolutionary biology
Since the introduction of computational analysis, the number of available tools for science research has grown exponentially and as the complexity of the software’s evolved, so did the necessity for specialised researchers to use them. The field of bioinformatics was born of the need for a field that focused in analysing a high volume of molecular data, such as DNA or proteins, using the more current tools available, and has since then evolved itself in more resourceful and extensive study field (Shenbagarathai 2007).
We can categorize bioinformatics in more specialized areas, specifically the development and implementation of databases; data analysis and data mining; and interpretation of biological data (Moore 2007). These days most biological studies have some type of bioinformatic analysis, and it’s fairly common to make use of multiple options.
Starting in the collection and storage of data we have today numerous databases around the world available for this effect. One of such databanks is GenBank (Clark et al. 2016), which storages and organizes nucleotide sequences while also making them publicly accessible and ready to use. Other biology focused databases include EMBL (Kulikova et al. 2007), UniProt (EMBL et al. 2013), DDBJ (Kodama et al. 2012) and many others, all of them free and available online, allowing an ever growing global network of information that continues to grow, giving researchers an almost never-ending flow of new data.
One of the other issues that rose from the high output of data was its processing. Starting in sequencing, the past 30 years have been astonishing, with more than a million-fold improvement in the rate of sequence generation (Stratton et al. 2009), particularly with the introduction of Next generation sequencing (NGS). With such an extraordinary quantity of sequences being created, the alignment algorithms also grew and adapted.
A variety of alignment software’s exist today, which with its algorithm and diverge functionalities proved invaluable for processing the amount of sequenced data. Some of these include MAFFT (Katoh & Standley 2013), BLAST (Altschul et al. 1990), MUSCLE (Edgar 2004) and Clustal (Larkin et al. 2007), which have undergone countless improvements over time and are publicly available online and through other software’s as a built-in option.
One of the fields that took the most benefit of working with bioinformatic tools was phylogenetics, which uses molecular data, such as DNA sequences, to build evolutionary relationships between species. To create phylogenies, we start by retrieving and aligning molecular sequences using the resources already mentioned, before moving to the evaluation of the models associated to this molecular data. The two most commonly used software packages used for model calculation as of today are jModelTest2 (Posada 2008) and PartitionFinder2 (Lanfear et al. 2016). Both are capable of simple, yet resourceful analysis of molecular sequences, which is then employed as parameters for other biological analysis software’s. PartitionFinder allows an extra layer of examination, as it also finds the most adequate partitions for the given sequences.
2
After carefully retrieving, aligning and examine the models in our molecular sequences, we can finally work on the construction and evaluation of possible phylogenetic trees. As in all the other parts of the analysis, there’s an extraordinary amount of different solutions to this problem, which have also been changing and adapting along the years. The more simple algorithms for tree creation are UPGMA (Sokal & Michener 1958), Neighbour-Joining (Saitou & Nei 1987), and Maximum-Parsimony (Farris 1970; Fitch 1971), which are available in general purpose software such as MEGA (Kumar et al. 2016) and PAUP (Swofford 2002) as a quick and simple way to obtain a tree. However, there are today other, more sophisticated solutions, which have replaced these options almost completely in current scientific studies in this field.
Methods for Phylogenetic Inference
Different approaches and software’s have been developed along the years to perform phylogeny estimation, with researchers arguing on which was the best option at the time. Nowadays, the two main opposite ideas challenge each other on how to analyse a multiple data set (i.e. with several different gene samples). The more conventional approach, commonly referred as the Concatenation method, involves combining the gene samples found for a given group of species, which strengthens the analyses due to the higher number of variable sites. The main setback with this method is of course, when the multiple loci don’t share a similar topology. The alternative multi-species coalescent method, tries to solve this issue by estimating gene and species topologies simultaneously, which takes in account possible incongruences in the trees, such as agene duplication, horizontal deep transfer or deep coalescence (Edwards 2009).
With such opposite ideas, it can be challenging for a study to settle for one of these approaches, as the optimal solution could only be reached by knowing which was better suited to the data before it’s even collected (Carstens 2013). To avoid such issues, it’s not uncommon for studies to employ both solutions as it allows for a more thorough analysis, and an objective comparison between the methods without choosing a particular side. Since one of the main objectives of our study was to test a wide group of phylogenetic inference software’s, the latter was the most natural and appropriate solution.
To perform “classical” concatenation analysis two main software packages are generally used: RAxML (Stamatakis 2014) and MrBayes (Huelsenbeck & Ronquist 2001), which also differentiate themselves on the method to obtain the best phylogenetic solution.
Randomized Axelerated Maximum Likelihood (RAxML) makes use of Maximum Likelihood estimation (ML), which was made popular by Fisher in the early-20th century (Aldrich 1997), to perform phylogenetic inference. RAxML adapts the algorithm developed by Felsenstein (Felsenstein 1981), which was the first to compute phylogenetic trees given a set of DNA data, and works by selecting the tree that has the highest probability of generating the observed data. Several optimizations and updates were built-in the program, which makes it extremely fast and accurate, and capable of analysing big volumes of data. Similar software’s such as PHYML (Guindon et al. 2009) and GARLI (Zwickl 2006), also make use of ML calculations, and present alternative options which are also capable of fast and accurate analysis.
3
On the other hand, MrBayes estimates phylogenies making use of Bayesian Inference (BI), which has been around since Thomas Bayes’ essay in 1763 as a special case of the Bayes Theorem (Fienberg 2006). This methodology raised in popularity in the late 1980’s with the introduction of Markov Monte Carlo chains (MCMC), which reduced computational demands drastically, and finally allowed for a general use of BI methods in range of scientific applications. This approach differs from ML, by considering the parameters in the model to be random, instead of fixed variables, and so prior distribution need to be assigned to the data to obtain posterior distributions, which are used to perform the needed inferences (Yang & Rannala 2012). This approach can also be used to estimate molecular clocks (including relaxed clocks), by performing divergence time estimations with mutation rates, fossil and geological as calibration data, as seen in the software package BEAST (Drummond & Rambaut 2007).
Divergence Time Estimation – Molecular clocks
The selection of an appropriate clock model is another important step when performing a divergence time estimation in evolution. The simplest approach, a strict-clock, assumes that the evolution rates are fixed along the branches, and even thought it performs well when low rate variations are expected, it’s usually not adequate for most of the analysis. To correct this issue, particularly when using multilocus data, two other clock methods were introduced, namely correlated and uncorrelated relaxed clocks. Both approaches allow different substitution rates along the branches, but differ on their assumptions of the rate variation along them. As such, a correlated clock assume that neighbouring branches have similar evolution rates, while in an uncorrelated clock all the branches are independent from each other. In either case, a distribution is necessary to model the branch rates (Ho & Duchêne 2014). Several options are available for this effect, though three of them are more commonly used: lognormal, gamma and exponential.
With the introduction of relaxed clock methodologies, it was finally possible to make use of calibration techniques, which allow external dating information to be taken account when making the calculations, instead of using molecular data only. Calibration can be made on two different points: on the terminal or on the internal nodes. Since terminal calibration is only possible when incorporating fossil data or when working with some virus, internal calibration is more generally used, as it has less limitations (Ho & Phillips 2009). To calibrate internal nodes there’s two main forms available, specifically one that makes used of fossil and biogeographical (which requires some a priori knowledge of the relation between the species), and another that uses substitution rates previously calculated. Is not uncommon for studies to work with both approaches, as it usually provides a better supported analysis. To perform our analysis, we used several internal nodes calibrations, which were taken from previous works that worked with different sources of data and information. As such, this approach should give a more thorough and reliable results.
4
Due to the complexity of the divergence estimations methods, the choice of a good software to perform these analysis is absolutely paramount. The most popular software used in this type of analysis is BEAST, which makes use of Bayesian multispecies coalescent methods to calculate and date phylogenies. However, working with high volumes of data, namely multilocus data, is a challenge to this program, as it exponentially slows the analysis. To solve this setback, several improvements were made in the second version of the program, BEAST2 (Bouckaert et al. 2013), which allow for the use of different packages that are suited for several particular tasks.
One of such packages, StarBEAST2 or *BEAST2 (Ogilvie et al. 2017), works very well with multilocus data by providing reliable trees, divergence times and substitution rates, while being computationally faster than previous versions and pipelines of BEAST and *BEAST.
Phylogenetic Networks and Tree Visualization
A different method of phylogenetic inference, commonly called phylogenetic networks, is usually used to test the existence of cryptic events such as hybridization, recombination, horizontal gene transfer, or the duplication or loss of genes, in the given molecular data set. This method of analysis is implemented in several software packages like TCS (Clement et al. 2000) and SplitsTree4 (Huson & Bryant 2001), the latter containing methods for recombination and hybridization networks.
To manipulate and visualize the trees created in both ML and BI phylogenetic analysis we have several programs at our disposal such as FigTree (Rambaut 2009), iTOL3 (Letunic & Bork 2016) and Dendroscope3 (Huson & Scornavacca 2012), which range in both complexity and offered tools. In fact, the number of bioinformatic tools available today represents a huge framework for each question that arises, presenting several alternative solutions and ways to reach them. For phylogenetic analysis, this can prove to be an extraordinary time, as new knowledge and powerful software and hardware utilities continue to improve every day.
1.1.1 Main Software Packages
As discussed above, there’s a wide range of software programs available for the several steps in a phylogenetic study. Throughout the course of this study we tested and applied many of these methods and programs, some being chosen over others currently available, as its summarized in Table 1.1. across the analysis we used the most current version available at the time, and tested the given options to assess which gave us the best workflow and results.
5
Table 1.1. Summary of the software packages used in this study, similarly focused programs and the provided advantages we
found in the several steps of the phylogenetic analysis. Most of these programs are open-source, with the exception of Geneious which offers a paid version with additional functionalities.
Software Version Specification Similar Software’s Advantages
BEAST (Drummond &
Rambaut 2007) 1.8.4.
Bayesian inference;
molecular clock r8S (Sanderson 2003)
- More consistent estimates given limited sampling of loci (Mulcahy et al. 2012); -More commonly used in current studies;
BEAUti (Drummond &
Rambaut 2007) 1.8.4.
Associated program
to BEAST NA
-Necessary to work with Beast;
BioEdit (Hall 1999) 7.2.5
Biological sequence alignment editor and
analysis
Geneious (Kearse et al. 2012)
- Simple to use;
- Range of tools for analysis; - Helpful to review data;
Concatenator
(Pina-Martins & Paulo 2008) 1.1.0
Concatenation and conversion for nexus
and fasta files
Various multitasked programs have this functionality built-in
- Simple to use;
- Better control of the concatenation of the files as it has an option to format the output to work with other programs (e.g. MrBayes and PAUP);
DNASp5 (Librado &
Rozas 2009) 5.10
Analysis of DNA polymorphism data;
Haplotype analysis and phasing; Other
similar tasks
MEGA (Kumar et al. 2016); Mesquite
(Maddison & Maddison 2008)
- Contains a variety of tools easy to use; - Simple way to calculate and verify haplotypes;
- Quick analysis of polymorphism information and review;
FigTree (Rambaut 2009) 1.4.3 Tree plotting/drawing
Dendroscope3 (Huson & Scornavacca 2012); iTOL3 (Letunic &
Bork 2016)
- Easy and intuitive interface;
- Range of tools for manipulation of trees;
Geneious (Kearse et al.
2012) 10.2.3
General purpose
program MEGA; Mesquite
- Wide range of tools and available plugins for analysis.
- Easy to use and manipulate
LogCombiner
(Drummond & Rambaut 2007)
1.8.4 Associated program
to BEAST NA
-Necessary to work with Beast
MAFFT (Katoh &
Standley 2013) 1.3.6 Alignment algorithm
MUSCLE; Clustal; Blast
-Widely used and easy to work it; -Made available in Geneious
MEGA (Kumar et al.
2016) 7.0.18
Several tasks for sequence processing
and reviewing
DNASp5; Mesquite
- Easy to work with;
- Several of tools available for simple and quick analysis
MrBayes (Huelsenbeck
& Ronquist 2001) 3.2.6 Bayesian inference
Various multitasked programs have built-in options for BI
- Most commonly used in current studies; - Easy and simple to use.
PartitionFinder (Lanfear
et al. 2016) 2.1.1
Model and partition scheme calculation in
for DNA and protein alignments
jModelTest2 (Posada 2008)
-Allows model analysis and partition analysis as well;
- Easy to use
PAUP (Swofford 2002) 4.0a152
Phylogenetic analysis using parsimony and
other methods
MEGA
- Allows a simple way to perform ILD tests;
RAxMLGUI (Silvestro &
Michalak 2012) / RAxML (Stamatakis 2014) 1.5.b / 8.1.21 Maximum likelihood, simple Maximum parsimony PHYML; PAML (Yang 2007)
- Most commonly used on current studies; - Easy to use and interact with
SplitsTree4 (Huson &
Bryant 2006) 4.14.6
Phylogenetic network construction
TCS (Clement et al. 2000)
- Allows recombination and hybridization networks;
- Easy to use;
Tracer (Rambaut &
Drummond 2013) 1.6
Analysing the trace files generated BI Bayesian MCMC runs
NA
- Invaluable to assess the quality of BI results in BEAST and MrBayes;
TreeAnnotator
(Drummond & Rambaut 2007)
1.8.4 Associated program
to BEAST NA
-Necessary to work with Beast
*BEAST2 (Ogilvie et al.
2017) 2.4.7
Software package for BEAST2 (Bouckaert
et al. 2013)
Classical BEAST; BEAST2;*BEAST
- Computationally faster; - Allows the use of several loci
6
1.2. Macaronesia Islands as model systems in evolution
The importance of evolutionary processes on islands was first recognized in Charles Darwin’s seminal studies on the Galapagos islands, which gave rise in 1859 to the theory of evolution by means of natural selection (Darwin 2009). The pattern of species accumulation on oceanic islands depends on the rate of evolution relative to the frequency of island colonization, the extreme cases leading to extensive adaptive radiation as a result of in situ evolution with associated adaptation to occupy the available ecological space (Gillespie & Clague 2009). Over the last decades, research has focused on multiple facets of islands and they had a relevant role in establishment of Ecological and Evolutionary theories (Bellard et al. 2014).
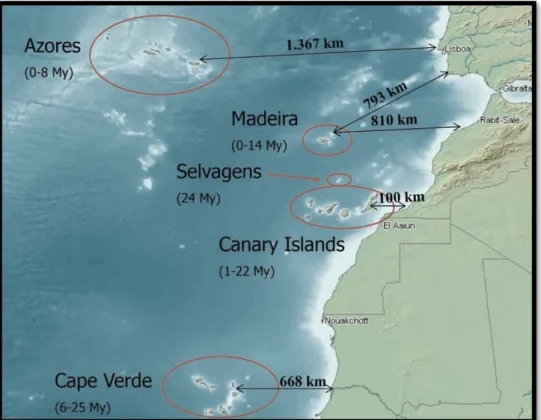
Islands can be broadly classified as one of the two types, continental or oceanic. Continental islands are fragments of a larger landmass, whereas oceanic islands result from volcanoes rising above the water on or near a mid-ocean ridge. Particularly, oceanic islands were the focus of studies that had contributed to our understanding of speciation and the origins of biodiversity, as is the case of Macaronesian Islands, which comprises five archipelagos: Azores, Madeira, Selvagens, Canaries and Cape Verde Islands (see Fig. 1.1).
Figure 1.1. The five archipelagos of the Macaronesian region - Azores, Madeira, Selvagens, Cape Verde and Canary Islands
– with the corresponding age and distance to the closet mainland point. (Adapted from http://www.juancarlosillera.es)
The Macaronesian Region, belongs to the Mediterranean Basin biodiversity hotspot, which is characterized by high levels of endemism. The relatively short distance to the African and European continents would have allowed for the colonization from this area with the influence of oceanic currents (North Atlantic and Canary streams) and north-easterly trade winds likely to have fostered the dissemination of ancestral species from the continent. For this reason, it has been proposed that frequent colonisations from the continent have contributed to the high number of species endemic to the Macaronesian Islands (Francisco-Ortega et al. 2000).
7
In general, terrestrial endemic lineages are often characterized by occurrence in different habitats; striking morphological differences among species; and their frequent rarity, being present in a few small populations (Takayama et al. 2015). The conservation of endemic island species is a complex, multifaceted topic, including the preservation of native habitats, control of alien plants and animals, and minimizing the impact of human activities (Caujapé-Castells et al. 2010; Romeiras et al. 2016). While these factors are very important from a conservation perspective, there is still a gap in our knowledge on how this huge endemic diversity has evolved in each archipelago, with lacking details for entire taxonomic groups. This information is needed to understand the evolution and diversification patterns of endemic diversity on the Macaronesian hotspot area, which begs the necessity for more complete studies that encompass these endemic lineages, while taking in account their taxonomic and regional relatives.
1.3. The study system – value of the Cape Verde biodiversity for study evolution
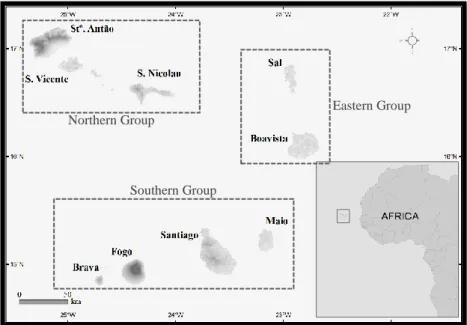
The Cape Verde Islands are the most southern archipelago of the Macaronesian Region. The archipelago is a group of 10 volcanic islands located 1500 km southwest of the Canary Islands and 668 km west of the African mainland. Within the archipelago, the islands form three clusters: (i) Northern group (Santo Antão, São Vicente, Santa Luzia and São Nicolau); (ii) Southern group (Santiago, Fogo and Brava) and (iii) Eastern group (Sal, Boavista and Maio) (see Fig. 1). The northern and the southern islands are characterized by high mountains [e.g. Monte Gordo (1304 m) in São Nicolau; Pico da Antónia (1392 m) in Santiago; Tope de Coroa (1979 m) in Santo Antão and Pico do Fogo (2829 m) in Fogo], offering a wide range of habitats over relatively short distances (Duarte & Romeiras 2009). The eastern islands are lower, drier and more homogeneous in their ecology. The islands’ ages range from ∼25.6 to ∼21.1 Ma (for Sal and Maio, respectively) to <6 Ma (for Brava), with ages decreasing from east to west (Doucelance et al. 2003). Only Fogo Island currently has volcanic activity, with the most recent eruptions occurring in 1995 and 2014-2015.
Figure 1.2. The Cape Verde Islands archipelago in detail, showing the geographical position and size of the islands. All nine
inhabited islands are marked on the map, while the uninhabited Santa Luzia Island (not named in the map), is seen as the large land mass south of São Vicente and north of São Nicolau. The Branco and Raso islets are found south of Santa Luzia, while the Rombo islets are neighbours to island of Brava. Adapted from (Romeiras et al. 2015).
Northern Group
Eastern Group
8
Cape Verde’s biodiversity is of great scientific value, with several important marine radiations, as well as important terrestrial endemic groups of arthropods, plants and reptiles (Arechavaleta et al. 2005; Duda & Rolán 2005; Cunha et al. 2014). Among these groups its highlighted that several endemic species, some of which economically valuable, are at risk of extinction and make conserving the archipelago’s biodiversity a world concern (Romeiras et al. 2016). The reptiles have three vast reptile genera – Chioninia, Hemidactylus, Tarentola – with 22 endemic species, which represent the huge diversity of this group in the Macaronesian region according to Vasconcelos et al. (2013).
To date, molecular analyses of the Cape Verde flora and fauna have been limited and an almost complete gap exists in several groups, even among most arthropods, that have the highest number of endemic species. The majority of the analyses made to study the relationships of Macaronesian lineages have focussed largely on Azores, Madeira and the Canary Islands (Roux 2004; Santos et al. 2010; Machín-Sánchez et al. 2014; Orellana et al. 2016), and where Cape Verdean taxa have been included, the sampling has often been limited (Pyron et al. 2013; Karin et al. 2016; Metallinou et al. 2016; Zheng & Wiens 2016). Nevertheless, taxonomic and molecular relationships for the Cape Verdean reptiles were recently well documented in several studies (Arnold et al. 2008; Vasconcelos 2010; Miralles et al. 2011), and provided a good starting point to a combined study such as ours– which encompasses all three endemic genera – using the existent sequences produced in previous studies and made available in GenBank, as results of these works. As such, these three reptile lineages – Chioninia, Hemidactylus and Tarentola – provide a good model to test evolution and to apply different bioinformatic tools to understand the origin and diversification patterns on islands, particularly in the Cape Verde archipelago. Chioninia (Scincidae)
The Scincidae family, which includes the genus Chioninia, has undergone complex taxonomic changes along the years, with several groups being revaluated and renamed as new phylogenetic studies provided more accurate information. One of the affected groups was Mabuya, which was divided in four different genera accordingly to molecular results and their ecological distributions (Mausfeld et al. 2002; Carranza & Arnold 2003), namely: Chioninia, which now holds the species endemic to Cape Verde (7 species and 7 subspecies, see Table 1.2 and Appendix I); Trachylepis which is mostly composed of Afro-Malagasy originated species, with the exclusion of T. atlantica found in the Fernando de Noronha island, Brazil; the Asian clade now designated as the genus Eutropis; and the “true” Mabuya species which are nowadays restricted to Neotropic regions.
Hemidactylus (Gekkonidae)
Within the Gekkonidae, Hemidactylus is one of the most diverse reptile groups, with 144 taxa in the Reptile Database (see http://www.reptile-database.org). These species can be found across continents and islands in an wide range of habitats, as both endemic and introduced species (Carranza & Arnold 2006). Their remarkable extensive distribution was related to fascinating adaptions to travel huge masses of land and sea, including calcareous and adhesive egg shells, resistance to sea water, and fat reserves which allow for long periods of self-sustenance (Bansal & Karanth 2010). At least one transmarine cross is described, with reptiles traversing from Africa to South-America (Kluge 1969), possibly crossing several Atlantic islands along the way. This specimens are also commensal, and are often found living and traveling alongside humans, which adds yet another layer to their already complex phylogenetic reconstruction (Rocha et al. 2005). In Cape Verde, there are 3 described species and 2 subspecies of these reptiles, several of which endangered or restricted to a single island (see more details in Table 2.1 and Appendix I).
9
Table 1.2. List of the reptile species and subspecies found in the Cape Verde archipelago. More detailed information can be
found in Appendix I, which includes the other reptiles found in the Macaronesia region. A species of Hemidactylus, currently classified as Hemidactylus sp. is currently being surveyed, and its likely a single island endemic in São Nicolau.
Tarentola (Phyllodactylidae)
The last endemic genus found in the Cape Verde is the Phyllodactylidae genus Tarentola with 13 species and 2 subspecies in this archipelago. This group, commonly called wall-geckos, are found in the Mediterranean area, including the Macaronesia regions, and across the Atlantic Ocean in several neotropical islands (Carranza et al. 2000; Gamble et al. 2008a; Gamble et al. 2008b). Previous studies suggest possible cryptic and complex relationships (Vasconcelos et al. 2010), with a likely radiation in a Cape Verde lineage after a single colonization event from the neighbour Canary Islands (Vasconcelos et al. 2012). An endemic Cape Verdean species, T. substituta, was reportedly introduced in the island of São Miguel, Azores (Rato et al. 2015), and was also included in our study to review its native status within the Macaronesia clade.
Species/Subspecies Distribution Single Island
Endemic (SIE) Red List Category
Chioninia coctei São Vicente, Santa Luzia, Raso, Branco Extinct
Chioninia delalandii Brava, Santiago, Fogo, Rombos Least Concern
Chioninia fogoensis Santo Antão • Least Concern
Chioninia nicolauensis São Nicolau • Least Concern
Chioninia spinalis ssp. boavistensis Boavista • Least Concern
Chioninia spinalis ssp. maioensis Maio • Least Concern
Chioninia spinalis ssp. salensis Sal • Least Concern
Chioninia spinalis ssp. santiagoensis Santiago • Least Concern
Chioninia spinalis ssp. spinalis Fogo • Least Concern
Chioninia stangeri São Vicente, Santa Luzia, Raso, Branco Near Threatened
Chioninia vaillanti ssp. vaillanti Santiago • Endangered
Chioninia vaillanti ssp. xanthotis Fogo • Endangered
Hemidactylus boavistensis Boavista, Sal Near Threatened
Hemidactylus bouvieri São Nicolau, Santo Antão, São Vicente Critically Endagered
Hemidactylus bouvieri ssp. razoensis Santa Luzia, Raso Critically Endagered
Hemidactylus lopezjuradoi Fogo • Data Deficient
Hemidactylus sp. São Nicolau • NA
Tarentola boavistensis Boavista • Vulnerable
Tarentola bocagei São Nicolau • Least Concern
Tarentola caboverdiana Santo Antão • Least Concern
Tarentola darwini Santo Antão • Least Concern
Tarentola fogoensis Fogo • Least Concern
Tarentola gigas ssp. brancoensis Branco • Endangered
Tarentola gigas ssp.gigas Raso • Endangered
Tarentola hartogi Brava, Rombos • Data Deficient
Tarentola maioensis Maio • Least Concern
Tarentola nicolauensis São Nicolau • Least Concern
Tarentola protogigas Fogo • Least Concern
Tarentola raziana Santa Luzia, Raso, Branco Near Threatened
Tarentola rudis Santiago • Data Deficient
10
Other Reptiles in Macaronesia
Aside to the mentioned endemic taxa from the genera Chioninia, Hemidactylus and Tarentola, three other reptilian genera can be found across the Macaronesian region, namely Teira, Chalcides and Gallotia.
A single species belonging to the lacertid Teira, T. dugesii, is found in Madeira archipelago and the Selvagens, with some introduced specimens in the Azores and some Portuguese mainland areas (Arnold & Ovenden 2002).
The Canaries hold the other two endemic reptile genera – Chalcides a Scincidae skink, with four described species (Austin & Arnold 2006); and Gallotia, a lacertid which can only be found in these islands and has seven recognized species, with several subspecies (Cox et al. 2010).
The conservation status for several Macaronesian endemic reptiles were consulted in the IUCN Red List (IUCN 2017), as its seen in Table 1.2. and in more detail in Appendix I. This information reveals that four from Cape Verde species are in threatened categories [i.e. Critically Endangered (CR), Endangered (EN) and Vulnerable (VU)]: Hemidactylus bouvieri (CR), Chioninia vaillantii (EN), Tarentola gigas (EN), and Tarentola boavistensis (VU). The IUCN Red List also includes two possible extinct reptiles – Chioninia coctei, from Cape Verde; and Gallotia auaritae from the Canary Islands – that were categorized as CR/ Possibly Extinct. Moreover, Hemidactylus lopezjuradoi and Tarentola rudis were not evaluated because of insufficient information (i.e. Data Deficient); and Chioninia stangeri, Hemidactylus boavistensis and Tarentola raziana are close to meeting the threatened thresholds (i.e. Near Threatened). The remaining 13 species have been classified as Least Concern (LC). This information is also important to better understand how this species have evolved, and how they environmental factors might have influenced their current observed status.
11
1.4. Aims of the study
We aimed to explore the usefulness and performance of several bioinformatic methods, currently applied to phylogenetic studies, to thoroughly analyse recent radiated insular lineages. The Cape Verde Islands were selected as a model system to study evolution, as the origin of the biodiversity in this archipelago is the still not completely understood. All the endemic reptiles taxa, which are distributed in three genera (i.e.: Chioninia, Hemidactylus and Tarentola) were selected as a case-study, since there was a massive of amount of molecular data available for this highly diversified group. These three genera were featured in previous studies that offered possible molecular, taxonomic and phylogenetic relationships within each group. Few however, had ever taken in account the three genera simultaneously and accounted for all the Cape Verde endemic reptile diversity. Phylogenetic procedures have also change along the years, and as such most of the software packages used in previous studies have been updated or replaced in the meantime. Simple phylogenetic networks were also performed to provide a look into possible hybridization and recombination processes that may have occurred in these lineages. The collected data sequences were publicly available, as were the several references and software packages used throughout this study. As such, there was a great opportunity to review and combine all the previous finds regarding the Cape Verdean reptiles, using the most up-to-date bioinformatic tools and knowledge, to provide new insights to study evolution on islands. The application of several methodologies explored in different software’s was also a goal of this study, namely the use of different methods of phylogenetic inference, in which we worked with different parameters, to take a look on how these alterations influence the final results.
12
2. MATERIALS AND METHODS
2.1. Data Collection
We compiled a list of the Macaronesian endemic reptiles, with a particular focus on the Cape Verde endemic taxa, including the recently described species, which were featured in previous studies and had available DNA sequences. After sorting and organizing this information, we then ran a search in the GenBank database (https://www.ncbi.nlm.nih.gov/genbank) and downloaded these sequences, directly as fasta files or through other tools, such as Geneious. This tool was also used for checking the sequences for possible errors and to apply corrections when applicable.
The first group of sequences found across the multiple references was composed of 1725 DNA sequences for 15 different genes, namely 916 sequences for the genus Tarentola for 6 regions, 588 sequences for Chioninia for 13 regions, and 221 sequences for Hemidactylus for 3 regions (see more details in Table 2.1). Most of these sequences belonged to Cape Verde endemics (1447 in total), the rest coming from other species used to assess the speciation process of each group, as well as three sister taxa species to be used as outgroups in one of the analysis sets. The data undergone a thorough preliminary analysis to carefully evaluate the best possible results. These tests comprised the assessment of the quality of the sequences, the ensued alignment obtained with them, and finally the performance in both Maximum-Likelihood and Bayesian Inference methods of tree calculation.
The final version of the analysis was composed of a smaller set of sequences (see Appendix II), which reduced both redundancy and runtime, while improving the overall results. Two main data groups were created: one using three sister taxa to function as outgroups in the following phylogenetic analysis; and another one in which the outgroups were from within the genus (in the case of Hemidactylus and Tarentola) or closer to the group (in the case of Chioninia, as it’s a genus endemic to Cape Verde). In both cases the outgroups were retrieved from previous studies, and whenever possible from trees containing Cape Verde species. This approach allowed us to test these two methodologies and their performance, and provided two different perspectives into the relations of the Cape Verdean reptiles between themselves and with their relatives. All the relevant data regarding the molecular sequences used in this study, such as their source and accession numbers, is shown in full in Appendix III. Regarding the loci used for each of the reptile groups, their sorting was made by source, specifically, if they were of mitochondrial or nuclear in origin: A) the Chioninia analysis set had the biggest gene diversity: four mitochondrial genes, 12S, 16S, cytochrome b (cyt b) and cytochrome c oxidase subunit I (COI); and nine nuclear, oocyte maturation factor Mos (C-mos), recombination activating gene 2 (RAG2), brain-derived neurotrophic factor (BDNF), breast cancer 1 (BRCA1), breast cancer 2 (BRCA2), exophilin 5 (EXPH5), kinesin family member 24 (KIF24), melanocortin 1 receptor (MC1R) and recombination activating gene 1 (RAG1); B) the Hemidactylus genus had the lowest number of available genes, with just two mtDNA genes (12S and cyt b) and one nDNA loci (RAG2); C) finally, we used six different genes for the genus Tarentola, two of mitochondrial origin, 12S and cyt b; and four retrieved from nuclear DNA, C-mos, MC1R, acetylcholinergic receptor M4 (ACM4) and phosducin (PDC). In some genes, namely cytb, there were sequences that were composed of first and second halves’ of the locus, while other contained the complete region. To solve this, we first joined the split sequences for each of the individuals, and then added the complete sequences to the data matrix. After completing the alignment, the separated sequences were suitably mapped to the complete data sequences.
13
2.2. Data Analysis
The first step after acquiring the sequences was to verify and correct those using Geneious, which also allowed a simpler way to download them as previously described. BioEdit v.7.2.5 was also used for some corrections and verifications between analysis, and for some conversions between file formats.
While surveying the several data references, there were some errors when matching their information with the one found in GenBank. Some of the sequences had different names, and in some cases wrong accession numbers. In order to correctly compile and summarize the information we crossed referenced through the several studies (mainly Arnold et al. 2008; Vasconcelos et al. 2010; Miralles et al. 2011; Vasconcelos et al. 2012) and also through the Reptile Database (Uetz 2010) to better assess the most current taxonomic description of the used specimens.
After the aforementioned processing, we ended with a fasta file for each gene, containing all its sequences. The alignment was done through Geneious using MAFFT v.1.3.6, with the default parameters, and then exported as a nexus file.
The next step was using the software DNASp to analyse the haplotypes, and to run fastPhase when ambiguities were found. In some cases, it wasn’t possible to use this last tool due to the high number of ambiguities, and so those sites were removed using the Mask Sites tool of Geneious, which marked and removed those sites. After making sure the sequences were free of any faults, they were exported as fasta and phylip files using Geneious.
The tool Concatenator v.1.1.0 (Pina-Martins & Paulo 2008) was used to compile the genes in three separate groups: mitochondrial, composed of all the available mitochondrial genes; nuclear, which had the found nuclear genes; and with both of them. To assure that there were no conflicts between them, an ILD test was done in PAUP v4.0a152 (Swofford 2002), and no incongruences were found in any of the combined genes for Chioninia (P=0.974 for the nuclear set, P=1 for the mitochondrial and complete set), Hemidactylus (P=0.305 for the mitochondrial set and P=0.571 for the complete set), and Tarentola (P=0.837 for the mitochondrial set, P=0.195 for the nuclear set and P=0.988 for the complete set). This test is invaluable to measure possible conflicts between different data sources (in our case nuclear and mitochondrial DNA) to ensure that they converge toward the same phylogenetic tree (Planet 2006). A polymorphism data analysis was performed for each reptile dataset using a combination of the tools provided in DNASP5 and MEGA7. This evaluation was made for the concatenated sets of mitochondrial and nuclear sequences (see Table 3.1) and for each single gene, which allowed us to assess how each locus contributed to the combined results (Appendix IV). We also created simple phylogenetic trees in MEGA7, using the Neighbour Joining (NJ) methodology to test for possible errors and misinterpretations in our data sequences. These tests provided a simple and yet important way to survey the quality of the data used in the following analysis. This is a vital step for any research study to prevent poor results due to the GIGO (
Garbage In, Garbage Out)
phenomenon, which can occur when low quality input data is provided (Gelman 2011).14
2.2.1. Phylogenetic analyses
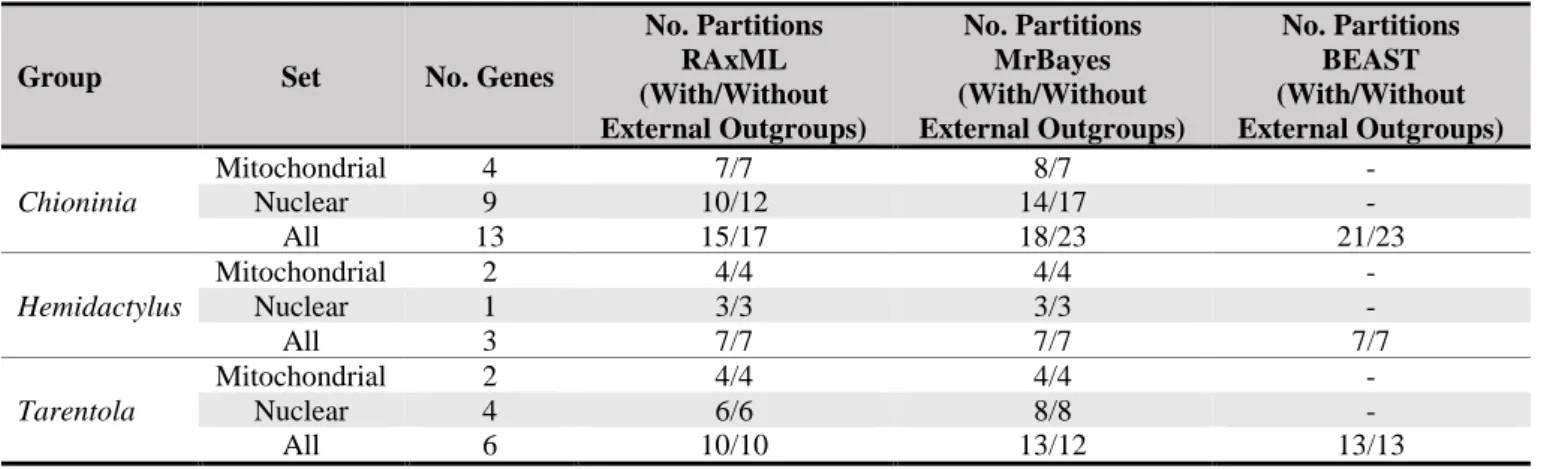
After completing the data processing, we analysed the substitution models and partitions across our files using the software PartitionFinder v.2.1.1 (Lanfear et al. 2016). For each datafile, three separate analyses were done, each one using the models available in the following software packages: RAxML, MrBayes and BEAST. Across all analysis, we used the AICc (corrected Akaike Information Criterion) as the selection model, and the greedy scheme, since they’re the recommended settings given by the authors of PartitionFinder. The search was made by codon whenever possible, i.e. when using coding genes, since it gave a more thorough analysis of the sequenced data. The results of this analysis are summarized in Table 2.1., and fully detailed in Appendix V.
To perform Maximum-Likelihood analysis (ML) we used RAxMLGUI v.1.5.b, a program that simplifies the use of RAxML, by providing a window like interface and connection to the Cipres Gateway (Miller et al. 2010). This way the input files were imported into the program, and after setting the adequate parameters, directly uploaded to Cipres Gateway, where the analysis was then run. This web based tool allows for storage, management and analysis of data in their cloud servers. Besides the obvious advantages of having a backup storage place, this tool is particularly useful for researchers worldwide, by providing a powerful system that can run the most broadly used programs for phylogenetic inference. This saves a considerable time in the analysis runtime, as the software packages perform a lot faster than in any common personal computer.
For the Bayesian Inference (BI) analysis we used the software MrBayes v.3.2.6. All the runs were performed in Cipres Gateway by uploading a nexus file with the appropriate commands inserted at its bottom. The results were then analysed using Tracer v.1.6. to assess the convergence for the parameters obtained for each run.
To build the created phylogenetic trees we used FigTree v.1.4.3, which allowed for a quick visualization and manipulation of the results. We made use of the annotation feature, which allowed a straightforward way to assign new tip labels and colour schemes by certain parameters. This workflow is graphically represented in Figure 2.1.
Table 2.1. Summary of the partitions obtained in PartitionFinder in the final version of the analysis in both sets of analysis
(with and without external outgroups.
Group Set No. Genes
No. Partitions RAxML (With/Without External Outgroups) No. Partitions MrBayes (With/Without External Outgroups) No. Partitions BEAST (With/Without External Outgroups) Chioninia Mitochondrial 4 7/7 8/7 - Nuclear 9 10/12 14/17 - All 13 15/17 18/23 21/23 Hemidactylus Mitochondrial 2 4/4 4/4 - Nuclear 1 3/3 3/3 - All 3 7/7 7/7 7/7 Tarentola Mitochondrial 2 4/4 4/4 - Nuclear 4 6/6 8/8 - All 6 10/10 13/12 13/13
15
Figure 2.1. Diagram of the workflow performed along this study, with detail on some of the significant stages, software
packages and final outputs. (For more details on the software packages used see Table 1.1)
2.2.2. Divergence time estimation
To estimate the divergence time of the three-reptile genera we performed two separate analysis: one featuring the more “classical” approach using BEAST (version 1.8.4); and another using the most recent multispecies coalescent method provided in *BEAST2 (version 2.4.7 of BEAST2). In both cases we made use of the main program and its associate tools, BEAUTI, LogCombiner and TreeAnnotator all in the adequate version for each case. BEAUTI was used to create xml files with the desired parameters, that were then used as an input for each BEAST/*BEAST2 analysis. On the other hand, the other two software packages were used on the attained outputs – LogCombiner, to combine log and tree files from independent runs; and Tree Annotator, which
summarizes the information from a sample of trees produced by
BEAST/*BEAST2 into a single “target” tree.
To attain the most comprehensive analysis possible in BEAST we used the concatenated sets with all the genes in each of the groups (as described in the results section). After performing the model calculations and partition scheming with PartitionFinder, we ended up with 21 partitions for Chioninia, 7 for Hemidactylus and 13 for Tarentola. A second analysis was made for the Chioninia dataset, as some partitions had low ESS (effective sample size) values and were subsequently removed, which divided the data in 10 partitions instead of the previous 21.
16
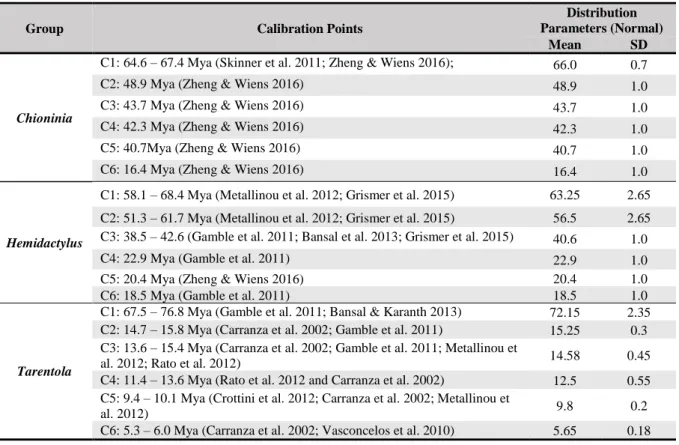
To calibrate our trees in this analysis, we opted for the use of gene mutation rates, and the introduction of fossil calibration points indirectly. As the number of reptile fossils for the study reptile genera is rather limited (Table 2.2), most of the time estimate was made using the substation rate of one or two genes, that had been calculated in previous studies. However, to better date the tree roots, we made use of the dates provided in (Zheng & Wiens 2016), which were calculated using 13 fossil calibrations and previously assess gene mutation rates (Mulcahy et al. 2012; Pyron et al. 2013). Regarding the genes used to estimate divergence time for each of the reptile groups, we used 16S for Chioninia (Karin et al. 2016), cytb and 12S for the Hemidactylus (Šmíd et al. 2013), and 12S for Tarentola (Rato et al. 2012).
All three analyses were performed using the models and partition schemes defined by PartitionFinder, a lognormal relaxed clock and the parameters used in each of the based studies. In all cases we opted to start with a Yule Model of speciation, as it’s the most simple model available and is generally more appropriate when considering sequences from different species (Ho & Duchêne 2014), namely: A) for Chioninia, we used a normal prior on the lognormal clock mean (16S rate = 0.0080, stdev = 0.0020), as its described in (Karin et al. 2016); B) in the Hemidactylus analysis we set the parameters as its done in Šmíd et al. (2013): Yule process of speciation; random starting tree; alpha Uniform (0, 10); yule.birthRate (0, 1000); ucld.mean of 12S Normal (initial value:0.00755, mean: 0.00755, Stdev: 0.00247); ucld.mean of cytb Normal (initial value: 0.0228, mean: 0.0228, Stdev: 0.00806; C) finally, for the Tarentola genus we used a relaxed Uncorrelated Lognormal Clock; Yule process of speciation; random starting tree; alpha Uniform (0, 10); yule.birthRate (0, 1000); ucld.mean of 12S Normal (initial value: 0.00827, mean:0.00827, Stdev: 0.00162), as seen in (Rato et al. 2012).
The MCMC chain length and run number was different for each of the analysis, but in all cases the final results were examined in Tracer 1.4. to confirm the existence of convergence and a sufficient ESS (above 200) across all parameters, namely: A) for Hemidactylus a single run was needed achieve this quota, which ran for 5x10⁸ generations and sampled at each 5000; B) for
Chioninia we combined two independent runs of 1x10⁹ with a sample of 10000, which then
composed a single analysis with 1x10⁹ with a resample of 20000; C) finally in the Tarentola
genus we combined two independent runs with 5x10⁸ generations and a sample of every 5000
trees, in a single file with 1x10⁹ generations and a sampling every 10000. After this processing,
we used TreeAnnotator to discard 25% of the each run as burn-in and to produce the maximum credibility trees, using the divergence time mean and 95% highest probability density (HPD). Similarly, to what we did with the obtained results of RAxML and MrBayes, we finalized this analysis by visualizing and manipulating the trees in FigTree v.1.4.3, as we show in Figure 2.1. For the *BEAST2 analysis the defined parameters were set accordingly to the initial template provided by the program. After obtaining the best substitution models and partitions for each group using PartitionFinder, the sequences were imported into BEAUti with the *BEAST2 template in place. A selection of taxa was made as to reduce sequence redundancy, while maximizing number of available sequences for the selected individuals. In this analysis, we also introduced three new taxa that were considered outgroups, the same that were introduced in the more thorough phylogenetic analyses previously discussed. Likewise, this allowed us to compare the results when looking at divergence times when looking inside the Cape Verdean group and when using external outgroups.