Pilots Performance and Flight Safety
The Case of Cognitive Fatigue in Unpressurized Aircraft
Cabins
João Artur de Freitas Rocha
Dissertação para obtenção do Grau de Mestre em
Engenharia Aeronáutica
(Ciclo de estudos integrado)
Acknowledgements
This dissertation was only possible with the contribution of some people and entities, that helped in many ways in the development and conclusion of this work. So, I owe them a great word of appreciation.
To begin, I would like to thank my supervisor, Professor Jorge Miguel dos Reis Silva, who helped me get this work going, in times it did not seem possible to see this through. I also would like to thank all the people working with me in NIT - Núcleo de Investigação de Transportes, Eng.a Maria Emília Baltazar, Luis Santos and Pedro Oliveira that helped me get this dissertation concluded.
This work would not have been done without the help and disposition of GPIAAF - Gabinete de Prevenção e Investigação de Acidentes com Aeronaves e de Acidentes Ferroviários, more particularly Senior Officer Maria José André and José Figueiredo Head of Civil Aviation Unit. They helped me in my doubts, documents and occasionally gave me some guidance in the direction of this dissertation.
The Aeroclube de Viseu was a crucial part of this work since the three test subjects that took part on this study were from this association and in a time where it was difficult to find volunteers for this study they gladly accepted to do it. So, I must thank the Director Paulo Soares of the Municipal Aerodrome Gonçalves Lobato, that provided me the contact to President of the Aeroclube de Viseu, Dominique Ramos. And thank the President of the Aeroclube de Viseu for helping me get in contact with Luis Patrão, José Quintal and Tiago Mendes that provided me with all the data to the realization of this study. A big thanks to Diana Carlos that helped me see this work concluded and supported me through all the changes in my mood until the end.
The realization of this dissertation would not have been possible without the help of some of my friends Francisco Figueira, João Tavares Miguel, Catia Miguel, Fabio Romão, Mara Andrade, Miguel Calmeiro and João Paulo Patrão that in times of tight schedules help me get things done and in difficult times help me pull my head up.
To conclude, but not less important, a big thanks to my parents and sister that supported the entirety of these six years passed in this beautiful place called Covilhã.
Abstract
The purpose of this study is to understand the impact, evolution, and perception of cognitive fatigue as a contributory factor on the occurrence of incidents and accidents, on unpressurized aircraft.
This study uses the science principles present in the ”Fatigue Management Guide for Airline Operators” (FMG) to evaluate data obtained by four methods of measuring cognitive fatigue. These consist of two objective measures, Psychomotor Vigilance Test (PVT) and an actiwatch (Readiband 5), and two subjective measures, Samn-Perelli 7-point fatigue Scale (SPS) and sleep diaries. It is also obtained results from a survey aimed to all national and international pilots and related to this theme.
From this research are draw conclusions of the influence and evolution of cognitive fatigue on the operations of unpressurized aircrafts and it is understood the difference between perceived cognitive fatigue and the real cognitive fatigue accumulated by the pilot. Is also drawn findings from a launched survey related to this theme.
In this case study the focus will fall upon general aviation where there are no ways to control and monitor the fatigue element, which is associated with the cause of most incidents and accidents that occur in Portugal as concluded by analyzing several GPIAAF (Gabinete de Prevenção e Investigação de Acidentes com Aeronaves e de Acidentes Ferroviários) final reports using HFACS (Human Factor Analysis and Classification System). Normally this type of research is conducted within airline operators, that are already a very restricted and controlled domain of civil aviation.
Keywords
GPIAAF, Accidents Investigation, Accidents Prevention, Operational Safety, Flight Safety, Pilots Performance, Human Factors, Cognitive Fatigue, HFACS.
Resumo
O objetivo deste estudo é compreender o impacto, a evolução e a perceção da fadiga cognitiva como fator contribuinte na ocorrência de incidentes e acidentes em aeronaves não pressurizadas.
Este estudo utiliza os princípios científicos apresentados no ”Fatigue Management Guide for Airline Operators” (FMG) para avaliar os dados obtidos por quatro métodos de medição da fadiga cognitiva. Estes consistem em duas medidas objetivas, Psychomotor Vigilance Test (PVT) e um dispositivo de rastreio (Readiband 5), e duas medidas subjetivas, Samn-Perelli Escala de Fadiga de 7 pontos (SPS) e diários de sono. Também são obtidos resultados de um inquérito dirigido a todos os pilotos nacionais e internacionais relacionado a este tópico.
A partir desta pesquisa são tiradas conclusões da influência e evolução da fadiga cognitiva em operações de aeronaves não pressurizadas bem como a diferença entre a fadiga cognitiva percetível pelo piloto e a fadiga cognitiva real acumulada. Também são retiradas conclusões do inquérito lançado.
Este caso de estudo recairá sobre a aviação geral, onde não há formas de controlar e monitorizar o elemento de fadiga, que é a causa da maioria dos incidentes e acidentes que ocorrem em Portugal, o que se conclui da análise de vários relatórios finais do GPIAAF (Gabinete de Prevenção e Investigação de Acidentes com Aeronaves e de Acidentes Ferroviários) usando o HFACS (Human Factor Analysis and Classification System). Normalmente este tipo de pesquisa é conduzida no seio de operadores aéreos, que já são um domínio muito restrito e controlado da aviação civil.
Palavras-chave
GPIAAF, Investigação Acidentes, Prevenção Acidentes, Segurança Operacional, Segurança de Voo, Desempenho de Pilotos, Fatores Humanos, Fadiga Cognitiva, HFACS.
Resumo Alargado
Introdução
Nos primeiros dias da aviação, sabe-se que aproximadamente 80% dos acidentes foram causados por falhas mecânicas e os outros 20% por erro humano. Hoje, devido ao desenvolvimento da tecnologia e à implementação de uma manutenção melhor e mais rigorosa em aeronaves, constata-se que as falhas mecânicas causam apenas 20% dos acidentes e os erros humanos ocupam os outros 80% [1], [2].
Em território nacional, e após uma análise de todos os relatórios finais de acidentes e incidentes de 2010 até 2017, foi facilmente verificável que a maioria dos acidentes ocorre no domínio da aviação geral.
Uma análise mais aprofundada aos dados de 66 relatórios finais relacionados ao domínio da aviação geral e utilizando o Sistema de Análise e Classificação de Fatores Humanos (HFACS) obtiveram-se resultados de onde se concluiu que 81.82% dos relatórios finais tinham indícios de Fatores Humanos (HF). Com base nestes resultados obtidos e exibidos acima, apercebeu-se da importância dos HF na aviação geral e que este é um tema onde há carência de estudos e regulamentações.
Assim, um dos principais objetivos deste estudo é encontrar as principais causas humanas de acidentes e incidentes em Portugal e perceber o impacto que este HF tem durante a operação de aviões não pressurizados, normalmente utilizados na aviação geral.
Enquadramento da Dissertação
A implementação do HFACS aos relatórios finais de incidentes e acidentes do Gabinete de Prevenção e Investigação de Acidentes com Aeronaves e de Acidentes Ferroviários (GPIAAF) de 2010 a 2017 [3], permitiu a aquisição dos dados sobre os fatores humanos causadores de ocorrências na aviação geral e Operações Especializadas (SPO) de helicópteros e aviões, onde predomina o uso de aeronaves com cabines não pressurizadas. Neste tipo de aviação nem sempre há influências organizacionais, por isso os fatores relativos às influências organizacionais do HFACS não foram aplicados.
A partir dos dados obtidos, determinou-se que a causa da maioria dos acidentes / incidentes em Portugal esta ao nível dos atos inseguros. Os atos inseguros estão relacionados com a fadiga
cognitiva que resulta em um comprometimento do desempenho normal individual que aumenta o risco de falha durante a operação, por exemplo [4]:
• Aumento do tempo de reação (RTi); • Atenção reduzida;
• Memória prejudicada; • Mudanças de humor; • Voo impreciso;
• Tomadas de decisão erradas; • Perda de consciência situacional.
De acordo com a ICAO, a fadiga é caracterizada como um estado fisiológico de capacidade de desempenho mental ou físico reduzido, resultado da falta de sono, vigília prolongada, fase circadiana ou carga de trabalho (atividade mental e / ou física), e pode prejudicar o nível e a capacidade de um membro da tripulação para operar uma aeronave ou realizar tarefas relacionadas com a segurança [5].
Assim, a fadiga pode ser descrita como uma capacidade reduzida de executar tarefas operacionais e pode ser considerada como um desequilíbrio entre [6]:
• Esforço físico e mental de todas as atividades de despertar (não apenas as de operação); • Recuperação deste esforço, que requer sono (exceto recuperação da fadiga muscular). A fadiga física é definida como uma incapacidade de exercer força com os músculos, na medida do que é normalmente esperado. Pode ser específico para uma parte do corpo ou cansaço geral. Fadiga física é um resultado do exercício físico ou uma perda de sono, esta fadiga muitas vezes leva a fadiga mental / cognitiva [4].
A fadiga mental/cognitiva, que pode incluir sonolência, está relacionada com a diminuição da atenção e a capacidade de realizar tarefas complexas ou simples quando comparada com a eficiência regular de um indivíduo [4].
A fadiga que é estudada nesta dissertação é aquela causada pela falta de sono ou sono inadequado. Este tipo de fadiga é conhecido como "fadiga cognitiva" ou fadiga mental e está diretamente ligada à redução do estado de alerta, tempo de reação (RTI), prejudicando a tomada de decisão do operador [7].
Objetos e Objetivos
Neste estudo, o objeto sob avaliação será o desempenho dos pilotos em aeronaves não pressurizadas, mais especificamente no caso de fadiga cognitiva e segurança de voo.
O objetivo desta dissertação é compreender o impacto da fadiga cognitiva como fator contribuinte na ocorrência de incidentes e acidentes, utilizando os princípios científicos presentes no Fatigue Management Guide for Airline Operators (FMG) [6]. Será interpretada a evolução da fadiga cognitiva e seu impacto no desempenho do piloto durante toda a operação da aeronave; em simultâneo será efetuada a comparação da fadiga experimentada pelos indivíduos que participaram deste estudo e a real deterioração de seu estado de alerta medido pelos equipamentos utilizados.
As conclusões serão auxiliadas por comparação com: a análise dos relatórios finais de ocorrências do GPIAAF, utilizando o HFACS; os dados adquiridos experimentalmente durante e fora da operação da aeronave; e os resultados obtidos através de um inquérito lançado aos pilotos, sobre o assunto da fadiga cognitiva.
Principais Conclusões
Os HF sempre foram uma grande preocupação no setor de aviação e ainda mais para os subsetores que têm quase nenhuma ou nenhuma regulamentação para atenuar os problemas associados a este elemento.
A partir do inquérito lançado aos pilotos foram obtidas 41 respostas. A partir deste levantamento concluiu-se que a maioria dos participantes tem uma quantidade de sono perto do recomendado, mas com uma boa qualidade. Os inquiridos consideraram o álcool e o tempo de sono como os fatores que mais afetam os níveis de fadiga e que na sua maioria já teriam experienciado efeitos da fadiga cognitiva. A maioria dos indivíduos inquiridos não voava em dias em que tivessem atividades laborais, não relacionadas à operação de aeronaves. A partir das questões finais da pesquisa, também foi percetível que alguns dos indivíduos inquiridos apresentavam problemas relacionados com a fadiga cognitiva.
A partir do caso de estudo, foi também possível observar a influência da cafeína e do exercício físico no desempenho do piloto, sendo que a cafeína disfarçou o desempenho real de um dos indivíduos e o exercício físico piorou os seus níveis de desempenho. Perceberam-se também alguns dos efeitos da quantidade e qualidade do sono no desempenho e na recuperação da fadiga.
Os pilotos que participaram neste caso de estudo tiveram uma vida normal durante o tempo de teste, o que possibilitou que se constatasse que estes já apresentavam fadiga cumulativa. Não foi possível aprofundar o estudo sobre esta fadiga acumulada, uma vez que não havia dados relacionados à carga de trabalho das atividades laborais do dia-a-dia executadas por estes pilotos.
A partir dos dados recolhidos, não foi possível visualizar quaisquer relações entre a Samn-Perelli Escala de Fadiga de 7 pontos (SPS) e os dados objetivos do Psychomotor Vigilance Test (PVT) e os valores de alerta SAFTE (Sleep, Activity, Fatigue, and Task Effectiveness). Apenas em alguns dias mais extremos de fadiga, ocorreram algumas mudanças nos valores de SPS.
Antes, durante e depois dos voos, os níveis de pontuação do SAFTE nunca passaram do ponto de menor risco de acidente ou erro grave, mas isso pode ser explicado pelos curtos tempos de voo realizados neste tipo de aviação. Nos testes de PVT, alguns pilotos tinham valores que os colocaram próximo ou de um risco elevado de acidente ou erro grave, mas na maioria dos casos eles permaneceram no espectro de risco muito baixo a baixo.
Para a questão mais importante desta dissertação é necessário ter em conta que a maioria dos indivíduos que voam neste segmento da aviação têm vidas normais e empregos o que promove algum tipo de fadiga acumulada devido a horários de trabalho, restrição de horas de sono e cargas de trabalho. Cabe ao piloto entender a sua condição antes de operar uma aeronave, e é aí que está o maior problema, porque somos maus juízes do nosso próprio desempenho. Assim, a fadiga cognitiva pode ser uma causa ou uma das causas de ocorrências relacionadas a atos inseguros no segmento da aviação geral, como foi provado com alguns valores obtidos pelos voos do piloto 3.
Perspetivas de Investigação Futuras
Durante o desenvolvimento desta dissertação, alguns tópicos foram reconhecidos como úteis para serem implementados em trabalhos futuros para que seja possível entender melhor a evolução da fadiga cognitiva e o impacto de fatores sobre ela. Com isso, acredita-se que os próximos passos deste trabalho devem cruzar as seguintes linhas de investigação:
• Adição de mais fatores ao estudo - como carga de trabalho, tempo de refeição e composição da mesma - uma vez que estes podem ter grandes impactos no nível de
Table of Contents
... 1
1.1. Motivation ... 1
1.2. Object and Objectives ... 3
1.3. Previous Work ... 3
1.4. Methodology ... 4
1.5. Dissertation Structure ... 5
... 7
2.1. Introduction ... 7
2.2. Definition of Human Factor, Accident and Incident ... 7
2.3. Human Factor Analysis and Classification System (HFACS) ... 8
2.3.1. Unsafe Acts ... 9
2.3.2. Preconditions to Unsafe Acts ... 9
2.3.3. Unsafe Supervision ... 9
2.4. Statistics of HF in Portugal ... 10
2.5. Fatigue and Types of Fatigue ... 11
2.5.1. Fatigue Definition ... 11
2.5.2. Types of Fatigue ... 12
2.5.3. Hazards ... 12
2.5.4. Accident with Fatigue ... 12
2.6.1. Types of Sleep... 15
2.6.2. Circadian Cycles and Effects on Sleep and Performance ... 17
2.6.3. Sleep-Wake Homeostasis and the Sleep Drive ... 18
2.6.4. Factors that Affect Sleep Quality ... 18
2.6.5. Influence of Workload on Fatigue ... 21
2.7. Conclusion ... 22
... 23
3.1. Introduction ... 23
3.2. Samn-Perelli 7-Point Fatigue Scale (SPS) ... 23
3.3. Sleep Diaries ... 25
3.4. Psychomotor Vigilance Task (PVT) ... 27
3.5. Actiwatch (ReadibandTM 5) ... 28 3.5.1. SAFTETM ... 30 3.6. Conclusion ... 32 ... 33 4.1. Introduction ... 33 4.2. Survey ... 33 4.2.1. Question 1 ... 33 4.2.2. Question 2 ... 34
4.2.6. Question 6 ... 37 4.2.7. Question 7 ... 38 4.2.8. Question 9 ... 38 4.2.9. Question 10 ... 39 4.2.10. Question 11 ... 40 4.2.11. Question 12 ... 41 4.2.12. Question 14 ... 42 4.2.13. Question 15 ... 42 4.2.14. Question 16 ... 43 4.2.15. Question 17 ... 44 4.2.16. Question 18 ... 44 4.2.17. Question 19 ... 45 4.2.18. Question 20 ... 46 4.2.19. Question 21 ... 46 4.2.20. Question 22 ... 47 4.2.21. Question 23 ... 48 4.2.22. Question 24 ... 48 4.2.23. Question 25 ... 49 4.3. Experimental Work ... 50 4.3.1. Preparation ... 50 4.3.2. Study Implementation ... 50
... 53
5.1. Introduction ... 53
5.2. Survey Analysis ... 53
5.3. Experimental Work Results and Analysis ... 55
5.4. Conclusion ... 73
... 75
6.1. Dissertation Conclusions ... 75
6.2. Concluding Remarks ... 76
6.3. Prospects for Future Work ... 77
References ... 79
Annexe 1- Survey... 83
Annexe 2- Documents Delivered to the Pilots ... 89
List of Figures
Figure 1 – Percentage of accidents and incidents on the various domain from 2010 to 2017 –
Source: own elaboration based on [3] ... 1
Figure 2 - Percentage of final reports of accidents and incidents with HF per year – Source: own elaboration based on [3] ... 2
Figure 3 – Methodology schematics from literature review - Source: own elaboration ... 4
Figure 4 - Methodology schematics from case study - Source: own elaboration ... 5
Figure 5 – Unsafe acts - Source: own elaboration ... 9
Figure 6 – Preconditions for unsafe acts - Source: own elaboration ... 9
Figure 7 – Unsafe supervision - Source: own elaboration ... 10
Figure 8 - Percentage of HFACS levels on final reports of accident and incident from 2010 to 2017 – Source: own elaboration based on Table 2 ... 11
Figure 9- ATR 72-212 in is final Position on the runway [17]... 13
Figure 10 – Proportion of the night spent in each type of sleep, for a young adult [6] ... 16
Figure 11 – Sleep Hypnogram for a healthy adult sleeping 7-8 hours [7] ... 16
Figure 12 – Circadian rhythms of a short-haul pilot [6] ... 17
Figure 13 – Relation between circadian rhythm and homeostatic sleep drive [7] ... 18
Figure 14 – Impact of different nightly times in bed (TIB) on daytime performance [6] ... 20
Figure 15 – The Cognitive Demand model - Source: own elaboration based on [20] ... 21
Figure 16 – Samn-Perelli 7-point fatigue scale [21] ... 24
Figure 17 - SPS fatigue scale table - Source: own elaboration ... 24
Figure 20 – Smartphone application Sleep-2-Peak [24] ... 27
Figure 21 – Use of Sleep-2-Peak - Source: own elaboration based of [24] ... 28
Figure 22 – ReadibandTM 5 [26] ... 28
Figure 23 – High level overview of the three step state determination logic [28] ... 29
Figure 24 – Actigraphy obtained from the motion or activity detected by the actiwatch and estimated sleep/awake periods [29] ... 30
Figure 25 – SAFTETM alertness score [7] ... 31
Figure 26 - SAFTETM model results over a period of six days [29] ... 31
Figure 27 – Risk of accident [7] ... 32
Figure 28 – Age [%], results from question 1 - Source: own elaboration ... 34
Figure 29 – Gender [%], results from question 2 - Source: own elaboration ... 34
Figure 30 - Aviation as a professional activity [%], results from question 3 - Source: own elaboration ... 35
Figure 31 - Number of selections by category of flight from a total of answer [%], results from question 4 - Source: own elaboration ... 36
Figure 32 – Number of selections by type of flight license from a total of answer [%], results from question 5 - Source: own elaboration ... 37
Figure 33 – Medical class license [%], results from question 6 - Source: own elaboration ... 37
Figure 34 - Number of selections by factors from a total of answer [%], results from question 8 - Source: own elaboration ... 38
Figure 35 – Error due to cognitive fatigue [%], results from question 9 - Source: own elaboration ... 39
Figure 37 - Labor activities before flight [%], results from question 11 - Source: own elaboration ... 41 Figure 38 - Time of flight [%], results from question 12 - Source: own elaboration ... 41 Figure 39 - SPS fatigue level before flight [%], results from question 14 - Source: own elaboration ... 42 Figure 40 - SPS fatigue level after flight [%], results from question 15 - Source: own elaboration ... 43 Figure 41 - Hours of sleep [%], results from question 16 - Source: own elaboration ... 43 Figure 42 - Number of awakes [%], results from question 17 - Source: own elaboration ... 44 Figure 43 - Difficulty initiating routine [%], results from question 18 - Source: own elaboration ... 45 Figure 44 - Tiredness after waking up [%], results from question 19 - Source: own elaboration ... 45 Figure 45 - Drowsiness during the day [%], results from question 20 - Source: own elaboration ... 46 Figure 46 - Practice exercise with regularity [%], results from question 21 - Source: own elaboration ... 47 Figure 47 - Difficulty concentrating [%], results from question 22 - Source: own elaboration 47 Figure 48 - Difficulty finding the right words [%], results from question 23 - Source: own elaboration ... 48 Figure 49 - Memory problems [%], results from question 24 - Source: own elaboration ... 49 Figure 50 - Easily loses interest in activities [%], results from question 25 - Source: own elaboration ... 49 Figure 51 - Daily procedure for each individual - Source: own elaboration ... 51 Figure 52 – Sleep quantity and PVT after sleep (Pilot 1) - Source: own elaboration ... 57
Figure 54 - PVT after sleep and SPS after sleep (Pilot 1) - Source: own elaboration ... 58
Figure 55 - PVT before sleep and SPS before sleep (Pilot 1) - Source: own elaboration ... 59
Figure 56 - Sleep quantity and PVT after sleep (Pilot 2) - Source: own elaboration ... 61
Figure 57 - Awakenings per hour and PVT after sleep (Pilot 2) - Source: own elaboration ... 62
Figure 58 - PVT after sleep and SPS after sleep (Pilot 2) - Source: own elaboration ... 63
Figure 59 - PVT before sleep and SPS before sleep (Pilot 2) - Source: own elaboration ... 63
Figure 60 - Sleep quantity and PVT after sleep (Pilot 3) - Source: own elaboration ... 67
Figure 61 - Awakenings per hour and PVT after sleep (Pilot 3) - Source: own elaboration ... 67
Figure 62 - PVT after sleep and SPS after sleep (Pilot 3) - Source: own elaboration ... 68
List of Tables
Table 1 – Number of reports with HF on the domain of general aviation - Source: own elaboration
based on [3] ... 2
Table 2 – Classification of final reports using HFACS - Source: own elaboration ... 10
Table 3 – Fulfilment of SPS table according to the type of flight - Source: own elaboration .. 25
Table 4 – Time periods according to the time of flight - Source: own elaboration ... 25
Table 5 – Results from question 1 - Source: own elaboration ... 34
Table 6 - Results from question 2 - Source: own elaboration ... 34
Table 7 - Results from question 3 - Source: own elaboration ... 35
Table 8 – Results from question 4 - Source: own elaboration ... 35
Table 9 – Results from question 5 - Source: own elaboration ... 37
Table 10 – Results from question 6 - Source: own elaboration ... 37
Table 11 - Results from question 7 - Source: own elaboration ... 38
Table 12 - Results from question 9 - Source: own elaboration ... 39
Table 13 - Results from question 10 - Source: own elaboration ... 39
Table 14 - Results from question 11 - Source: own elaboration ... 40
Table 15 - Results from question 12 - Source: own elaboration ... 41
Table 16 - Results from question 14 - Source: own elaboration ... 42
Table 17 - Results from question 15 - Source: own elaboration ... 42
Table 18 - Results from question 16 - Source: own elaboration ... 43
Table 21 - Results from question 19 - Source: own elaboration ... 45 Table 22 - Results from question 20 - Source: own elaboration ... 46 Table 23 - Results from question 21 - Source: own elaboration ... 46 Table 24 - Results from question 22 - Source: own elaboration ... 47 Table 25 - Results from question 23 - Source: own elaboration ... 48 Table 26 - Results from question 24 - Source: own elaboration ... 48 Table 27 - Results from question 25 - Source: own elaboration ... 49 Table 28 – Set of colours and classification - Source: own elaboration ... 55 Table 29 – Risk of accident or serious error classification by RTi (Pilot 1) - Source: own elaboration ... 55 Table 30 – Pilot 1 sleep quality and quantity - Source: own elaboration ... 56 Table 31 – Pilots performance measured by SAFTETM, SPS and PVT (Pilot 1) - Source: own elaboration ... 58 Table 32 – Data from flight days (Pilot 1) - Source: own elaboration ... 59 Table 33 – Data from pilot 1 flight nº1 - Source: own elaboration ... 59 Table 34 - Data from pilot 1 flight nº2 - Source: own elaboration ... 60 Table 35 - Risk of accident or serious error classification by RTi (Pilot 2) - Source: own elaboration ... 60 Table 36 - Pilot 2 sleep quality, quantity and habits - Source: own elaboration ... 61 Table 37 - Pilots performance measured by SAFTETM, SPS and PVT (Pilot 2) - Source: own elaboration ... 62
Table 41 - Data from pilot 2 flight nº3 - Source: own elaboration ... 65 Table 42 - Data from pilot 2 flight nº4 - Source: own elaboration ... 65 Table 43 - Risk of accident or serious error classification by RTi (Pilot 3) - Source: own elaboration ... 66 Table 44 - Pilot 3 sleep quality, quantity and habits - Source: own elaboration ... 66 Table 45 - Pilots performance measured by SAFTETM, SPS and PVT (Pilot 3) - Source: own elaboration ... 68 Table 46 - Data from flight days (Pilot 3) - Source: own elaboration ... 69 Table 47 - Data from pilot 3 flight nº1 - Source: own elaboration ... 70 Table 48 - Data from pilot 3 flight nº2 - Source: own elaboration ... 70 Table 49 - Data from pilot 3 flight nº3 - Source: own elaboration ... 71 Table 50 - Data from pilot 3 flight nº4 - Source: own elaboration ... 71 Table 51 – Average values of all tested pilots - Source: own elaboration ... 72
List of Acronyms
ANAC Agência Nacional de Aviação Civil
APAU Associação Portuguesa de Aviação Ultraleve FMG Fatigue Management Guide for Airline Operators
GPIAAF Gabinete de Prevenção e Investigação de Acidentes com Aeronaves e de Acidentes Ferroviários
HF Human Factors
HFACS Human Factors Analysis and Classification System IAS Instrument Air Speed
ICAO International Civil Aviation Organization IEA International Ergonomics Association ILS Instrument Landing System
Non-REM Non-Rapid Eye Movement PIC Pilot In Command
PF Pilot Flying PM Pilot Monitoring
PVT Psychomotor Vigilance Test REM Rapid Eye Movement
SOP Standardized Operations Manual SPO Specialized Operations
SPS Samn-Perelli Seven-point fatigue Scale SWS Slow Wave Sleep
TIB Time In Bed
TRT Transportation Research Team VAS Visual Analog Scales
VFR Visual Flight Rules WOCL Window Of Circadian Low
Nomenclature
VAPP Approach speed [kt]
VGA Go Around speed [kt]
VMCA Minimum aerodynamic Control speed with critical engine failure [kt]
RTI Reaction Time [ms]
Introduction
1.1. Motivation
In the early days of aviation, one believed that approximately 80% of accidents were caused by mechanical failures, and the other 20% by human error. Today due to the development of technology and the implementation of better and more rigorous maintenance on aircraft, mechanical failures only cause 20% of accidents and human error takes the other 80% [1],[2]. In national territory, and after an analysis of all final reports of accidents and incidents from 2010 up until 2017, it was easily verifiable that most accidents occur in the domain of general aviation as shown in Figure 1.
Figure 1 – Percentage of accidents and incidents on the various domain from 2010 to 2017 – Source: own elaboration based on [3]
An in-depth analysis on the data of 66 final reports related to the domain of general aviation and using The Human Factors Analysis and Classification System (HFACS) we obtained the results provided in Table 1 and Figure 2. From this analysis, it’s concluded that 81.82% of the final reports had indices of Human Factors (HF).
0,00% 10,00% 20,00% 30,00% 40,00% 50,00% 60,00% 70,00% 80,00% 90,00% 100,00% 2017 2016 2015 2014 2013 2012 2011 2010 Total CAT Aeroplanes CAT Helicopters SPO Aeroplanes SPO Helicopters General Aviation
Table 1 – Number of reports with HF on the domain of general aviation - Source: own elaboration based on [3]
Year Total of final reports reports with HF Total of final Total of HF Final reports with HF [%] Average of HF per final report
2017 1 1 5 100.00 5.00 2016 3 2 3 66.67 1.00 2015 6 3 9 50.00 1.50 2014 7 6 19 85.71 2.71 2013 1 1 2 100.00 2.00 2012 11 6 18 54.55 1.64 2011 8 8 19 100.00 2.38 2010 29 27 77 93.10 2.66 Total 66 54 152 81.82 2.30
Figure 2 - Percentage of final reports of accidents and incidents with HF per year – Source: own elaboration based on [3]
On the premises of the results obtained and displayed above, came to our attention that HF on general aviation is a subject where there is a lack of studies and regulations.
Thus, one main objective of this study is to discover the main human causes of accidents and incidents in Portugal and how these HF have an impact during operation on non-pressurized airplanes that are normally used in general aviation.
0,00 10,00 20,00 30,00 40,00 50,00 60,00 70,00 80,00 90,00 100,00 2017 2016 2015 2014 2013 2012 2011 2010 Total
1.2. Object and Objectives
In this study, the object under evaluation will be the performance of the pilots in non-pressurized aircraft, more specifically the case of cognitive fatigue and flight safety.
The objective of this dissertation is to understand the impact of cognitive fatigue as a contributory factor on the occurrence of incidents and accidents, by using the science principles present in the Fatigue Management Guide for Airline Operators (FMG) [6]. It will also be interpreted the evolution of cognitive fatigue, and its impact in the pilot performance throughout the operation of the aircraft; simultaneously it will be drawn a comparison of the fatigue experienced by the individuals that took part in this study and the real deterioration of their alertness measured by the equipment utilized.
Conclusions will also be drawn from: the study of final reports of occurrences from Gabinete de Prevenção e Investigação de Acidentes com Aeronaves e de Acidentes Ferroviários (GPIAAF), using HFACS; data acquired experimentally during and outside the operation of the aircraft; and the results obtained on a survey launched to pilots, on the subject of cognitive fatigue.
1.3. Previous Work
In the theme of flight performance in unpressurized aircraft, there has already been done some studies by researchers from University of Beira Interior (UBI) Transportation Research Team (TRT) on the subjects of:
• “Psychophysiological Factors Analysis in Unpressurized Aircraft Cabins” by Ana Catarina Casaleiro Coelho, 2014, MSc Aeronautical Engineering. University of Beira Interior [8]. • “Pilots Performance and Flight Safety. Flight Physiology in Unpressurized Aircraft Cabins” by Sara Zorro, 2012, MSc Aeronautical Engineering. University of Beira Interior [9].
• “Unpressurized Light Aviation Aircrafts. Flight and Physiological Data Acquisition System” by André Marques, 2012, MSc Aeronautical Engineering. University of Beira Interior [10].
• “Desempenho de Pilotos e Segurança de Voo. O Caso da Hipóxia em Aviação Desportiva” by Leandro Rocha, 2011, MSc Aeronautical Engineering. University of Beira Interior [11]. This dissertation acts as a follow up to these studies in unpressurized aircraft and general aviation.
1.4. Methodology
The development of this dissertation began with a literature review of HF and final reports of occurrences from GPIAAF. From the review of the final reports from 2010 to 2017 it was taken the HF that had indices of being present during the accidents and incidents using HFACS. Then, from this Review of final reports it was concluded that the HF with more frequency was at the level of unsafe acts that is linked with cognitive fatigue. With this an exhaustive research was made on fatigue, its impact on the operation of aircraft, existing legislation and methods for measuring it (Figure 3).
Figure 3 – Methodology schematics from literature review - Source: own elaboration
After gathering all information, a case study was established with an experimental work where were used 4 methods to measure fatigue, 2 objective measures (PVT and Actiwatch) and 2 subjective measures (SPS and Sleep diaries). Meanwhile, it was also launched an online survey to international and national pilots to understand what it is the common knowledge on the topic of cognitive fatigue. An analysis was made to the results of the online survey and experimental work, from this analysis conclusions were withdrawn to respond to the objectives of this dissertation (Figure 4).
Figure 4 - Methodology schematics from case study - Source: own elaboration
1.5. Dissertation Structure
This dissertation has a six chapters structure.Chapter 1 is the study introduction, and is composed of three sub-chapters: motivation, object and objective, and the structure of the dissertation, respectively.
Chapter 2 consists of the literature review and contains the information that contextualizes and emphasizes the relevance of this study. It entails seven sub-chapters being them: introduction, the definition of HF, accident and incident, HFACS, fatigue and biologic rhythms, statistics, accident and incident with fatigue, and conclusions.
Chapter 3 consists of the methods used in this study to measure and determinate the levels of fatigue and alertness, as well as a description of how they are used. It contains six sub-chapters: introduction, Samn-Perelli 7 Point Fatigue Scale (SPS), sleep diaries, actiwatch (Readiband 5), Psychomotor Vigilance Test (PVT), and conclusion. These methods can be divided into two types of data acquisition: objective data and subjective data.
Chapter 4 consists of the case study exposed on this dissertation and it is divided into four sub-chapters: an introduction, the questions and results of the online survey launched to the national pilots, the experimental work implemented in this study, and conclusion.
Chapter 5 contemplates an analysis of the results from the survey from the previous chapter and the results and analysis of the experimental work. It is divided into four sub-chapters being them: an introduction, survey analysis, experimental work results and analysis, and conclusion.
Chapter 6 (and last) is the dissertation conclusion and future work. Contains three sub-chapters: the dissertation conclusions taken from this study, concluding remarks and prospects for future work in this subject.
The Human Factor in Aviation
2.1. Introduction
The main objective of most aeronautical organizations, such as GPIAAF, the Agência Nacional de Aviação Civil (ANAC), and the International Civil Aviation Organization (ICAO), is the safety of civil aviation. The HF are one of the major cause of accidents/incidents since the beginning of aviation history.
The HF began to be recognized and institutionalized by various organizations such as the Ergonomics Research Society in 1949, the Human Factors Society in 1957, and the International Ergonomics Association (IEA). As early as 1986, ICAO adopted the Resolution A26-9 on Flight Safety and HF. These measures were taken with the aim of: “To improve safety in aviation by making States more aware and responsive to the importance of human factors in civil aviation operations through the provision of practical human factors material and measures developed on the basis of experience in States” [12], pp.i.
The human element is indeed the most versatile and valuable factor in the aviation system, but it is also the most vulnerable to influences that affect its performance. When the pilot has these lower performances, it is often classified in several documents as “pilot error”, which indicate where there was a failure, but does not indicate why it occurred or why did the performance of the pilot was not on the optimal level for operation.
2.2. Definition of Human Factor, Accident and Incident
The HF refers to the individuals daily work situations, relationships with machines, processes, and the surrounding environment. In a more concrete way, it is a science applied to the ergonomics that we normally consider to cover the adaptation to the work or the work conditions, in order to improve the performance of a worker [13].
The definition of accident and incident is expressed in ICAO Annex 13 - Aircraft Accident and Incident Investigation [14], which contains the international standards and recommendations of practices for the investigation of aircraft accidents and incidents. Accordingly, accident is an occurrence associated with the operation of an aircraft, which occurs between the time of embarkation and disembarkation, in which:
1) A person is fatally or seriously injured, resulting in: • Being on the aircraft;
• Some type of contact with the aircraft or subsystems; • Direct exposure to engine jet.
2) The aircraft sustains damage or structural failure that:
• Adversely affects the structural strength, performance and characteristics of the aircraft;
• They require further repair or replacement of affected components, except for engine failure or damage, when it is limited to the engine, or its components;
• They cause limited damage to the propeller, wing tip, antennae, tires, brakes, small roughness or holes in the outer layer of the aircraft.
3) The aircraft is lost or inaccessible.
An incident is an occurrence which is not an accident, in other words, it does not satisfy the description above, it is associated with the operation of an aircraft with effects that may affect the safety of operations.
2.3. Human Factor Analysis and Classification System (HFACS)
Although HF are connected to most accidents, the reporting systems are not developed based on them. As a result, most accident databases are not compatible with a traditional analysis of human error, making it difficult to establish an intervention strategy to attenuate the occurred human error.To solve this problem, a human factor analysis and classification system (HFACS) [15] has been developed, in order to detect the occurrence of HF, therefore allowing an improvement in the investigation of accidents.
Based on the concept of active and latent failures [16], HFACS has four levels of failure: • Level 1 - Unsafe acts;
• Level 2 - Preconditions for unsafe acts; • Level 3 - Unsafe supervision;
2.3.1. Unsafe Acts
Unsafe acts occur every time a subject fails to obey the rules of safety or protocols. This level is subdivided into two categories: errors and violations. Mistakes generally represent the mental or physical activities performed by an individual who failed to achieve the expected result. On the other hand, the violations refer to voluntary acts of non-compliance with the rules and regulations governing the safety of operations (Figure 5).
Figure 5 – Unsafe acts - Source: own elaboration
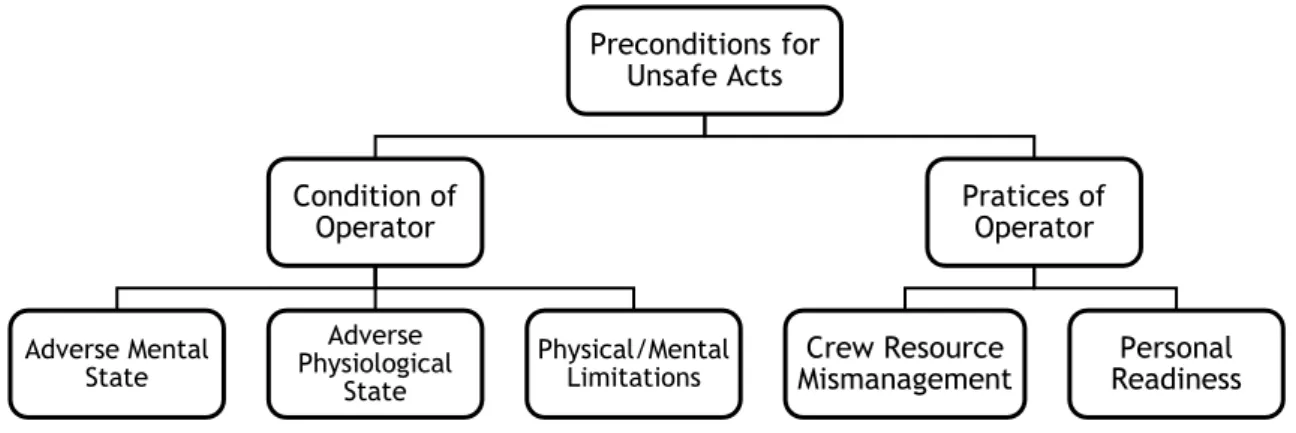
2.3.2. Preconditions to Unsafe Acts
Preconditions are essential to deepen the "why" of the occurrence of unsafe acts and to eliminate factors that cause accidents and incidents. The researchers [15] divided the unsafe acts into two preconditions: the conditions of the operator and the practices committed by the operator, as observed in Figure 6.
Figure 6 – Preconditions for unsafe acts - Source: own elaboration
2.3.3. Unsafe Supervision
In addition to the causal factors associated with the pilot/operator, Reason [16] traced the Unsafe Acts
Errors
Decision Errors Skill-Based Errors Perceptual Errors
Violations Routine Exceptional Preconditions for Unsafe Acts Condition of Operator Adverse Mental State Adverse Physiological State Physical/Mental Limitations Pratices of Operator Crew Resource
inadequate supervision, improperly planned operations, failure to correct a known problem, and supervision infractions (Figure 7).
Figure 7 – Unsafe supervision - Source: own elaboration
2.4. Statistics of HF in Portugal
The implementation of the HFACS, mentioned above on the sub-chapter 2.3, to the final reports of incidents and accidents of the GPIAAF from 2010 to 2017 [3], allowed the acquisition of the data presented in the following table (Table 2). As the case studies are only for general aviation and SPO of helicopters and airplanes, where the use of aircraft with non-pressurized cabins predominates and where there is not always an influence of an organization, the factors regarding organizational influences were not applied as already stated on the Sub-chapter 2.3.
Table 2 – Classification of final reports using HFACS - Source: own elaboration
Using the data from the previous Table 2, the graph of Figure 8 was drawn with the percentage of each level of HF per year.
Unsafe Supervision Inadequate Supervision Improperly Planned Operations Failure to Correct
a Know Problem Supervision Infractions
Ano Unsafe acts Preconditions for unsafe acts Unsafe supervision Total
2017 5 0 0 5 2016 2 0 1 3 2015 8 0 1 9 2014 15 1 3 19 2013 1 1 0 2 2012 15 3 0 18 2011 9 8 2 19 2010 67 5 5 77 Total 122 18 12 152
Figure 8 - Percentage of HFACS levels on final reports of accident and incident from 2010 to 2017 – Source: own elaboration based on Table 2
From Figure 8 is perceivable that the cause of most accidents/incidents in Portugal is at the level of unsafe acts that are related to cognitive fatigue as shown on Sub-chapter 2.5.3.
2.5. Fatigue and Types of Fatigue
2.5.1. Fatigue Definition
According to ICAO, fatigue is characterized as a physiological state of reduced mental or physical performance capacity, result of the lack of sleep, prolonged wakefulness, circadian phase or workload (mental and/or physical activity), and may impair the level and the ability of a crew member to operate an aircraft or perform safety-related tasks [5].
So fatigue can be described as a reduced ability to perform operational tasks and can be considered as an imbalance between [6]:
• Physical and mental effort of all wake activities (not only those of operation); and • Recovery from this effort, which requires sleep (except recovery from muscle fatigue). Physical fatigue is defined as an inability to exert force with one’s muscles to the degree that is normally expected. It can be specific to a part of the body or overall tiredness. Physical fatigue is a result of physical exercise or a loss of sleep; this fatigue often leads to
0 10 20 30 40 50 60 70 80 90 100 2017 2016 2015 2014 2013 2012 2011 2010 Total
Mental fatigue, which may include sleepiness, is related to the decrease of attention and ability to perform complex or simple tasks when compared with the regular efficiency of an individual [4].
The fatigue that is studied in this dissertation is that caused by the lack of sleep or inadequate sleep. This type of fatigue is known as "cognitive fatigue" or mental fatigue and is directly linked to reduced alertness, reaction time (RTI), thus impairing the decision making of the operator [7].
2.5.2. Types of Fatigue
Fatigue can be divided into three categories [4], being them:
• Transient fatigue is an acute type of fatigue caused by extreme sleep restriction or long periods of wakefulness within 1 or 2 days;
• Cumulative fatigue is brought on by a repeated slight sleep restriction or extended hours awake for a sequence of days;
• Circadian fatigue is a fatigue that is connected to the reduced performance during nighttime, and it is particularly linked to one’s “Window Of Circadian Low” (WOCL), (as referred in Subchapter 2.6.2).
2.5.3. Hazards
Fatigue results in an impairment of an individual normal performance that increases the risk of failure during operation as, for example [4]:
• Increased RTI; • Reduced attention; • Impaired memory; • Withdrawn mood; • Inaccurate flying;
• Inadequate decision making; • Loss of situational awareness. 2.5.4. Accident with Fatigue
The accident report “Hard landing during a porpoise landing”, from GPIAAF, with document identification number 15/ACCID/2016_RF [17], is a case were fatigue is evident.
Figure 9- ATR 72-212 in is final Position on the runway [17]
An ATR 72-212A with registration CS-DJF (Figure 9) operated by White Airways on behalf of TAP Express performed a regular commercial passenger transport flight in nightly environment, between Porto airport (ICAO code: LPPR) and Lisbon airport (ICAO code: LPPT) with 20 passengers and 4 crew members on board. During the final approach to the runway 21 at LPPT pilots found conditions of rain and wind 240/09 with gusts up to 20kt.
At 21:34 UTC, the aircraft made the first touch on the runway, bounced, and touched hard again with the nose landing gear. Still, with too much kinetic energy, the aircraft bounced again and came to touch for the third time on the runway, continuing the phenomenon of porpoise landing, causing the separation of the wheels and respective axles of the nose landing gear. Finally, after the fourth touch, the aircraft stabilized and completed the landing, with the nose landing gear leg structure in contact with the runway surface, stopping after crossing the runway 17/35.
On this flight TP1971, the pilot in command (PIC) was the pilot flying (PF) and the co-pilot, second in command (SIC) was the pilot monitoring (PM). The crew performed their sixth journey of the day between Lisbon and Porto in adverse weather conditions. During the preparations for this last flight of the day, the departure briefing procedure was only partial performed and summarized. The crew maintained conversations that were not relevant to the conduct of the flight in the restricted phases of the operational activity, not complying with the sterile cockpit procedure, foreseen in the operator’s standardized operations manual (SOP). The approach to
The calculated speeds by PM and recorded on the landing card refer to an estimated landing weight of 17.118kg and the following speeds: VAPP (Approach speed) 101kt, VMCA (Minimum aerodynamic Control speed with critical engine failure) 107kt and VGA (Go Around speed) 110kt. The considered estimated wind in LPPT was 210/13kt. The PM made a speed callout above the calculated "speed" (116 KIAS) according to the operator's SOP procedure, since the IAS (Indicated Air Speed) was above the VAPP that was calculated at 101 KIAS, and already corrected for the expected wind on the runway. There was no answer and confirmation from the PIC/PF to the speed warning.
Using the Human Factors Analysis and Classification System (HFACS) as a framework to provide useful means for a summarized evaluation, the incident analysis can be divided into four levels: Level 1: Unsafe acts: (Crew)
• Skill-based errors: omitted steps in the procedures and poor pilot technique; • Decision Errors: with an improper procedure and poor decision.
Level 2: Precondition for unsafe acts: (Crew)
• Adverse mental and physiological state: mental and physical fatigue; • Crew resource management: with communication failures.
Level 3: Unsafe supervision: (Air Operator)
• Inadequate supervision: Operator failed to provide the crew with guidance, training, and track of performance.
Level 4: Organizational Influences: (Air Operator and/or Regulator)
• Operational process: Lack of oversight with effective risk management and safety programs implementation.
The investigation team concluded that probable causes were the decision made by the PIC/PF to proceed and force the landing not complying with the un-stabilized approach criteria, with IAS well above the reference VAPP. The contributing factors were fatigue that may have contributed to the accident by directly affecting pilot (PIC/PF) performance.
expected that in a non-pressurized aircraft the occurrence of this type of HF could have far more serious consequences for the aircraft, pilot(s) and passengers.
2.6. Scientific Principles for Fatigue Management
Following the Fatigue Management Guide for Airline Operators, second edition [6], there are four focal points on managing fatigue:
1. The circadian body clock affects the timing and quality of sleep and produces daily highs and lows in performance capacity on various tasks;
2. Periods of wakefulness need to be limited. Getting enough sleep (both quantity and quality) on a regular basis is essential for restoring the brain and body;
3. Reducing the amount or the quality of sleep, even for a single night, decreases the ability to function and increases sleepiness the next day;
4. The workload can contribute to crew member fatigue. Low workload may unmask physiological sleepiness while high workload may exceed the capacity of a fatigued individual.
An ideal amount of sleep per night may vary between individuals, but most adults require between 7 and 9 hours, and it is clear that sleep cannot be sacrificed without consequences. Sleep has a vital role in memory and learning, maintaining alertness, performance, mood, general health, and well-being. So, sleep is one of the crucial points of this study.
2.6.1. Types of Sleep
Currently, the study and analysis of sleep use electrical patterns in brainwave activity, eye movements, and muscle tone in order to understand the effects of sleep in one’s performance. It was through these that two very different types of sleep were detected:
• Sleep with non-Rapid Eye Movement (non-REM); and • Sleep with Rapid Eye Movement (REM).
During the non-REM sleep, brain wave activities gradually decrease when compared to waking brainwave activity; most adults spend around 55% of sleep in this type of sleep (Figure 10). According to the characteristics of brainwaves, this type of sleep is divided into three stages:
• Stages 1 and 2 is where our brain enters sleep and it represents a lighter sleep • Stage 3 is known as Slow Wave Sleep (SWS) or deep sleep, at this phase brain cells
blocked. The SWS stage is necessary for learning since it is at this stage that the consolidation of certain types of memory occurs.
In REM sleep the body cannot move in response to brain signals so that dreams are not displayed by physical movements. In this type of sleep, the brain is restoring itself and sorting the information from the previous day to related memories already stored. Most adults typically spend about a quarter (25%) of their sleep in this type (Figure 10).
Figure 10 – Proportion of the night spent in each type of sleep, for a young adult [6]
Figure 11 depicts a hypnogram of an adult sleeping between 7-8 hours and the phases it goes through that time, respectively. As seen on Figure 11 the individual enters sleep in stage 1 and stage 2 then moves one to medium to deep sleep where he spends most of his cycle returning to stage 1 and stage 2 and going into rem phase, after which he starts a new cycle.
2.6.2. Circadian Cycles and Effects on Sleep and Performance
Cognitive fatigue is mostly linked to the temporal organization of the human biological system, which is one of the most remarkable features of living organisms. The field of knowledge that studies this temporal organization is Chronobiology which examines periodic (cyclic) phenomena characterized by a wide spectrum of rhythms with different frequencies and amplitudes in living organisms. According to their periodicity (τ), the biological rhythm [18] directly linked to this type of fatigue is the circadian rhythms (Latin: circa diem = about one day), due to their great influence in daily life. These rhythms have a periodicity of between 20 h and 28 h.
Circadian rhythms include [6]:
• Rhythms in the subjective sensations of fatigue and sleepiness; • Rhythms in the ability to perform mental and physical work; and
• Rhythms in the ability to fall asleep and remain asleep (sleep propensity).
Most of these fluctuations in appetite, blood pressure, body temperature and levels of fatigue change with daylight through a specialized entry pathway of the eyes over which we have little control and are slow to adjust. The morning light shortens the circadian cycle and the light at dusk prolongs the cycle of this biological clock (jet lag).
With consistent and adequate sleep these circadian rhythms, with their ups and downs, are fairly regular and predictable [7].
Circadian cycles schedule the human being for daytime wakefulness and nighttime drowsiness, affecting all aspects of human functioning, resulting in high performance and low-performance cycles (Figure 12). This exerts a strong influence on sleep, creating windows where sleep is promoted and windows where sleep is denied.
As can be seen in Figure 12, the Window of Circadian Low (WOCL) occurs at the minimum daily core body temperature that corresponds to the time of day when people feel sleepier and are less able to perform tasks.
2.6.3. Sleep-Wake Homeostasis and the Sleep Drive
Homeostasis [7] is the control mechanisms that keep the body’s various systems in check and in balance. It controls sleep, body temperature, blood and tissue metabolism, and blood pressure. The homeostasis sleep drive works similar to an hourglass, it controls de time since our last sleep until when the sand runs out, and the body is reminded that it needs to sleep again (Figure 13).
Figure 13 – Relation between circadian rhythm and homeostatic sleep drive [7]
2.6.4. Factors that Affect Sleep Quality
To have a night of fully restorative sleep, the brain needs unbroken cycles of non-REM and REM phases. There are several factors that influence the occurrence of these interruptions, which consequently affect the quality and quantity of sleep in general. These factors are [6],[19]:
• Sleep quality and age;
Throughout adult life, the portion of sleep time spent on SWS decreases, particularly among men. In addition, sleep usually becomes more fragmented after the age of 50-60 years. Even so from a practical and scientific point of view, age is not considered a
• Sleep disturbances;
Sleep disorders can reduce the amount and quality of sleep a person can get, even when they spend enough time trying to sleep.
• Caffeine, nicotine, and alcohol;
Caffeine (in coffee, tea, energy drinks, etc.) stimulates the brain, making difficult to fall asleep and disrupting sleep quality. The consumption of caffeine within 4 hours of sleep is likely to disrupt the sleep we get, but it can assist nap recovery [19]. The nicotine contained in cigarettes affects sleep in a manner similar to that of caffeine. Alcohol, which promotes drowsiness, also disturbs sleep because while the body is processing this substance, the brain cannot obtain REM sleep. So, drinking alcohol before sleep is a bad idea since it may help you to fall asleep, but worsens its quality. • Environment;
Environmental factors also influence sleep quality, from the bright light that increases the alertness, the sudden sounds, and the ideal temperature. Falling asleep requires the ability to reduce body temperature (losing heat through the extremities) so that it is easier to fall asleep. For most people, the ideal sleeping temperature is between 18-20ºC.
• Food and diet;
What and when we ingest has a big impact on fatigue management and sleep. Food is a powerful element since different meals have a variety of different impact on our biological system. For example [19]:
a) Meals made up largely of carbohydrates assists sleep;
b) Meals which consists largely of protein promotes wakefulness and activity; c) Regular meal timings help to regulate the circadian body clock;
d) On night shifts, main meals should be taken before 01:00 am;
e) After night duty, a light snack of carbohydrates should be taken no later than two hours before expected sleep time.
Scientific evidence shows that the longer we are awake, the worse it is the state of alertness and performance. This occurs due to increasing homeostatic pressure for sleep associated with long waking periods. Sleeping is the only way to reverse such effects. It is also supported that naps can be used as mitigation of fatigue, justifying that a short nap can improve alertness and
performance. Restricting sleep night after night makes individuals less alert and less functional each subsequent day (Figure 14). This is sometimes described as "sleep debt".
Figure 14 – Impact of different nightly times in bed (TIB) on daytime performance [6]
In the first days of severe restriction of sleep, for example, with 3 hours in bed, individuals can get a sense of drowsiness. However, after several days, they fail to notice the differences although their attention and performance continue to decrease. In summary, as sleep restriction continues, people become less and less able to assess their own functional status. In general, more complex mental tasks, such as decision making and communication, seem to be more severely affected by the loss of sleep than simpler tasks. Objective and subjective tests are useful in fatigue management considered to be reliable to measure the impairment related to the sensation of fatigue and performance.
The ability to tolerate sleep loss is largely variable in an individual. But drowsiness eventually becomes oppressive and results in uncontrollable micro-sleeps (momentary lapses in consciousness). In a typical 3 to 4 second micro-sleep, while operating, a lot can happen. Even more alarming is the fact that they may occur before someone feels drowsy or shows any signs of fatigue.
2.6.5. Influence of Workload on Fatigue
The ICAO defines workload as "mental and/or physical activity" that is taken as a potential cause of fatigue in general [6]. There is a broad acceptance of the idea that intermediate levels of workload may contribute to a less impaired performance, since low workloads may have no stimulus, leading to monotony and boredom and high workload situations can exceed an individual's ability, resulting in worse performance.
The workload can have three dimensions:
1. The nature and amount of work to be done (including time on task, difficulty and complexity of task, and intensity of work);
2. Time constraints (including the time that task demands, external factors or by team member);
3. Factors related to the performance capacity of the individual (level of experience and ability, sleep history, and circadian phase).
The cognitive demand for tasks is also an important factor since physical and mental activity require perceptual actions, cognitive actions, and motor skills. This can be understood by looking to the Cognitive Demand model [20], (Figure 15); this model takes in consideration five basic cognitive tasks when performing an activity: Perception, Comprehension, Strategic Thinking, Decision Making, and Execution. These tasks are what permits a person to make the acquisition of situational awareness or the performance of decision-making.
Figure 15 – The Cognitive Demand model - Source: own elaboration based on [20]
The bottom line is a person’s experience of workload in combination of both the actual external demands of the job, and the individual characteristics and expertise of the person doing the work.
2.7. Conclusion
Based on the data presented in the previous sub-chapters is easily concluded that the HF most present in incidents and accidents in Portugal is at the level of unsafe acts, but due to limitations on the investigation of incidents and accidents is difficult to affirm that fatigue is the cause of these unsafe acts. However, these acts can be caused by fatigue being that fatigued people often experience difficulty in increased RTI, reduced attention, impaired memory, withdrawn mood, inaccurate flying, inadequate decision making, and loss of situational awareness.
The cycle of work\fatigue\sleep is a normal part of a healthy human life. This fatigue appears due to changes in the circadian body clock, being that most of these changes are associated with sleep. For a normal adult is expected to sleep normally between seven to eight hours a day; moreover, this sleep should be uninterrupted and include both Rem and non-Rem phases. So, is easily understandable that the issue “fatigue” is a matter of sleep regularity and in/with quantity/quality. Not forgetting that workload is also an important factor and has its impact on fatigue.
The fact is that fatigated individuals are often very poor judges at accessing their own state of alertness.
Fatigue Measurements
3.1. Introduction
To conduct this study, it was used two types of output data, being them subjective data and objective data. These two types of data acquisition give the possibility of having a perception of which is the impairment between the feeling of fatigue and the actual state of the operator. It is used two methods of data acquisition for each type of data, being them:
1. Subjective data
a. Samn-Perelli 7-point fatigue scale (SPS); b. Sleep diaries.
2. Objective data
a. Actiwatch (Readiband 5);
b. Psychomotor Vigilance Task (PVT).
These methods for measuring fatigue were taken from the ICAO, Measuring Fatigue by Dr. Michelle Millar, Technical Officer (Human Performance) [21].
3.2. Samn-Perelli 7-Point Fatigue Scale (SPS)
There are several subjective ways of measuring fatigue such as Visual Analog Scales (VAS), but the one being used within the scope of this work is the SPS (Figure 16). The related scale is easy and quick to fill and causes minimal disruption during aircraft operation. It is used in many studies, which gives a possible benchmark for comparing results [21]. But because it is a subjective scale, it has some disadvantages, such as easily presenting errors and not always reflecting reliable results, since the human error of wrongfully perceiving fatigue is always a contributing factor [22].
The scale is described from points, one to seven, as a function of the operating time, the points being marked by predefined periods of time, having the following classification:
1. Completely alert, wide awake; 2. Very alert, but not at peak;
5. Moderately tired;
6. Extremely tired, very difficult to concentrate;
7. Completely exhausted, unable to react and operate effectively.
Figure 16 – Samn-Perelli 7-point fatigue scale [21]
In this case study, the SPS fatigue scale is implemented using the table presented in Figure 17. This table is to be filled during flight with the classification system presented above and also taking into consideration the type of flight as shown in Table 3. These rates are given in pre-determined time periods in accordance with the duration of the flight (Table 4). In the table to be filled is also present spaces for the input of PVT test results (Subchapter 3.4).
Table 3 – Fulfilment of SPS table according to the type of flight - Source: own elaboration
Table 4 – Time periods according to the time of flight - Source: own elaboration
Time of flight <2 hours >2 hours
Time period 15 minutes 30 minutes
3.3. Sleep Diaries
The sleep diaries, observed in Figure 16, are a useful tool to be used along with other measures to perceive the sensations had by an individual in relation to the quantity and quality of sleep. These diaries often ask an individual:
• Where they sleep;
• What time they go to bed and get up; • How much sleep they think they get; • How well they think they sleep.
This type of data permits a comparison between objective periods and quality of sleep, measured by polysomnography or an equal method, and the perceived time and quality of sleep. The diary to be used in this study (Figure 19) was constructed based on the sleep diaries of the National Sleep Foundation [23], (Figure 18), and contains a section for the input of results from the PVT test (Subchapter 3.4).
Type of flight Procedure
Long (To fill according to the time periods present in Table 4)
Circuit
Stop and go, Full-stop and taxi back
(To fill after landing, in the phase of preparation for a new take-off) Touch and go (To fill before and after the flight)
3.4. Psychomotor Vigilance Task (PVT)
The psychomotor abilities of an individual, correlate the cognitive functions with the physical movements. In the PVT test, it is measured the psychomotor speed by looking at an individual’s ability to detect and respond to rapid changes in the environment, such as the presence of a stimulus. The PVT is an important tool in determining an individual's alertness by assessing RTI, movement time and vigilance, thus giving a level of impairment.
In this study, it is used a smartphone application called Sleep-2-Peak (Figure 20) as an evaluation tool of the operator response time.
Figure 20 – Smartphone application Sleep-2-Peak [24]
This application will allow a later comparison of RTI when alert or in the context of prolonged wakefulness, to identify which are the changes related to cognitive fatigue. This test has a duration of 3-minutes, as opposed to the 10-minutes gold standard PVT test, making it easier to apply in studies with short evaluation times. It was already validated that this choice of shorter duration has a low effect on final results since on the longer 10-minute test even severely sleep-deprived individuals will be able to compensate by increasing effort, which will result in inadequate performance. Thus, a valid and sensitive alertness test will capture subtle changes in fatigue-related behaviour, even in a very brief period on a task [25].
This application of this test using, sleep-2-Peak, is performed in the following way: • Seated, with a straight back;
• Both feet on the ground; • Back and arms not supported;
• With the smartphone at the level of the abdomen;
To start the test, it is only necessary to open smartphone application, click on “Do Test” (Figure 21) and after its conclusion the result was written on the referred space of the provided sleep diaries and Samn-Perelli 7-point fatigue scale table.
Figure 21 – Use of Sleep-2-Peak - Source: own elaboration based of [24]
3.5. Actiwatch (Readiband
TM5)
Actiwatches are devices capable of monitoring activity, estimating sleep periods and their quality, and various other parameters depending on the device type. These have advantageous characteristics, such as the fact that they are not intrusive to the operation and are easy to administer. As in the case of this study, they are used in conjunction with the subjective measures, SPS and sleep diaries in order to cross data and make conclusions.
![Figure 1 – Percentage of accidents and incidents on the various domain from 2010 to 2017 – Source: own elaboration based on [3]](https://thumb-eu.123doks.com/thumbv2/123dok_br/18880032.932383/29.892.161.771.564.834/figure-percentage-accidents-incidents-various-domain-source-elaboration.webp)
![Figure 2 - Percentage of final reports of accidents and incidents with HF per year – Source: own elaboration based on [3]](https://thumb-eu.123doks.com/thumbv2/123dok_br/18880032.932383/30.892.179.774.497.789/figure-percentage-final-reports-accidents-incidents-source-elaboration.webp)


![Figure 15 – The Cognitive Demand model - Source: own elaboration based on [20]](https://thumb-eu.123doks.com/thumbv2/123dok_br/18880032.932383/49.892.151.784.733.919/figure-cognitive-demand-model-source-elaboration-based.webp)

![Figure 21 – Use of Sleep-2-Peak - Source: own elaboration based of [24]](https://thumb-eu.123doks.com/thumbv2/123dok_br/18880032.932383/56.892.167.765.236.633/figure-use-sleep-peak-source-elaboration-based.webp)
![Figure 23 – High level overview of the three step state determination logic [28]](https://thumb-eu.123doks.com/thumbv2/123dok_br/18880032.932383/57.892.165.770.329.517/figure-high-level-overview-step-state-determination-logic.webp)
![Figure 24 – Actigraphy obtained from the motion or activity detected by the actiwatch and estimated sleep/awake periods [29]](https://thumb-eu.123doks.com/thumbv2/123dok_br/18880032.932383/58.892.154.785.140.701/figure-actigraphy-obtained-activity-detected-actiwatch-estimated-periods.webp)
