1
M
ASTER
ACTUARIAL SCIENCE
M
ASTER
´
S
F
INAL
W
ORK
Internship Report
MANAGING
LONGEVITY
RISK
FOR
UK
PENSION
FUNDS
LILA ALREFAI
S
UPERVISORS:
D
ANIELA PATEIRO,
F
ÁTIMA PIRES DE LIMA2
M
ASTER
A
CTUARIAL
S
CIENCE
M
ASTER
´
S
F
INAL
W
ORK
Internship Report
MANAGING
LONGEVITY
RISK
FOR
UK
PENSION
FUNDS
LILA ALREFAI
S
UPERVISORS:
D
ANIELA PATEIRO,
F
ÁTIMA PIRES DE LIMA3
Abstract
Most recently pension scheme advisers and trustees have been concerned about the risk of people living longer, and the impact that has on the reserves kept for their allocated funds upon retirement. It is no news to anyone in this industry that mortality rates have been decreasing faster year by year. Such a trend is driven by health improvements, technological advances, and the ability of firms and investment advisers to anticipate risk and limit its effects. Since there is no real market per say to monitor or calculate that risk attributed with people living longer, research has been extensively conducted to manage such risk. This risk is called longevity risk and it directly affects the mortality assumptions set by the team of actuaries conducting a valuation. In this paper we explore longevity risk in the UK pension fund market, in the context of an internship at a major consultancy, and introduce stochastic based models that have been studied in the past, relating these to some relevant tools and software. We emphasize the importance of managing this risk and present innovations in recent years that are related to longevity risk. Several investment techniques / financial products are introduced within the research paper. The focus of this paper was on the transactions that are used typically to manage longevity risk. An application of one of the stochastic models is used using R software package for the purpose of our analysis, so as to estimate the parameters for that model and use the results as a possible illustration.
4
Resumo
Atualmente, as entidades gestoras de fundos de pensões têm mostrado alguma preocupação em relação ao risco dos seus participantes viverem mais do que o inicialmente esperado, assim como em relação ao impacto desta situação nas reservas mantidas pelos fundos para pagamento de pensões a partir da reforma.
Não é novidade para quem trabalha nesta área de negócios que as taxas de mortalidade têm vindo a decrescer nos últimos anos a um ritmo acelerado. Esta tendência é motivada pelas melhorias na área da saúde, avanços tecnológicos e na capacidade das empresas e consultores financeiros de anteciparem este risco e limitar os seus efeitos, Não existindo um mercado real para monitorizar e calcular o risco atribuído ao fato da população viver até mais tarde, várias pesquisas têm vindo a ser conduzidas de modo a conseguir gerir melhor este risco, ao qual chamamos risco de longevidade. Este risco afeta diretamente os pressupostos de mortalidade assumidos pelas equipas atuariais aquando da produção de uma avaliação atuarial. Este trabalho explora o risco de longevidade no mercado de fundo de pensões do Reino Unido, no contexto de um estágio curricular numa grande consultora internacional, e introduz modelos estocásticos estudados no passado, relacionando os mesmos com algumas ferramentas e software relevantes. Damos ênfase à importância de gerir este risco e apresentamos inovações que surgiram nos últimos anos relacionadas com o risco de longevidade. Algumas técnicas de investimento / produtos financeiros são também introduzidos. O principal objetivo deste relatório foi estudar as transações usadas tipicamente para gerir o risco de longevidade. Uma aplicação de um dos modelos estocásticos usando o software R é também usada para o propósito desta análise, assim como para estimar os parâmetros do modelo e usar os resultados como uma possível ilustração.
Palavras-chave: risco de longevidade, modelo estocástico, transações financeiras ligadas à
5
Acknowledgment
I would like to express my special thanks to Daniela Pateiro, my supervisor at Willis Towers Watson in Lisbon, for her support and contribution to this work.
To my parents for their full support, and motivation throughout the whole master’s program, enabling me to develop my academic and professional skills.
A very special thank you to my friends for their support throughout the whole program, Rodrigue Kazzi for his timeliness and guidance. Stephanie Lucic for her motivation and compassion during this year. As well as Andrey Uguarte for his technical input. Thanks to Patricia Oliveira and Paula Atuhaire among other colleagues of the masters.
At last, I would like to express my appreciation to the supervisor Professor Fatima de Lima for her guidance and review of my work.
6
Table of Contents
1.INTRODUCTION AND MOTIVATION ... 1 1.1 Objective and Layout ... 2 2. LONGEVITY RISK PRODUCTS ... 3 2.1 Buy-ins and Buy-outs ... 4 2.2 Q-Forwards ... 5 3. IMPORTANCE OF UNDERSTANDING LONGEVITY RISK ... 6 3.1 Components of Longevity Risk ... 8 3.2 Stochastic Models ... 10 3.2.1 Lee-Carter Model ... 11 3.2.2 Lee Carter Extension- Poisson Lee Carter ... 13 3.2.3 Cairns, Blake, Dowd Model ... 14 3.3 Willis Towers Watson Model ... 15 3.4 Continuous Mortality Improvement Models ... 17 4. LONGEVITY TRANSACTIONS ... 19 4.1 Recent Innovations in Longevity ... 24 5. MORTALITY FORECASTING PRACTICAL EXAMPLE USING R ... 26 5.1 Lee Carter Forecasting Method ... 27 6. ACTUARIAL ASSUMPTIONS ... 30 CONCLUSION ... 33 REFERENCES ... 36 APPENDIX A. R STUDIO CODING ... 38 APPENDIX B. FORECASTING TIME PARAMETER USING LEE CARTER ... 41 APPENDIX C. LIFE TABLE PRODUCED BY R FUNCTION FOR 2015 ... 42 APPENDIX D. LIFE EXPECTANCY FOR A MALE AGED 65 IN THE UK ... 447
List of Figures
FIGURE I A Q-FORWARD CONTRACT ... 5
FIGURE II THE NUMBER OF DEATHS IN THE UK ... 9
FIGURE III CAUSES AND RATES OF MORTALITY FOR THE UK MALE POPULATION ... 10
FIGURE IV LIFE EXPECTANCY PREDICTIONS USING THE CMI IMPROVEMENT MODEL AT AGE 65 ... 18
FIGURE V PENSIONER BUY-IN PRICING VS GILTS ... 21
FIGURE VI IMPACT OF A LONGEVITY TRANSACTION ON FUNDING BEFORE AND AFTER A TRANSACTION ... 23
FIGURE VII BIGGEST PENSION SCHEME RISK TRANSFER DEALS ... 24
FIGURE VIII LOGARITHM OF DEATH RATES OF UK POPULATION ACCORDING TO AGE AND TIME ... 27
FIGURE IX LEE CARTER FORECAST OF UK MALE POPULATION DEATH RATES ... 28
FIGURE X PARAMETER ESTIMATES AND MORTALITY FORECASTING UNDER THE LEE CARTER MODEL ... 29
8
List of Abbreviations
Abbreviation Meaning
ARIMA Autoregressive Integrated Moving Average AVC Additional Voluntary Contribution
CBD Cairns, Blake and Dowd
CMI Continuous Mortality Investigation
CPI Consumer Price Index
DB Defined Benefit
DC Defined Contribution
LDI Liability Driven Investment
LSC Lisbon Service Centre
NHS NASDAQ PPF
National Health Service
National Association of Securities Dealers Automated Quotations Pension Protection Fund
RPI Retail Price Index
SVD Singular Value Decomposition
9
Terminology and Definitions
• Buy-in: is a similar arrangement to a buy-out; but instead of the insurer taking on responsibility for paying the members’ pensions, the insurer instead makes these payments to the scheme which, in turn, pays the members (WTW 2016b)
• Buy out: is a type of financial transaction where a pension fund pays a fixed amount to an insurer for taking the responsibility for paying the pensioners
• Liability driven investment: is an investment strategy which relates to increasing the certainty that the goals of a pension scheme are going to be met; through improving the level of funding while reducing risk
• Defined contribution: occupational pension, whereby the pension amount depends on the amounts invested in the scheme and how efficiently they have been invested, the charges applied, and the overall contribution by retirement age. The amount of pension is determined based on the annuity rate at retirement.
• Defined benefit: Nearly all public service schemes including the local government pension scheme and the NHS pension scheme are of this type. Usually the pension amount is determined based on salary percentage and length of service. For the purposes of this report as well as relevance to the work conducted at Willis Towers Watson, we will only discuss longevity risk and pension valuation of this type without any particular reference to defined contribution plans.
• Singular-value decomposition: or SVD for short is a matrix decomposition method for reducing a matrix to its constituent parts in order to make certain subsequent matrix calculations simpler (Browniee 2018).
• Longevity swap: is a derivative contract that offsets insurance companies' or pension funds' risks of their policyholders living longer than expected. Longevity swap is an insurance program for the financial institutes or funds (NASDAQ).
• Bulk Annuity: “The traditional policy offered by large UK insurers. Pension schemes pay a premium and in exchange the insurer writes an annuity that pays the retirement income of a large chunk of a scheme’s pensioners who have already retired. Trustees offload all investment, inflation and longevity risks associated with paying income to a group of retirees. Insurer gains chunk of assets and a premium.” (Davis 2009)
10
• Longevity hedging: a term used to express the risk solutions used to limit the risk of people living longer than expected. Investment such as swap contracts and bulk annuities are used.
1
1.Introduction and Motivation
People have always felt the need to have security, given that life expenses are constantly increasing the life expectancy continues to witness an increase as well, and upon retirement, the majority of people no longer have a stable income. This need for security explains why pension scheme system have been in place for decades worldwide. A stream of funding/payments are provided for members post-retirement and extend throughout the lifetime of the individual with the amounts being secured by states, employers, insurance companies or through other sources depending on each country’s specific pension scheme rules.
With the constant uncertainty and sustainability of pension schemes, the industry has identified the need to hire actuaries, as professionals to assess a pension scheme, advice on benefit plans and consult on the financial ability of the scheme to sustain the post retirement payments (pensions) to its beneficiaries. Actuaries tend to rely on their knowledge of the industry, whilst making sure they have appropriate access to scheme specific information (scheme/benefit rules, investment strategy, etc), be familiar with the regulatory system governing the scheme as well as their accreditations that are specific to pensions. Thus, it is crucial for an actuary to value the scheme from an ongoing, solvency and PPF perspective (UK specific), especially when considering UK pension funds. Based on the nature of pension schemes, the challenge lies in the assumption setting part of a valuation, whereby actuaries attempt to be conservative especially when it comes to setting different assumptions under which the whole valuation process is based upon.
This work was produced as a result of an internship at Willis Towers Watson (WTW), Lisbon Service Centre (LSC), where an extensive curricular internship was conducted for a period of five months. The internship gave me a chance to apply the knowledge gained throughout the Actuarial Master’s program in a professional real life setting at a reputable retirement consultancy.
The internship focused on UK pension plans valuations, whereby pension funds are introduced conceptually and the internal tools are taught as part of the training program. The Lisbon team has surpassed expectations when it comes to delivering exceptional work and setting high standards for productivity and efficiency. The LSC is a center of excellence established in 2008 to initially perform UK pension scheme valuations, a process that provides clients with an assessment of the financial health of their pension schemes.
2
At the commencement of the internship, the LSC provided a three-week long training program, supporting the interns and providing the necessary tools in order to guarantee success and familiarize interns with the internal software as well as expectations to perform their tasks. The LSC also provided guidance and support to fulfill the Master’s requirement to produce the Final Master’s Work report. Throughout the training period, the regulatory system was introduced as well as the benefit plan rules governing the scheme, specific to the UK. The actuarial valuation of UK pension plans is a lengthy one composed of data inputs, data checking, assumption setting and testing and finally reconciliation of assets and liabilities through a roll forward approach; altering assumptions made in the previous valuation and determining the funding level as of this current valuation, while attributing all changes and contributions/ pension increases/membership status and other factors to be discussed throughout the report as part of the assumption setting process from one valuation to another. Tools used for the purposes of this valuation are WTW specific, whereby functionalities were covered throughout the training period. Additionally, the LSC Team used Microsoft Excel templates in order to perform different types of liability calculations for Defined Benefit pension plans, data checking and queries and also performing reasonableness checks on the liability results when first receiving data from the Consulting office.
The objectives of the internship were clearly outlined by the human resources specialists, and work was conducted in conjunction with the Consulting team in the UK, allowing for great exposure both within the office as well as in offices abroad, embedding values of professionalism, teamwork and efficiency on a day to day basis.
In the next section, we will introduce UK pension schemes, and set a platform for components of risks that are eminent in our valuations, which WTW has had great initiative in covering. Namely, managing longevity risk from an investment point of view for the UK pension system. We also introduce the topics that will be described throughout the rest of the report.
1.1 Objective and Layout
Upon joining WTW team, I was intrigued by one of WTW’s most recent longevity swap deals witnessed in the UK and thought to investigate this topic further. I also had the chance to meet colleagues from the Reigate office who worked directly with the client on managing longevity risk. According to the Institute and Faculty of Actuaries, longevity risk can be defined as the risk
3
that members of some reference population might live longer on average than anticipated. Members do not necessarily understand the implications of longevity risk when planning their retirement income and without support to hedge their longevity risk, and they can then become incapable to fulfill their financial needs (Institute and Faculty of Actuaries 2015). Pension funds are prone to this risk, and need to attribute it as a prominent source of risk when conducting Defined Benefit scheme valuations. Assessment methods and models used historically to measure longevity risk, as well as investment tools, are presented throughout this report. WTW has been particularly active in covering and managing longevity risk, from an investment and strategic standpoint. Having the privilege to work within the UK valuations team, I was fortunate to access confidential documents and investigate this hot topic.
Most references were obtained through research and newsletters published by WTW, as it is a relatively new topic so external resources were limited. In Chapter 2, we present some longevity risk instruments traded in the financial market. In Chapter 3, we give a basic introduction to longevity risk and present the components of this risk. We also discuss stochastic models and their parameters and estimates, then in Chapter 4 we present longevity transactions. In Chapter 5, R modelling is used to convey how we would estimate longevity risk and model it using some functionalities embedded in the “Demography” and “Forecast” packages. In Chapter 6, we cover the economic and demographic assumptions used in a UK pension valuation as dealt with throughout the internship period. Finally, we conclude with some remarks and propose areas for future research.
2. Longevity Risk Products
In this section, longevity risk instruments available in the financial market will be introduced. Those instruments are used to manage longevity risk, directly affecting the mortality assumptions set by actuaries assessing a pension fund, and ultimately influencing the overall pension scheme liability level. Longevity risk results from increasing life expectancy trends witnessed across policyholders and pensioners. Interest rate risk, longevity risk and inflation risk all coupled together ultimately have an effect on the overall funding level. There is no doubt that leaving out longevity risk from a risk management practice will underestimate the overall risk, therefore we cannot dismiss its impact and effects. Insurers tend to use longevity reinsurance as a measure of
4
capital efficiency and security when it comes to proper risk management practice. In the case of a diversified insurer portfolio, the use of longevity reinsurance serves to control leverage, match assets and liabilities, earn risk and liquidity premium, and balance mortality and longevity. In return for a balanced mortality and longevity for an insurer, the reinsurer or a specialty annuity company reinsures longevity risk.
Longevity risk is commonly used by UK pension plans and annuity writers as a main approach to convert unknown future liability into fixed liability cash flow, through reinsurance. It is worth noting that longevity reinsurance is collateralized (backed up) to ensure full reinsurance credit. Duration of a fixed income instrument is matched to the liability as closely as possible, while swaps are used to improve the match. In this section we define the different types of longevity risk products.
2.1 Buy-ins and Buy-outs
WTW, as a pioneer in bulk annuity transactions has covered 50% of the liabilities insured over the last three years (WTW 2016b). Buy-ins and buy-outs (defined in the terminology and definitions section), have grown significantly despite the challenging economic conditions. Several schemes have accessed the buy-in market to help in managing a concentration of risk with their membership profiles, through taking out the risk related to the highest earners. The market has also evolved in a way, where gilt yields (government backed low risk instrument) have reached historic lows, making full buyout unaffordable for some schemes, while partial buyout is seen as an attractive option for sponsors and trustees of schemes looking to shrink the size of the scheme on their balance sheet (WTW 2016b). Buy-ins are known due to their affordability in terms of the cost of transferring the whole amount of risk. While in a buyout, each individual member holds his/her own policy with the insurer and legal responsibility for paying members’ pensions passes to the insurance company.
While a longevity hedge would transfer only the longevity risk, the pension buy-in and buy-out based on valuations of future obligations also transfer out other risks such the investment risk, interest risk, inflation risk and in some cases operational risk. Solvency II came into force in 2016, placing emphasis on higher capital requirements for insurers offering bulk annuities, leading to higher cost of risk transfer. Given the increase in price, due to the implementation of Solvency II
5
as well as uncertainties of Brexit, we expect pension funds to turn to longevity swaps and prepare pension funds for a buy out at some point.
The total pension scheme buy-ins and buy-out were the highest for the first half of 2017, highest recorded since year 2014 (Hymans 2017). The buy-in and buy-out market is extremely competitive, with around 8 insurers in the market prepared to make deals (Hymans 2017). New entrants into the bulk annuity market are presenting opportunities for pension schemes. We expect even further increase in entrants in the next few years, improving the pricing margin.
2.2 Q-Forwards
JP Morgan has been exceptionally active in quantifying longevity risk and establishing a benchmark for the longevity market. Not only have they developed the LifeMetrics platform, but also developed a standardized longevity instrument called “q-forwards” (Barrieu et al. 2012)5.
“The LifeMetrics platform was developed with advisers Watson Wyatt and the Pensions Institute at Cass Business School. LifeMetrics was the only fully public, traded and international longevity index” (JPMorgan 2008) at the time when it was launched in 2008.
The q-forwards expresses the death or survival probability as used in the LifeMetrics. Survivor swaps are the hedging instruments for pension funds and insurers (Barrieu et al. 2012)5. Simply,
if the mortality falls by more than expected, a pension fund hedging its longevity risk will be paid by the counterpart of the forward. The figure below outlines a q-forward transaction;
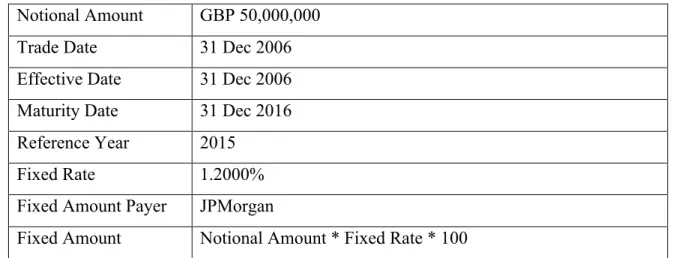
Figure I A q-forward contract
Notional Amount GBP 50,000,000
Trade Date 31 Dec 2006
Effective Date 31 Dec 2006 Maturity Date 31 Dec 2016 Reference Year 2015
Fixed Rate 1.2000%
Fixed Amount Payer JPMorgan
6
Reference Rate Life Metrics graduated initial death probability for 65 year old males in the reference year for England & Wales national population
Floating Amount Payer WYZ Pension
Floating Amount Notional Amount * Reference Rate* 100
Settlement Net settlement = Fixed amount – Floating amount
Source: Barrieu et al (2012)5
It is important to note that although longevity securities are available in the market, the pricing of these securities is not standardized as the market is still in an immature stage. Therefore, the pricing of these financial contracts cannot be based on the typical methodology of an arbitrage-free basis, instead will be based on the concept of risk replication. This involves replicating the portfolio in such a way where the price of the claim is driven by the cost of replicating portfolio hedging away the market risk, measured under a unique risk-neutral probability measure. The probability measure will make a link between historical data and the market trends. Once the subsets of the probability measures are specified, we can then find the optimal price through maximum likelihood methodology. Many other instruments are available in the market, and yet there is still innovation in the financial market, and the pension and retirement industry.
3. Importance of Understanding Longevity Risk
The UK pension market is one with distinct regulatory baseline, requiring deep understanding and undergoing several seasonal changes. This trillion-pound industry, that is constantly evolving, has been facing challenges preceding the latest financial crisis. The latest shift in the considerations of the UK pension industry has presented portfolio managers with an opportunity, assigning them with the task of providing investment strategies to final salary retirement schemes. In an attempt to hedge the risk of failure of pension schemes to meet their future obligations, UK defined benefit (DB) pension schemes (see detailed definition below) have relied on liability driven investment strategies (LDIs), which involves increasing the certainty that the goals of a pension scheme are going to be met; that is through improving the level of funding while reducing risk. An example
7
of LDI, is a portfolio of high quality bonds with durations matching those of the plan liabilities, hedging, and transacting through swaps etc. In a DB scheme, the employer bears the risk, and makes a share of contributions which covers the benefits. LDIs protect the DB pension schemes against unforeseen fluctuations in interest rates, inflation rates and life expectancy (De Vree 2015). As demand has increased on LDIs, financial analysts are speculating that this bubble will eventually burst and that the market will reach a saturation point in the next few years. It is thus worth noting that the UK operates a voluntary occupational pension system. A voluntary occupational pension plan is one that is being paid above and beyond what is being earned as a basic state pension.
As mentioned earlier, since we are only interested in analyzing valuations of DB pensions, it is crucial to monitor the market trends and external factors influencing the liability side of the balance sheet. Increasingly DB pension schemes have been on a de-risking journey, leading to buy-ins or self-sufficiency. Self-sufficiency reflects the required level of assets to meet all future benefit payments to a very high probability without the need for additional contributions. It is no news for anyone and especially actuaries that over the last decade the average person’s life expectancy has grown. The impact longevity risk has had on DB pensions has compelled actuaries to come up with mortality improvement tables, as well as consider new investment strategies. Each additional year of life expectancy for the scheme membership winds up adding 3% to the liabilities. An overall 10% increase to pension scheme liabilities has been recorded in the last decade alone (WTW 2016a). Given that pension schemes need to account for longevity risk, it is no surprise that trustees and sponsors need to consider how to control and manage this risk. According to the Institute and Faculty of Actuaries longevity risk can be defined as ‘the risk that members of some reference population might live longer on average than anticipated’.
Willis Towers Watson has been recognized as a pioneer at integrating longevity risk into their risk assessment and management plans, when it comes to scheme analyses. They have advised on several longevity swaps transacted in the UK, and using their postcode mortality tool, they have distinguished themselves from other consultancies in the field that do not advise on the full range of scheme valuations and risk management.
8
3.1 Components of Longevity Risk
Now that we have acknowledged the importance of managing longevity risk and hedging the overall risk, we can look into the components of longevity risk (WTW 2015);
1) Trend risk: is defined as the risk that even with all the information available to us at any point in time, we just get it wrong as the human body seems to have a shelf life that we have we have not been able to extend.
2) Idiosyncratic risk: this is the risk that even if we know the current mortality rates and future ones with certainty, there are still individuals that live longer than we would expect. Averaging out can reduce this risk, however even then, for highly paid pensioners for example, idiosyncratic risk is still high.
3) Basis risk: this is the risk where the characteristics of a scheme membership are matched with a much larger experience set. Assumptions made are more credible when using this approach as they are mirroring an existing membership group.
Several models and tools have been built to illustrate longevity risk and assess it, using past experience and a forward looking approach using disease-based mortality (Edwards & Fenton 2017). Stochastic modelling is often used by actuaries to quantify longevity risk and properly manage it. Transactions that we are familiar with, that have been widely used, are longevity swaps. When thinking of a longevity swap as a whole transaction, it is important to realize that the scheme retains some control over most of its assets and therefore, this is seen as a better approach than a bulk annuity contract (insurance policy) which would require assets to be available. A longevity swap is a derivative contract that offsets insurance companies' or pension funds' risks of their policyholders living longer than expected. Longevity swap is an insurance program for the financial institutes or funds (NASDAQ).
On the demand side, pensions reach a point in their cycle where longevity risk is quite significant compared to other risks. On the supply side, reinsurers have a considerably higher amount of mortality risk than they would need so they look to take on longevity risk in order to diversify and reduce their overall solvency capital requirements. As an estimate, longevity demand might average £50-100bn of liabilities a year, which based on supply estimate would cause an upward pressure on prices over the medium to long term (WTW 2016a). Over the medium to long term, there are 2 trillion in UK DB pension liabilities, yet this position is prone to change (WTW 2016a).
9
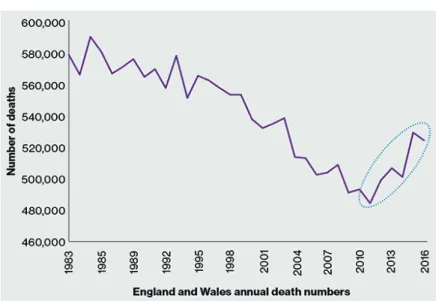
Within the scope of UK pension valuations, and as part of the practice of retirement actuaries, economic and non-economic assumptions are set beforehand. It is therefore crucial to set assumptions that are stable and prudent enough, consistent with the regulations set and the scheme nature. Traditionally, life expectancy and mortality trends have been derived through a large population census and then adjustments are made for scheme’s own experience, whereby an individual’s life expectancy is dependent on the socio economic factors. Only large companies could have a material difference in their mortality assumptions. The postcode mortality tool used by WTW has its limitations, but similar to other tools, it follows a robust statistical technique drawing conclusions about the factors directly influencing health as well as well-being, and ultimately mortality. Socio economic factors such as health plans of residents are directly correlated with mortality, however there are some limitations such following a less scientific approach in order to set a scheme assumption for the future rate of change on the mortality levels (Edwards and Fenton 2017). Although arguably a common and reliable approach, extrapolating past trends such as number of deaths is uncertain and no longer reliable (Caine 2017).
Figure II The number of deaths in the UK
Source: Caine (2017)
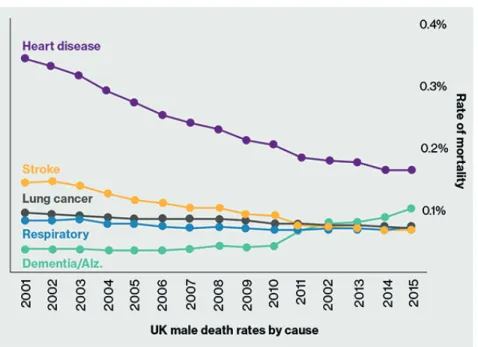
Not only is life expectancy higher, but causes of death are now changing due to improved health benefits and health awareness. Less and less of members are dying from heart disease or strokes, but instead dementia and Alzheimer are found to be the latest death causes (Edwards and Fenton
10
2017). It is therefore crucial to acknowledge changes in markets and trends affecting longevity and mortality, presenting opportunities for insurers to design unique products, and differentiate underwriting and pricing (Edwards and Fenton 2017).
Figure III Causes and rates of mortality for the UK male population
Source: Caine (2017)
3.2 Stochastic Models
In this section we will present stochastic models that have been developed by actuaries in an effort to forecast mortality rates. Traditionally, a parametric curve is fitted to annual mortality rates. Among the famous researchers that we have been exposed to through our Masters coursework are Gompertz, Makeham and Weibull (Keijzer 2014).
Recent developments and changes in demographics and market trends have led to establishment of long run forecasting models such as the so-called “Lee-Carter” model and the “Cairns, Blake, Dowd” model. The aim of these models is to project mortality rates which are then used to quantify and assess longevity risk based on past experience (Keijzer 2014). Once the size of longevity risk is known and estimated, it can then be incorporated into the overall risk-return framework in order to ultimately assess investment options for the pension scheme to consider. The Lee-Carter model
11
has been widely used for long run forecasting of age specific mortality rates in many countries throughout different time periods.
In this section we will focus on long run studies of mortality that are most relevant to the UK, and give an overview of the methodology being used for the Lee Carter model, as well as the Cairns, Blake and Dowd (CBD) model. The Lee Carter model can be used for the extrapolation of trends and age patterns of mortality (Wang 2007). Ideally, the Singular Value Decomposition (SVD) approach is used for estimation of the parameters of the Lee Carter model. We can define the Lee Carter model using a bilinear model with variables x, representing age and t, representing time in years. Forecasted values for the time dependent Lee Carter model can be obtained using the time series model ARIMA. On the other hand, CBD uses a two time-varying parameters, jointly expressed as mortality indexes. These indexes indicate the extent of longevity risk, which relate to the risk associated with under or over estimating mortality improvements. In other words, the variation between expected and actual values of a mortality index (Wai-Sum Chan et. al. 2014)3. It is important to note that we can use mortality indexes, in order to construct standardized mortality-linked securities such as longevity bonds or swaps, used to hedge longevity risk exposure for trustees of pension funds. The CBD model has been widely used as a baseline for many applicable tools used by banks and consulting firms. The CBD model is covered in section 2.4 in further detail.
3.2.1 Lee-Carter Model
Lee and Carter model was introduced in 1992 as one of the first stochastic mortality models for modeling human mortality (Ronald 2000). “The model generates one-parameter families of age schedules for fertility and mortality, in the sense that variations in one parameter generate the entire range of schedules in the family. However, to express a single schedule requires a number of age-specific coefficients equal to twice the number of age groups. Different values of these coefficients define different families” (Ronald 2000). It is given by a bivariate ARIMA equation;
ln ( 𝜇&,() = 𝛼 x+ 𝛽&kt + 𝜀x,t (1)
x denotes age group under consideration
t denotes period of life table under consideration 𝜇 x,t is the force of mortality for age group x at time t
12
𝛼x denotes the coefficient that describes age specific pattern of mortality for each specific age and
is independent of time
kt is the time trend for the general mortality, while 𝛽x is the coefficient that accounts for the
sensitivity of the log equation at age grouping x and t , representing how fast mortality varies when the general level of mortality changes or the pace of mortality improvement for each age
𝜀x,t denotes the error associated with age-grouping x and time period t, which is the random portion
of the model where 𝜀x,t ~ N (0, 1)) i.i.d (Keijzer 2014)
As covered through our coursework, when a model has too many parameters to be estimated, we end up with too many degrees of freedom. Equations (2) and (3) shown below are equivalent equations that show the multiplicity of solutions, hence implying the need to set constraints;
𝛼& + 𝛽&𝑘( = 𝛼&+ (𝐵1𝑐)45
6 (2)
𝛼&+ 𝛽&𝑘( = 𝛼& − 𝛽&𝑐 + 𝛽&(𝑘(+ 𝑐) (3)
The unique solution for the Lee Carter model includes the following constraints; Σ& 𝛽& =1 and Σ( 𝑘( =0 (4) (Keijzer 2014)
In order to obtain a solution for equation (1) we need to impose these two constraints. Under these conditions, 𝛼x will wind up being the average values over time of the ln ( 𝜇&,() values for each x.
Parameter estimation from observed values can be done using single value decomposition method, resulting in a minimum squares solution which is a regression model (Keijzer 2014).
One of the main properties of the Lee Carter model is that, once fitted, only the mortality index (kt) over time needs to be forecasted for future time points. Lee and Carter fitted autoregressive
integrated moving average for modelling mortality index kt first for the US population and then
the suggestion was made to use of the appropriate ARIMA models for different populations as well. Of great importance is the fact that with a certain level of the time index k, we can define a complete set of death probabilities that allow us to calculate all of the life table. We then estimate the parameters for any year of interest. An important property is that the Lee Carter model allows for uncertainty as it allows for forecasting, providing the forecaster with point estimates for future mortality rates.
The Lee Carter model can be estimated using a time series model following the ARIMA methodology. The time dependent parameter kt can be modelled as a stochastic process, that uses
13
index kt (Haberman and Russolillo 2005) In order to construct an appropriate ARIMA model, we
first need to analyze the trend line or the time series. The inputs for the ARIMA need to be stationary with constant mean, variance and correlation throughout time. As covered during our coursework, in order to make a time series stationary, we would need to take the first derivative. To find the level necessary for differentiation, the data and the autocorrelogram need to be examined, through an autocorrelation function.
Ultimately, in order to obtain a unique solution for the system of equations of the model, using equation 1, ∝ will be set to the averages over time of the logarithm of 𝜇x,t, the square values of 𝛽x
sum to 1, and kt sum to zero, mathematically we can express the following in this form;
∝x = : ; (ln 𝜇x,t , &𝛽x 2= 1 , (𝑘 t = 1 (5)
3.2.2 Lee Carter Extension- Poisson Lee Carter
Fitting the right model to a trend line is extremely crucial before coming up with estimates for parameters. Among the many models used for mortality analysis is the Poisson Lee Carter model, an extension to the Lee Carter model (1992), based on a demographic model and time series. The innovation of this model were first introduced in (Brouhns et. al. (2002)), where we consider the following as a first step to deriving estimates for our defined parameters (Keijzer 2014).:
𝐷&,( ~ 𝑃𝑜𝑖𝑠𝑠𝑜𝑛 (𝐸&,(𝜇&,( ) with 𝜇&,(= exp(𝛼& + 𝛽&𝑘() (6)
𝐸&,( is the exposure to risk.
As covered during our coursework, the Poisson distribution is appropriate when presented with a counting process, so the assumption to use a Poisson seems plausible. In this model, the number of deaths over a period of time is modelled, and then parameters are estimated (𝛼&, 𝛽& 𝑎𝑛𝑑 𝑘() using maximum likelihood methods, the log-likelihood function is derived (the parameters are denoted as 𝜙);
L(𝜙; 𝐷, 𝐸) = &,((𝐷&,( ln (𝐸&,(𝜇&,( ))- 𝐸&,( 𝜇&,( (∅)- ln(𝐷&,(!) (7)
After the log-likelihood function is maximized with respect to ∅, giving an estimate for 𝛼x, 𝛽x , 𝑘t . Brouhns applies an iterative methodology based on an algorithm by Newton-Ralphson, where the
14
estimation of parameters, the ARIMA model is determined for 𝑘t using the Box-Jenkins
methodology, to make a projection to forecast mortality rates. Using a random walk with drift 𝑘t,
is modelled, because the model gave the time series the best fit (Keijzer 2014).: 𝑘t = 𝑘t-1 + 𝜃 + 𝜀t with 𝜀t ~ N (0,𝜎K) (8)
One clear advantage of this model is that it is easy to produce a forecast of the future mortality rates, yet it is a simplistic model, which can be seen as a disadvantage. The Lee Carter family models have an extrapolating nature, whereby, the future will simply replicate the past and that all tendencies factored in the past will remain the same in the future. When it comes to using this model, fitting the data and extrapolating past trends are kept separate. All improvements related to mortality trends, such as medical advances and changes in the population lifestyle are ignored by the Lee Carter model. Hence, the limitations of this model are numerous and further investigation needs to be conducted to account for medical advances and recent trends relevant to human mortality. Extensions for the Lee Carter model have been developed, actuaries have considered a dynamic Bayesian approach for forecasting by age and sex (Wiśniowski et al. 2015)5. The approach embeds the Lee-Carter type models for forecasting the age patterns, with associated measures of fertility, mortality, immigration and emigration within a cohort projection model to account for correlation between sexes and smoothing (Wiśniowski et al. 2015)5.
3.2.3 Cairns, Blake, Dowd Model
Another model that has played a significant role in forecasting mortality that we chose to consider in our analysis is the so-called Cairns, Blake, Dowd (CBD) model. This two trend parameter model, which is more recent in its formulation, is reliable when used for forecasting mortality at higher ages, for instance from ages starting at 60 and above. One important feature of this mortality model is that it is a logit transformation belonging to the parametric family of mortality models. The CBD models is further outlined in Cairns et al. and is given by the following model (Keijzer, 2014):
𝑞&,( = MNO(45PQ45R&) :QMNO (45PQ4
5
15
Unlike the Lee Carter model, the CBD model estimates the mortality rate using 𝑞&,( mortality rate
instead of the force of mortality (underlying death rate 𝜇&,() . 𝑘(S is a stochastic process and has
an equal effect on mortality at all ages, while the parameter 𝑘(: is one with impact at the older ages.
The time index 𝑘(S is defined as the intercept of the model, it is linear, so if declining over time,
the mortality rate is decreasing over time. Whereas 𝑘(: represents the slope of the model, so if
mortality improvement is higher at lower ages then the slope would be increasing over time in return. Research and findings by actuaries and insurance specialists have presented us with empirical evidence indicating that both factors, of stochastic nature, are needed to achieve the best fit over the mortality term structure. The distinction between the Lee Carter model and the CBD is the flexibility over time when using the CBD model, whereas for the Lee Carter model the coefficient 𝛽x = x over time. The CBD model does not particularly depict the mortality rates for
the lower ages by a straight line. Unlike the Lee-Carter model, this model is fully identified and does not require any constraints in order to find a unique solution. The model dynamically models longevity risk, as well as other indices that are mortality related such as certain securities and other longevity products and investment tools. It is worth noting that this model we have identified is one that has been used widely to fit to UK mortality data, and price mortality linked financial instruments such a BNP longevity bond for instance (Cairns, Blake, and Dowd 2006).
3.3 Willis Towers Watson Model
After presenting some mortality models that have been used by actuaries to assess the mortality assumption setting stage, and analyze the scheme risk that the client is exposed to, it is worth investigating the model being used by WTW. The uniqueness of the model underlying the risk tool used by WTW has substantially improved their competitiveness among competitors. Having worked at WTW, and through communications with consultants directly managing longevity risk, it was revealed that a Stochastic Mortality Risk Model is the underlying tool that is used to deliver risk solutions. The sophisticated stochastic modelling approach, which incorporates thousands of solutions is closest to the CBD model. A modified version of the CBD model was developed, making sure this model reflects longevity improvement experience at higher ages. CBD model as is Lee Carter, is a reliable, peer reviewed model that has been widely used for the purposes of understanding and quantifying longevity risk throughout different countries. As trustees and
16
corporate sponsors are concerned in exploring the size and source of longevity risk that the pension scheme is exposed to, WTW’s longevity tool allows them to answer questions related to the size of longevity risk, whether the assumptions used are prudent enough or not, and what price can we place to hedge this risk component.
The tool enables clients to make the right decision, as it is complex enough in its calibration and technicality, yet reveals clear results when it comes to carrying out a funding valuation or planning a long term de-risking journey or assessing the value of longevity hedging options available, such as bulk annuities and swaps. The longevity risk tool enables mortality risks to be assessed by type (i.e. basis risk, trend risk and idiosyncratic risk), and at a granular level, therefore, appropriately assessing risk mitigation options for segments of the population using a live consulting tool. Armed with this tool, trustees and sponsors of the scheme have greater confidence in the payment of future cash flows and understanding the longevity risk facing the pension scheme at including all splits and segments. This allows consultants to offer their expertise to provide consulting services such as journey planning and investment strategic plans, utilizing such innovations and new capabilities. The internal modelling technique that WTW uses runs mortality simulations and model life spans at an individual member level. The simulations account for past trends when it comes to life expectancy and projections, but also allow for possible spread of mortality rates in the future that is a result of developments in disease treatment and prevention. Through simulating under different mortality scenarios, the trustees and sponsors are able to see the range of different financial outcomes. Not only does the model quantify longevity risk for the scheme by risk sub-groups, but also by liability, and headcount as well. Trustees and sponsors are able to detect the risks facing membership groups, and key variables to be changed in real-time. As well as enabling them to better understand and explore longevity risk in a live environment, helping them in formulating an opinion when it comes to management risk assessment and investigating longevity hedging triggers. The tool allows clients to explore in detai the key variables that can be changed in a live environment and the effect these scenarios have on the final risk. The CBD model was used as an extrapolative model due to its smoothness across ages in some year. The process and developed tools involve a robust process, while applying simple age effects using the two correlated factors as building blocks of the model (Cairns et al. 2006). It is also easy to incorporate parameter uncertainty, however care must be taken when it comes to the fitting of the model, as the Lee Carter model could be of better fit.
17
The main purpose of using scenario testing as part of the stochastic modelling is to identify scenarios which result in a significant deterioration or improvement of the scheme’s funding position. The choice of relying on a CBD model is driven by scholars’ contribution, and modification done to the more simplistic Lee Carter model. Scholars choose to model mortality through the use of a discrete time model, as is the case for a Lee Carter model. The application of this model in real life situations to assess population has been widely used in the UK and Wales, as well as other countries. The truth is, although the model is quite simplistic in nature, it embeds two stochastic models rather than one, adding to its uniqueness and ability to highlight longevity risk ensuring the best fit. WTW also uses predictive models for mortality projection, using generalized linear models as the main platform of their internal software. The predictive modelling software allows for changes in the data profile over a certain period of time. In Chapter 5 of this paper, we use the R program in order to convey an example of how we can assess the longevity risk attributed to a pension scheme using the Lee model and assess the results, as well as the dependency of these calculations when it comes to providing a liability valuation. Data that studies have relied on comes from the Human Mortality Database, revealing increased life expectancy throughout time.
3.4 Continuous Mortality Improvement Models
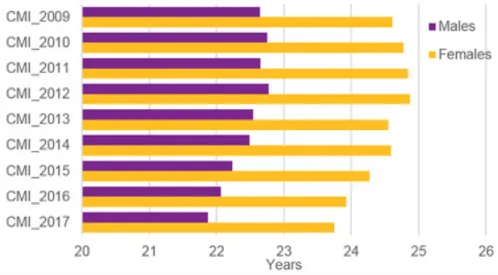
As reflected during my valuation work at WTW, mortality projections are conducted annually by actuaries, and longevity improvements are released using improvement tables, which take into consideration the latest population data and life expectancy for both males and females. A briefing issued by WTW reveals the truth about the little improvement in the mortality of the UK population in 2017. Specifically, the latest Continuous Mortality Investigation (CMI) longevity model shows that male life expectancy has been dropping for a fifth consecutive year (Cook 2018). Death numbers in the UK have substantially increased and we must consider the implications this effect has on pension schemes. According to the Office of National Statistics, death numbers in 2017 were exceptional high, even exceeding the 5-year average.
Drawing conclusions about longevity improvements solely through death numbers is unreliable. Therefore, actuaries tend to rely on mortality rates relative to previous years and past trends. Results show that no improvement has occurred since 2011. Pension schemes use the CMI model
18
to forecast mortality improvements. The CMI is set up such that it combines an extrapolation of recently observed mortality rates with a chosen long term rate of improvement. The recent trend of mortality rates in the UK led to a five-year average of mortality improvement near zero, implying a decrease in CMI_2017 and CMI_2016 model, resulting in a life expectancy that is lower than what was previously expected, in the coming years. The figure below reveals these life expectancy forecasts using the CMI model assuming a long-term rate of improvement of 1.25% annually (Cook 2018);
Figure IV Life expectancy predictions using the CMI improvement model at age 65
Source: Cook (2018)
As mentioned earlier, changes in life expectancy ultimately have an effect on the assessed value of liabilities. For the year 2017, the liability value of a pension scheme witnessed a drop where the improvements model used for valuation purposes switched from the CMI_2016 to the CMI_2017 model, ceteris paribus. Typically, valuations are conducted every three years, unless a longevity or strategy consulting service is delivered to the client using risk assessment tools that are internally developed. A drop in liability value indicates an extension in the funding or journey plan. The recent mortality data may lead trustees and sponsors to change CMI_2017 model, considering extra elements and parameters can be added depending on likely developments and anticipated changes to the specific scheme. For instance, a smoothing parameter can be used to adjust the responsiveness of the model to observed data, and a long term parameter can also be used in case assumptions are revisited for long term future improvements and trends (Cook 2018).
19
Even insurance companies are now adhering to the latest CMI models, hence resulting in lower prices for longevity products such as buy-ins/buyout and longevity hedges. If this trend persists, it is likely that further drops in life expectancy and pension scheme liabilities will be recorded. When assessing longevity risk, we are fearful that longevity improvements on an annuity will wind up exceeding the assumed annuity value, therefore we need to a consider basis risk through setting assumptions appropriately (Edwards 2013). Therefore, an important component to longevity risk that needs to be accounted for is the basis risk. The basis risk can be defined as the mismatch in the economic capital calculations. A best estimate assumption is then required for accurate capital computations.
A WTW risk calibration survey has been conducted to examine the individual Capital Assessment bases and methods applied by life insurers, as well as their approach to longevity basis risk in particular (Edwards 2013). Throughout their extensive market research practice, it has been concluded that longevity basis risk is moving onto the radar of life insurers. “Basis risk may arise when the reference population used for the analysis of historical improvements differs from the insurer’s portfolio” (Edwards 2013). Basis risk is when insurance companies and pension schemes consider managing their longevity risk through the use of a hedging instrument based upon published mortality indices, where this risk leads to different rates of mortality driven by differences in the composition of the portfolio and the index population. Most recently, there has been greater emphasis to adopt risk-based capital measures, while placing emphasis on sources of risk, while still realizing the existence of basis risk in some of the fundamental assumptions. WTW has had great contributions to this field of study, through their specialists and unique longevity risk tools.
4. Longevity Transactions
It has now become clear that longevity risk is an important component when managing pension schemes, they are now accounting for it when conducting valuations and are fully understanding the implications of not capturing that risk. According to a news briefing published by WTW (Aley and Beard 2018a), many pricing deals in the bulk annuity and longevity hedging market have transacted recently, namely:
20
▪ June 2018: £1.3bn buy-in for the Siemens Benefits Scheme ▪ June 2018: £850m buyout for the PA Pension Scheme ▪ June 2018: £325m buy-in for the BAA Pension Scheme ▪ May 2018: £880m buy-in for the Littlewoods Pension Scheme
▪ May 2018: £2bn longevity swap for the Electricity Supply Pension Scheme ▪ May 2018: £1.4bn buy-in for the Marks and Spencer Pension Scheme ▪ March 2018: £2m buy-in for a confidential Willis Towers Watson client ▪ March 2018: £9m buy-in for a confidential Willis Towers Watson client ▪ February 2018: £45m buy-in for a confidential Willis Towers Watson client
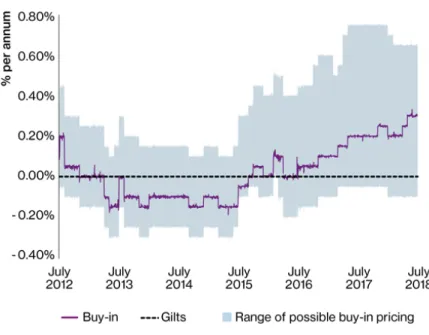
The bulk annuity market continues to be a busy one, through which WTW has fetched that opportunity to manage these transactions. When assessing the yield achievable on pensioner-only bulk annuities, relative to a portfolio of gilts in recent years, one can realize a scheme is able to swap a portfolio of gilts covering a set of pensioner liabilities matching annuities without incurring extra costs to the scheme itself or the sponsor (Aley and Beard 2018a). It has been established recently that bulk annuity prices, when compared to gilts, are as attractive in recent past, but are able to dissect the risk at any price below that of gilts. The figure below shows clearly the yield achievable on pensioner-only bulk annuities compared to a portfolio of gilts (Aley and Beard 2018a).
21
Figure V Pensioner buy-in pricing vs gilts
Source: Aley & Beard (2018)
WTW has been particularly active in longevity risk transactions, acting as main advisers in the biggest deals witnessed in the UK. One of which was transacted in 2015, whereby the pension scheme was able to take actions to hedge against the interest rate and inflationary pressures, and through asset de-risking there was a reduction in equity and credit exposure combined.
When thinking of a longevity transaction, one can define the transaction as a contract with a third party which exchanges payments based on expected longevity with payments based on actual longevity. In the case of bulk annuity transactions, a single premium is paid upfront, however, for a longevity swap, payments are exchanged throughout the term of the agreement or at the end. In a longevity swap, the risk is passed to a reinsurer, through an insurance license holder. While when entering a bulk annuity transaction, the insurer can either pass the longevity risk of the scheme directly to the reinsurance market or not pass it at all, passing it means getting rid of the risk components related to pensioners living longer than expected (Aley and Beard 2017a). Bulk buying transactions take out the investment risk, inflation, as well as demographic risks (Aley and Beard 2017a). Similarly, a longevity swap is able to remove some of the longevity risk while at the same time allowing the scheme to seek investment outperformance on their assets portfolio. Even smaller schemes are now considering longevity swaps as a feasible option to hedge longevity
22
risk and de-risk due to low cost and the attractiveness in terms of pricing and the simplicity of the contracts involved.
One of the biggest longevity transaction recorded in the UK was administered by WTW, whereby the transaction involved payment by the captive insurer to the pension scheme in the form of floating benefits, which are fixed proportion of the actual pension payments payable to a defined set of pensioners (WTW 2015). Ultimately, the pension scheme pays to the captive insurer insurance premiums which are fixed, forming a fixed proportion of the pension payments that are expected to be made to that defined set of pensioners on the longevity experience expected by the reinsurer to occur (WTW 2015). In addition to the fixed proportion of payments are extra fees which are paid to cover administrative costs. The net payment at any time is expected to be the fee element of the insurance premium however this is only true if the actual experience matches the expectations held at the time the contract was entered (WTW 2015). In the cases where longevity increases by more than that expected in the derivation of the schedule of insurance premiums, then the floating payments will be well above the fixed payments made by the scheme to the insurer and the scheme will receive a net payment from the insurer that will cover the additional longevity risk. Note that the opposite is also true – it may happen that the longevity does not increase as much as initially expected and, in that case, the scheme would need to make a net payment (on top of the fees) to the insurer.
Finally, as a way to mitigate the possibility that one of the parties fails to meet its obligation to pay the necessary benefits (i.e. to mitigate credit risk), a collateral is also exchanged between the parties (WTW 2015).
From an operational standpoint, the transaction involves multiple stages, starting with the scheme administrator providing data updates, population movement or membership movement, and results of data checks. Once data is verified, the captive updates the benefits for all members and actuaries then calculate the fixed, floating and net payments, as well as account for adjustments made with respect to prior increases (WTW 2015). Payments flow from the pension scheme to the captive insurer and ultimately to the reinsurer. The captive then forecasts fixed and floating cash flows for the scheme and discount them to come up with a net position. Not only are cash flows calculated, but additionally, the collateral assets are estimated.
As for the collateral, collateral fees will be paid over time, so the aggregate amount held as fee collateral will reduce (WTW 2015). Over time, the contract value may change given mortality
23
experience in the pension scheme, expected future life expectancies and changes in market yields. This change is described as experience collateral.
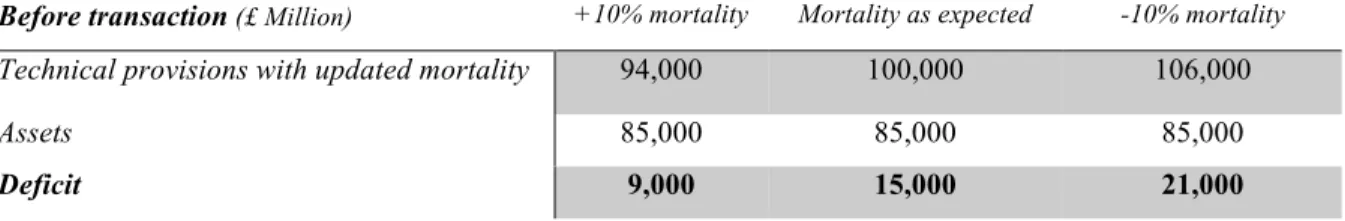
It is crucial to study the impact of a longevity transaction on the assets and liabilities side of the balance sheet. The scheme legislation requires that the asset value used for valuation purposes to be the same one as reported and disclosed in the audited scheme accounts. Once the transaction is processed, reinsurance fees and fixed leg payments are used towards pension payments. The final value is expressed as a fair value of the expected future floating leg payments (best estimate of mortality) less fixed leg payments (WTW 2015). The table shown below summarizes the operational transaction of longevity through detecting the impact on the captive and on the scheme of the longevity transaction;
Figure VI Impact of a longevity transaction on funding before and after a transaction
Before transaction (£ Million) +10% mortality Mortality as expected -10% mortality Technical provisions with updated mortality 94,000 100,000 106,000
Assets 85,000 85,000 85,000
Deficit 9,000 15,000 21,000
After transaction (£ Million)
TPs with updated mortality 94,000 100,000 106,000
Adjustment for “fair value” of policy (320) 0 320
Technical provisions 93,680 100,000 106,320
Assets before transaction 85,000 85,000 85,000
“Fair value” of policy (3,335) 0 3,335
Assets 81,665 85,000 88,335
Deficit 12,015 15,000 17,985
Source: WTW ( 2015)
*Note that the values used are illustrations of an actual transaction, meaning that to conserve the privacy of the client, we used illustrative figures instead of actual values.
24
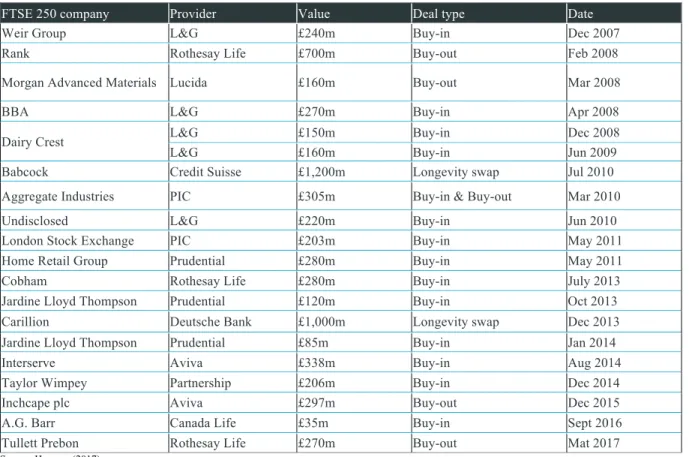
For reference, we present below a summary of the biggest pension scheme risk transfer deals witnessed in the past 10 years recorded in Figure 7 below (Hymans 2017);
Figure VII Biggest Pension Scheme Risk Transfer Deals
FTSE 250 company Provider Value Deal type Date
Weir Group L&G £240m Buy-in Dec 2007
Rank Rothesay Life £700m Buy-out Feb 2008
Morgan Advanced Materials Lucida £160m Buy-out Mar 2008
BBA L&G £270m Buy-in Apr 2008
Dairy Crest L&G L&G £150m £160m Buy-in Buy-in Dec 2008 Jun 2009
Babcock Credit Suisse £1,200m Longevity swap Jul 2010
Aggregate Industries PIC £305m Buy-in & Buy-out Mar 2010
Undisclosed L&G £220m Buy-in Jun 2010
London Stock Exchange PIC £203m Buy-in May 2011
Home Retail Group Prudential £280m Buy-in May 2011
Cobham Rothesay Life £280m Buy-in July 2013
Jardine Lloyd Thompson Prudential £120m Buy-in Oct 2013
Carillion Deutsche Bank £1,000m Longevity swap Dec 2013
Jardine Lloyd Thompson Prudential £85m Buy-in Jan 2014
Interserve Aviva £338m Buy-in Aug 2014
Taylor Wimpey Partnership £206m Buy-in Dec 2014
Inchcape plc Aviva £297m Buy-out Dec 2015
A.G. Barr Canada Life £35m Buy-in Sept 2016
Tullett Prebon Rothesay Life £270m Buy-out Mat 2017
Source: Hymans (2017)
4.1 Recent Innovations in Longevity
Recent developments have occurred in the UK relevant to managing longevity risk, for instance, there is room for smaller pension schemes and reinsurance to conduct smaller bulk annuity transactions. There is access to the same pricing as larger schemes, and potentially a regular flow of longevity business. However, there are operational costs attributed to such transactions, and due to limited experience when it comes to smaller pension schemes, pricing quotes may be inconsistent.
In terms of assumptions for a small scale pension scheme, the base mortality tables will be derived from socio-economic tables derived from credible data sets. Whereas, mortality improvements will be reliant on an individual reinsurer approach or CMI model, which is quite different from what was assumed 10 years ago. A key challenge for longevity swap transactions and de-risking
25
transactions for small scale schemes, is the documentation and legal processes. Another challenge is how prone the transaction is to data errors and future transaction uncertainty, for example, benefit amounts, gender, and data of birth. These errors can be minimized through conduction of data checks prior to valuation data and upon receipt of client data. Within the retirement team in the LSC of WTW, we were heavily involved in data checking and data treatment activities and conducting regular checks, reducing margins of errors at the early stages of a valuation, using the appropriate pension increases, inflation factors, mechanistically adjusting demographic errors and assumptions and attributing fair judgement based on actuarial regulations and UK pension scheme standardized rules, and making adjustments accordingly.
Deferred pensioners are now being included in transactions as part of a de-risking approach. These members make up almost half of total scheme membership, and sponsors do not wish to wait until all of the deferred members retire until they are able to engage in de-risking activities. Therefore, insurers are simply transacting in buy-ins and buy-outs where deferred lives are included. The market has also been able to cover deferred members as part of the overall transactions; therefore, following Solvency II, we anticipate competitive pricing for pensioners, and a slight price increase for deferred pensioners (WTW 2016b). According to a WTW publication, a buy-in is defined as a bulk annuity policy that is owned by the trustees and which remains a scheme asset, where the insurance company pays pension payments to the trustees (Aley and Beard 2017b). The trustees still have legal responsibility for paying member benefits. The only complication of counting deferred members is that insurers would need reinsurance support due to high relative capital. When structuring deferred members, we need to reassess the age profile of members, collateral, transfers out, retirement data and tax-free cash. Clearly, there are concerns and challenges to overcome when it comes to deferred pensioner de-risking (Murphy 2017).
When speaking of pension schemes, it is important to acknowledge the regulatory system governing financial instruments and transactions, among which are longevity risk financial instruments. In the long term, insurers are finding it challenging to keep longevity risk on their books and are reinsuring this risk through reducing capacity for longevity hedging.
As defined in the very first section of this report, basis risk, a component of longevity risk, can hinder the successful operation of a longevity market if not managed appropriately. Age and gender are defined as the main sources of basis risk, as well as regional and socio-economic basis risk (Barrieu 2012). The use of standardized instruments based upon a longevity index have limited
26
exposure to such risk. Essentially, initiatives have been proactive in recent years in increasing transparency and liquidity through standardization and developing longevity-risk transfer mechanisms. The longevity indices being created have to be based on national data, that is reliable enough and credible, reducing basis risk for the longevity risk bearer. National statistics agencies worldwide have been able to build up annual indices based on national data, which accounts for projected mortality rates or life expectancies.
Examples of existing indices are (Barrieu 2012):
• Credit Suisse Longevity Index, launched in December 2005, is based upon national statistics for the US population, incorporating some gender and age specific sub-indices. • JP Morgan Index with LifeMetrics, launched in March 2007. This index covers the US,
England, Wales and the Netherlands, by national population data. The methodology and future longevity modelling are fully disclosed and open, (based upon a software platform that includes the various stochastic mortality models).
• Xpect Data, launched in March 2008 by Deutsche Borse. This index initially delivered monthly data on life expectancy in Germany, but has now been extended to include the Netherlands.
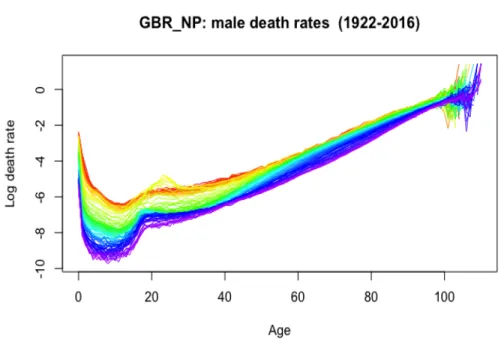
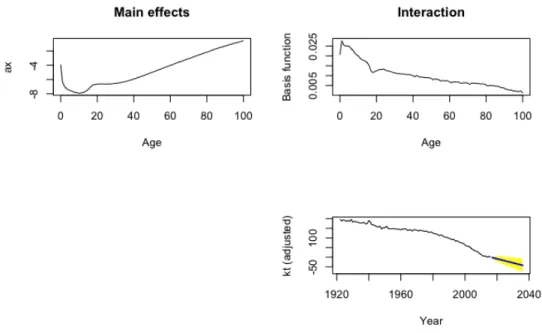
5. Mortality forecasting practical example using R
This section is an application of the mortality projection technique, specifically the Lee Carter model, which was covered extensively in theory in Chapter 2. The R program can be used to perform life expectancy projections, using Demography and Forecast packages. Data for the UK population is extracted from the Human Mortality Database, which is the main database used to capture population related information. The mortality model used in the chapter is shown in log scale (such as mortality rates); the intention is to stabilize the high variance associated with high age-specific rates (Booth 2015). The purpose of this chapter is to reveal the estimates parameters of the Lee Carter model, and recognize the impact each component to the longevity risk in annuity products for example, through measuring life expectancy. As part of this package, we are able to estimate the parameters of the Lee Carter model, then a mortality projection is shown. The sections below cover the approach in further detail;