F
ACULDADE DEE
NGENHARIA DAU
NIVERSIDADE DOP
ORTOAutomatic Switching Between Video
and Audio According to User’s Context
Paulo Jorge Silva Ferreira
Mestrado Integrado em Engenharia Informática e Computação Supervisor: João Manuel Paiva Cardoso
Automatic Switching Between Video and Audio
According to User’s Context
Paulo Jorge Silva Ferreira
Abstract
Smartphones are increasingly present in human’s life. These devices can be used for the most diverse tasks, such as communications, work or entertainment. For example, in the entertainment area many people use their smartphone to watch videos or listen to music. Many users stream or play videos with the intention to only listen to the audio track. These videos might be stored on smartphone memory or on a video streaming platform such as YouTube. In this way, important resources of the smartphone, such as battery power, bandwidth, and data traffic that are limited to most users, are unnecessarily consumed. Recognizing human activities with sensors allows the development of applications for many diverse areas, from medical health supervision to entertain-ment. Initially, these systems involved the use of various sensors scattered throughout the user’s body, but with the increased processing power of smartphones and built-in sensors, it was possible using only the smartphone to recognize activities. The sensors embedded in most smartphones, such as accelerometer, gyroscope, among others, have allowed the emergence of multiple possibil-ities for a new type of applications based on the context acquired from the data they provide. With this dissertation we intend to develop a method that, based on the user context, can automatically switch between video and audio, reducing energy consumption. This would increase the time of use of the smartphone between battery recharges, and would solve the problem of unnecessary consumption of smartphone resources. This project aims to investigate the accuracy with which the context of the user is recognized, the method that obtains the best accuracy and the overhead that this system can have on the smartphone, to recognize if the user is watching a video or simply listening to the audio, analyze energy consumption and finally switches automatically between video and audio. In addition to these goals, we also intend to develop an Android application to test and evaluate the approach. A Supervised Learning approach is used along with the classi-fiers K-Nearest Neighbors, Hoeffding Trees and Naive Bayes, individually and combined to create an ensemble classifier. The dataset used was collected by the author and an overall accuracy of 93.54% was obtained for the ensemble classifier. Individually, the kNN obtained the best results when compared with the other classifiers used, obtaining an overall accuracy of 92.53%.
Keywords: Human activity recognition (HAR), mobile sensors, machine learning, mobile appli-cation, Supervised Learning, smartphone, kNN, Hoeffding Trees, Naive Bayes
Resumo
Os smartphones estão cada vez mais presentes no dia-a-dia das pessoas. Estes dispositivos podem ser usados para as mais diversas tarefas, tais como comunicações, trabalho ou entretenimento. Por exemplo, na área do entretenimento muitas pessoas utilizam o smartphone para ver videos ou ouvir música. Muitos utilizadores fazem stream ou reproduzem videos apenas com a intenção de ouvir a faixa de audio. Estes vídeos poder podem estar guardados na memória do smartphone ou então numa plataforma de streaming de vídeo, como por exemplo o YouTube. Desta forma são consumidos, de forma desnecessária, recursos importantes do smartphone, tais como a energia da bateria, a largura de banda e o tráfego de dados que é limitado na maior parte dos utilizadores. Reconhecer atividades humanas com sensores permitiu o desenvolvimento de aplicações para as mais diversas áreas, desde de supervisão médica até ao entretenimento. Inicialmente estes sis-temas implicam a utilização de vários sensores espalhados pelo corpo do utilizador, mas com o aumento do poder de processamento dos smartphones e dos sensores embutidos, foi possível pas-sar a utilizar apenas o smartphone para reconhecimento de atividades. Os sensores embutidos na maior parte dos smartphones, tais como acelerómetro, giroscópio, entre outros, permitiram múlti-plas possibilidades para um novo tipo de aplicações baseadas no contexto adquirido a partir dos dados que fornecem. Com esta dissertação pretende-se desenvolver um método, que com base no contexto do utilizador, possa alternar automaticamente entre o vídeo e o áudio, reduzindo assim o consumo de energia. Deste modo aumentar-se-ia o tempo de utilização do smartphone entre carregamentos da bateria. Desta forma resolver-se-ia o problema do consumo desnecessário dos recursos do smartphone. Este projeto tem como objetivos pesquisar a precisão com que é recon-hecido o contexto do utilizador, o método que obtém melhor precisão e a sobrecarga que este sistema pode ter no smartphone, reconhecer se o utilizador está a ver um vídeo ou simplesmente a ouvir o áudio, analisar o consumo de energia e finalmente trocar automaticamente entre vídeo e áudio. Para além destes objetivos foi também desenvolvida uma aplicação Android para testar e avaliar a abordagem. Foi utilizada uma abordagem de Supervised Learning, juntamente com os classificadores K-Nearest Neighbors, Hoeffding Trees e Naïves Bayes, individualmente e combi-nados para criar um classificador ensemble. O dataset utilizado foi recolhido pelo autor e foi obtida uma exatidão global de 93.54% para o classificador ensemble. Individualmente o kNN obteve os melhores resultados quando comparado com os restantes classificadores utilizados, obtendo um exatidão global de 92.53%.
Palavras-Chave: Reconhecimento de atividades humanas, sensores móveis, machine learning, aplicação móvel, Supervised Learning, smartphone, kNN, Hoeffding Trees, Naive Bayes
Acknowledgements
My sincere thanks to the professors João Manuel Paiva Cardoso and João Pedro Mendes Moreira for all the support, guidance and supervision during the development and writing of this disserta-tion. I also thank Ricardo Magalhães, with whom I worked in an initial phase of this dissertadisserta-tion. I would also like to thank the Professors of the Faculty of Engineering of the University of Porto with whom I contacted, for everything they taught me and advised during my academic course.
This work has been partially funded by the European Regional Development Fund (ERDF) through the Operational Programme for Competitiveness and Internationalisation - COMPETE 2020 Programme and by National Funds through the Portuguese funding agency, Fundação para a Ciência e a Tecnologia (FCT) within project POCI-01-0145-FEDER-016883. I would also like to thank the CONTEXTWA project for providing all the necessary tools to complete this dissertation, namely code and the Samsung Galaxy J5 smartphone.
Finally, I would like to express my sincere gratitude to my mother, Rosa Madalena Sousa Silva, my father, João Paulo Rocha Ferreira, and my brother, Hugo Miguel Silva Ferreira, who have always supported me throughout my life and provided resources and tools during my academic career.
Agradecimentos
O meu sincero agradecimento aos professores João Manuel Paiva Cardoso e João Pedro Mendes Moreira por todo o apoio, orientação e supervisão durante a realização e escrita desta dissertação. Agradeço também ao Ricardo Magalhães, com quem trabalhei numa fase inicial desta
dissertação.
Gostava também de agradecer aos Professores da Faculdade de Engenharia da Universidade do Porto com quem contactei, por tudo aquilo que me ensinaram e aconcelharam durante o meu percurso académico.
Este trabalho foi realizado no contexto do projecto CONTEXTWA. Por iss queria também deixar o meu agradecimento ao projeto CONTEXTWA por disponibilizar todas as ferramentas
necessárias para concluir esta dissertação, nomeadamente o código e o smartphone Samsung Galaxy J5.
Por fim, gostava de exprimir a minha mais sincera gratidão para com a minha mãe, Rosa Madalena Sousa Silva, o meu pai, João Paulo Rocha Ferreira, e ao meu irmão, Hugo Miguel Silva Ferreira que sempre me apoiaram durante toda a minha vida e proporcionaram rodos os recursos e ferramentas durante o meu percurso académico.
“I see now that the circumstances of one’s birth are irrelevant. It is what you do with the gift of life that determines who you are.”
Contents
1 Introduction 1 1.1 Context . . . 1 1.2 Motivation . . . 2 1.3 Problem Definition . . . 2 1.4 Approach . . . 3 1.5 Goals . . . 3 1.6 Document Structure . . . 42 Background and Related Work 5 2.1 Human Activity Recognition . . . 5
2.1.1 Data Collection . . . 6 2.1.2 Preprocessing . . . 7 2.1.3 Sliding Windows . . . 7 2.1.4 Feature Extraction . . . 8 2.1.5 Training . . . 9 2.1.6 Classification . . . 9
2.2 Semi Supervised Learning . . . 9
2.2.1 Self-Training . . . 10 2.2.2 Co-Training . . . 10 2.3 Classifiers . . . 11 2.3.1 K-Nearest Neighbors (KNN) . . . 11 2.3.2 Decision Trees . . . 12 2.3.3 Naïves Bayes . . . 13 2.3.4 Ensemble Learning . . . 14 2.4 Software . . . 15
2.4.1 Massive Online Analysis (MOA) . . . 15
2.4.2 Android . . . 15
2.4.3 Plotly . . . 16
2.5 Related Work . . . 16
2.5.1 Online Human Activity Recognition on Smartphones . . . 16
2.5.2 Location and Activity Recognition Using eWatch: A Wearable Sensor Platform . . . 17
2.5.3 Activity Recognition Using Smartphone Sensors . . . 18
2.5.4 COSAR: hybrid reasoning for context-aware activity recognition . . . 19
2.5.5 Improving Human Activity Classification through Online Semi-Supervised Learning . . . 20
2.5.6 A Preliminary Study on Hyperparameter Configuration for Human Activ-ity Recognition . . . 21
CONTENTS
2.6 Summary . . . 22
3 Scenarios and Dataset 23 3.1 Scenarios . . . 23
3.1.1 Walking . . . 23
3.1.2 Running . . . 24
3.1.3 Sitting on the Couch . . . 24
3.1.4 Cooking in the Kitchen . . . 25
3.2 Dataset . . . 26
3.3 Summary . . . 30
4 Implementation 33 4.1 Working Environment . . . 33
4.2 Core Architecture . . . 33
4.2.1 Data Acquisition Application . . . 34
4.2.2 Desktop Program . . . 34
4.3 Prototype . . . 35
4.3.1 Architecture . . . 36
4.3.2 The Prototype App . . . 37
4.3.3 Overhead . . . 40
4.4 Summary . . . 42
5 Experiments and Results 43 5.1 Data Visualization . . . 43
5.2 Battery Consumption . . . 44
5.2.1 Video vs Audio (Local) . . . 45
5.2.2 Local Video vs YouTube Video . . . 45
5.2.3 YouTube Video vs YouTube Video with Static Image (Black) . . . 46
5.2.4 Local Video vs Local Video with Classifiers . . . 47
5.2.5 Local Audio vs Local Audio with Classifiers . . . 48
5.2.6 Local Video with Classifiers vs Local Audio with Classifiers . . . 49
5.2.7 Local Video and Audio with and without Classifiers . . . 50
5.2.8 Battery Consumption per Classifier . . . 51
5.3 Experiments . . . 52
5.3.1 Global Accuracy . . . 54
5.3.2 Accuracy by Scenario . . . 55
5.3.3 Impact of Frequency Reduction . . . 57
5.3.4 Impact of the use of Headsets . . . 62
5.4 Summary . . . 63 6 Conclusion 65 6.1 Final Conclusions . . . 65 6.2 Future Work . . . 66 References 69 A 73 A.1 Conversion of Labels . . . 73
List of Figures
2.1 Activity Recognition Steps (Source: [SBI+15]). . . 6
2.2 Classification of techniques applied to sensor signals for feature extraction. (Source: [FDFC10]) . . . 8
2.3 How the value of k can affect the classification of a new object (Source: [Car16]). In this example, the star represents the new object and with a k=3, 2 instances of class B and 1 of class A are the nearest neighbors. . . 12
2.4 Decisions at each node to get a final classification (Source: [dOL12]). . . 13
2.5 Bayes rule in Naïve Bayes Algorithm (Source: [Car16]). . . 13
2.6 A diagram of the ensemble learning [KMG+17]. . . 15
4.1 Architecture of the desktop program. . . 35
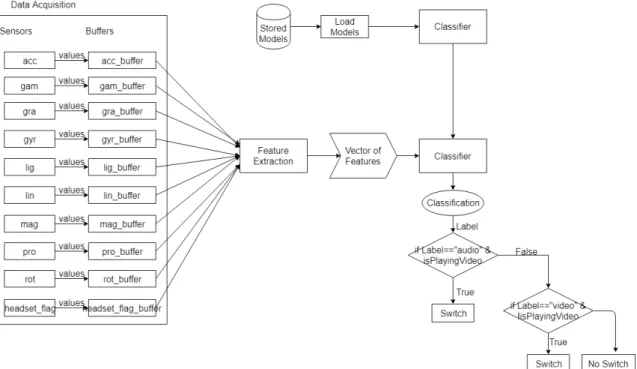
4.2 Architecture of the prototype. . . 37
4.3 Screen to set the parameters of the prototype. . . 38
4.4 Screen where the behavior of the prototype is tested. In this case video is being played. . . 39
4.5 Screen where the behavior of the prototype is emulated. In this case audio is being played. . . 40
4.6 Average execution time for each classifier and for each possible combination of classifiers. In all measurements where the KNN was used, the value of k used was 3 (i.e., k = 3). . . 42
5.1 Plot of the accelerometer data which represents the activity "Running" (top) and the activity "Walking" (bottom). Each unit represents a single sensor reading. . . 44
5.2 Battery consumption during playback of a video and audio file. The chart line has a ladder effect due to the resolution of the values being one unit. Since the resolution is one unit, whenever a battery level drops by 1% a step is generated. . 45
5.3 Battery consumption during playback of a local video and a video on YouTube. The chart line has a ladder effect due to the resolution of the values being one unit. Since the resolution is one unit, whenever a battery level drops by 1% a step is generated. . . 46
5.4 Battery consumption during playback of a YouTube video and a YouTube video with a static image. The chart line has a ladder effect due to the resolution of the values being one unit. Since the resolution is one unit, whenever a battery level drops by 1% a step is generated. . . 47
LIST OF FIGURES
5.5 Battery consumption during playback of a local video and a local video with real time classification. In this measurement was used only the ensemble classifier. The chart line has a ladder effect due to the resolution of the values being one unit. Since the resolution is one unit, whenever a battery level drops by 1% a step is generated. . . 48
5.6 Battery consumption during playback of a local audio file and a local audio file with real time classification. In this measurement was used only the ensemble classifier. The chart line has a ladder effect due to the resolution of the values being one unit. Since the resolution is one unit, whenever a battery level drops by 1% a step is generated. . . 49
5.7 Battery consumption during playback of a local audio file with real time classi-fication and a local video file with real time classiclassi-fication. In this measurement was used only the ensemble classifier. The chart line has a ladder effect due to the resolution of the values being one unit. Since the resolution is one unit, whenever a battery level drops by 1% a step is generated. . . 50
5.8 Battery consumption for local video and audio with and without real-time classi-fication. For measurements with classifiers the ensemble was used. The chart line has a ladder effect due to the resolution of the values being one unit. Since the resolution is one unit, whenever a battery level drops by 1% a step is generated. . 51
5.9 Battery consumption for the ensemble classifier and for each of the individual classifiers while playing a video. The chart line has a ladder effect due to the resolution of the values being one unit. Since the resolution is one unit, whenever a battery level drops by 1% a step is generated. . . 52
5.10 Accuracies of the ensemble and of each of the individual classifiers for the differ-ent window sizes studied. The window sizes studied range from 50 to 300. A 0% overlap was used. For the kNN the value of k used was 3 (k=3). . . 53
5.11 Correct Classifications by Combining Classifiers. . . 55
5.12 Accuracies of the ensemble and each individual classifier for each scenario stud-ied. These accuracies were obtained for a frequency reduction from 5 Hz to 2.5 Hz. A window of size 100 and with an overlap of 0% was used. . . 58
5.13 Accuracies of the ensemble and each individual classifier for each scenario stud-ied. These accuracies were obtained for a frequency reduction from 5 Hz to 1.66 Hz. A window of size 100 and with an overlap of 0% was used. . . 59
5.14 All sampling frequencies studied: the frequency at which data was collected (5 Hz) and the two frequency reductions performed (2.5 Hz and 1.66 Hz). Each frequency has 5 bars, 4 for each scenario studied and 1 for all data. The accuracies presented concern only the ensemble classifier. A window of size 100 and with an overlap of 0% was used. . . 60
5.15 Frequency reduction from 5 Hz to 2.5 Hz. For each scenario, the accuracies for the ensemble classifier are presented for the two window sizes used. The size 100 window contains 40 seconds of data and the size 50 window has 20 seconds of data. A 0% overlap was used for both windows. . . 61
5.16 Frequency reduction from 5 Hz to 1.66 Hz. For each scenario, the accuracies for the ensemble classifier are presented for the two window sizes used. The size 100 window contains 60 seconds of data and the size 30 window has 20 seconds of data. A 0% overlap was used for both windows. . . 61
LIST OF FIGURES
5.17 Accuracy of the ensemble classifier for the various frequencies studied. The win-dow size for the frequency of 5 Hz is 100, for the frequency of 2.5 Hz is 50 and for the frequency of 1.66 Hz is 30. A 0% overlap was used for all frequencies windows. 62
LIST OF FIGURES
List of Tables
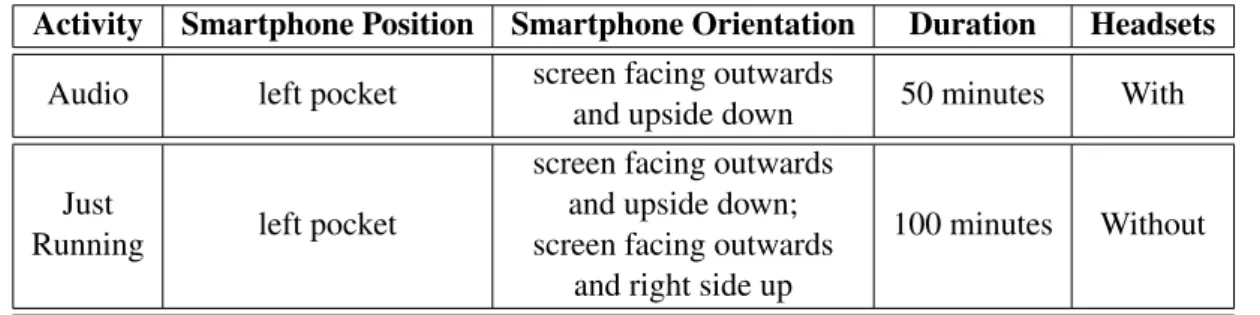
3.1 Summarizes the data collected for the Running scenario. . . 26
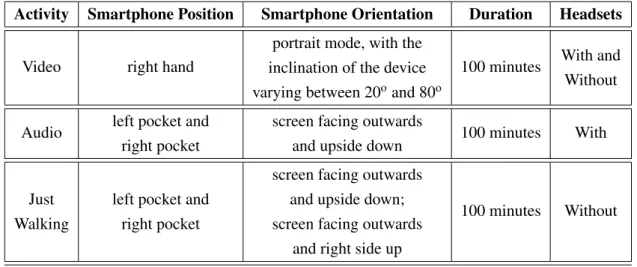
3.2 Summarizes the data collected for the Walking scenario. . . 27
3.3 Summarizes the data collected for the Sitting scenario. . . 29
3.4 Summarizes the data collected for the Kitchen scenario. . . 30
3.5 Collected Samples . . . 30
3.6 Samples Collected per Activity . . . 30
4.1 Average Execution Time for feature extraction and classification phases. . . 41
5.1 Time, in hours, that the playback of a video along with each of the classifier would take to completely discharge the battery. . . 52
5.2 Number of samples and windows per activity for the train set. The training set corresponds to 80% of the dataset. The window size is set to 100. . . 53
5.3 Number of samples and windows per activity for the test set. The test set corre-sponds to 20% of the dataset. The window size is set to 100. . . 54
5.4 Accuracy for each of the classifiers. For the kNN the value of k used was 3 (k = 3). 54 5.5 Accuracy for the Walking Scenario. For the kNN the value of k used was 3 (k = 3). 56 5.6 Accuracy for the Running Scenario. For the kNN the value of k used was 3 (k = 3). 56 5.7 Accuracy for the Sitting Scenario. For the kNN the value of k used was 3 (k = 3). 56 5.8 Accuracy for the Kitchen Scenario. For the kNN the value of k used was 3 (k = 3). 57 5.9 Accuracy (%) with and without headsets difference between them. . . 63
LIST OF TABLES
Abbreviations
HAR Human Activity Recognition HMM Hidden Markov Models KNN K-Nearest Neighbors SSL Semi Supervised Learning SL Supervised Learning SVM Support Vector Machine NB Naive Bayes
HT Hoeffding Trees
CSV Comma-separated Values ARFF Attribute-Relation File Format
Chapter 1
Introduction
This chapter introduces the topic of the dissertation. It introduces the context, the problem, the approach that was followed, the motivation, the goals of this project and presents the overall structure of this document.
1.1
Context
Smartphones are increasingly present in people’s lives. These devices can be used for many dif-ferent tasks such as communication, work and entertainment. In entertainment, smartphones are used, for instance to watch videos. These videos may be available online, on streaming platforms, or on the device’s own memory.
However, many users are only interested in listening the audio track associated to the video. In this case smartphone’s resources such as battery power are unnecessary used.
One way to solve this problem would be for the smartphone to recognize what the user is doing in order to switch between video and audio. Human Activity Recognition (HAR) [ZWN+17] aims to recognize the activities performed by humans through the analyses of a series of observations on the actions of the users. This approach can be used in several areas such as computer vision, medicine, security, entertainment and sports.
Initially, mobile phones were considered as resource-limited devices due to the fact that they did not possess enough battery and computational resources to run these systems. However, mod-ern smartphones have become more powerful in terms of available resources, such as CPU, mem-ory and battery, allowing online activity recognition [SBI+15].
Smartphones have a set of built-in hardware sensors such as accelerometers, gyroscopes, GPS, proximity and illumination sensors, microphone and magnetometer. These sensors provide data that allow the smartphone to recognize the activities performed by users. This allow HAR to be performed directly on device with data gathered from the sensors.
HAR systems need to take into account various aspects such as power consumption, processing needs, accuracy and overall system overhead.
Introduction
Main HAR tasks include data acquisition (sensing), preprocessing, feature extraction and ei-ther training or classification. At the end results, a model capable of detecting meaningful patterns. Many machine learning techniques [STJ14], such as Hidden Markov Models, Support Vector Ma-chine or K-Nearest Neighbors, have been used to match patterns to the desired activities.
1.2
Motivation
The last decade witnessed an explosion of mobile communication infrastructure and services. The current smartphones are not just communication devices instead they are personal computer packed into a small gadget.
The spread of more and more complex sensores and increased processing power on smart-phones, allow the development of increasingly complex and accurate HAR systems [SBI+15]. These developments have attracted many researchers to develop more and more HAR systems. Currently everybody carries at least one sensor on everyday life without knowing it, since many people do not know that the smartphones they own contain multiple sensors. HAR systems en-able the development of applications for the most diverse areas of human activity, such as health supervision.
In health supervision, Sebestyen et al. [SSH16] proposed a method to infer a most probable sequence of activities performed by elderly people using various sensors placed in house and on mobile devices. This method allows monitoring and supervision of single old people in their homes.
In this dissertation a method is proposed that makes the switch between video and audio ac-cording to the activities performed by the user. The proposed method may increase the time of use of the smartphone by reducing battery consumption.
HAR systems use machine learning techniques to classify activities based on data collected by the sensors. Machine learning is a field of computer science increasingly used to solve clas-sification problems. It is very promising and has been the subject of many researchers. In this dissertation, several machine learning techniques will be used in order to recognize what activities the user is performing.
With this thesis it is expected contributions to the HAR field with the development of an application capable of switching from video to audio automatically through recognition of user’s context.
1.3
Problem Definition
Despite the significant advances in mobile computing, the smartphone continues to have limited resources. With the amount of applications and functions that smartphones have today, these resources run out very quickly.
As already mentioned, many users only want to hear the audio track associated with a video. This task consumes the important resources of the smartphone, such as the battery.
Introduction
On a smartphone, this distinction between listening to the audio or watching the video can be automatically identified, knowing the context of the user and the device. By identifying the use of the video just to listen to the audio, it will allow to change to the playback of the audio track instead of the video.
This switch will save energy, bandwidth and reduce the download size (if it is an online stream-ing platform), since audio files may be smaller and easier to decode when compared to video files. Identifying the context of the user will be treated as a classification problem. A real-time activity classification system brings a huge computational weight to the smartphone. In this case, the battery lifetime has to be taken into account.
The application to be developed cannot have much impact on the user’s smartphone perfor-mance and, at the same time, it has to collect and classify the data accurately.
1.4
Approach
The main goal of this project is to develop an Android application that, based on the context of the user, can switch between video and audio automatically, in order to save the essential features of the smartphone. A Supervised Learning approach will be used.
But before starting the project itself, a great deal of research is needed on Supervised Learning algorithms, the various classifiers used to recognize human activities, the tools to use, and some techniques that can help improve the final result.
After the search is finished, it is necessary to identify the scenarios where the user may be listening only to the audio track of a video. For example, if the user is running, he/she will hardly be watching the video, so chances are he/she is only listening to the audio. Other likely scenarios are studying, cooking, lying down or sitting on a sofa.
Once we have identified the possible scenarios, we need to build the dataset. This uses data from the various sensors present on a smartphone. Users use their smartphone while practicing the identified activities. The resulting data are labeled with the name of the activity practiced. The data are pre-processed to begin with the empirical research, where the algorithms are put into practice to generate classification models.
Then the most relevant features are extracted and later these features are used to train and test the classifiers. Later, we also developed an Android application that was able to show the operation and effectiveness of our approach.
The effectiveness of this approach is evaluated through the Accuracy of the classifications, energy consumption and the overhead associated with real-time recognition. Continuous testing are performed with the goal of keeping track of the project’s evolution and progress.
At the end, conclusions are drawn based on the results obtained.
1.5
Goals
Introduction
• Research what kind of methods can achieve better results and the overhead associated with real-time recognition;
• Recognize if the user is watching the video or simply listening to the audio track, using data from the smartphone’s sensors;
• Analyze energy consumption and download size when replacing video with audio; • Automatically change between audio and video based on the user’s context; • Develop an app, for Android, to test and evaluate the approach.
1.6
Document Structure
The remainder of this document is structured as follows:
• Chapter 2, “Background and Related Work”. The objective of this chapter is to provide an overview of the work done in this area to deal with this specific problem. Concepts like supervised, unsupervised and semi-supervised learning are explained. In addition, all steps involved in the recognition of human activities are described. Sliding Windows, classifiers, model evaluation, useful techniques and tools are also described. In the end, related work with the same goal are explored and exposed in terms of successes and failures.
• Chapter 3, "Scenarios and Dataset". In this chapter the scenarios considered in this disser-tation are described, as well as the limidisser-tations of these scenarios. It also describes how the dataset was built and what data was collected.
• Chapter 4, "Implementation". In this chapter we describe the working environment and the core architecture of the project. It also describes, in more detail, the prototype developed to test the switch between video and audio according to the results of the real-time clas-sification. The architecture, application structure and overhead associated with real-time classification are discussed.
• Chapter 5, "Experiments and Results". In this chapter all the experiments carried out in this dissertation, as well as their objectives, methodologies, results and conclusions are de-scribed. The experiments carried out aim to study the battery consumption during the repro-duction of video or audio files with and without classifiers and the accuracy of the classifiers for the different scenarios under test.
• Chapter 6, "Conclusion". This chapter concludes the project with an overview of the results of the dissertation and the respective conclusions and a discussion on suggestions and ideas for future work.
Chapter 2
Background and Related Work
This chapter presents the basic concepts, methods and tools for the problem of Human Activity Recognition (HAR). It also reviews the state of art in the HAR field. The main technology and resources to be used in this dissertation are also explained.
2.1
Human Activity Recognition
The main goal of Human Activity Recognition (HAR) [CM17] is to develop systems capable of recognizing the actions of a human by automatically analyzing the ongoing events and extract their context from the captured data.
HAR has enabled novel applications in different areas, such as, healthcare, sports, security and context-aware services and applications [SBI+15]. In the initial phase of HAR systems, dedicated wearable motion sensors were used to recognize different physical activities [ZWR+17]. During data acquisition, Santos et al. [SCF+10] used a smartphone and a series of sensors connected via infrared, bluetooth and GPRS. Recently, thanks to the advances in mobile computing, such as the increase in processing power and the large number of sensors that a smartphone possesses, there has been a shift towards mobile phones [ZWR+17].
The smartphone based HAR, can be divided into two types. The first one is online activity recognition. In this type data collection, data processing and classification are carried out locally on the smartphones. The other type is offline activity recognition. In offline type the classification is carried out in non-real-time or offline [ZWR+17].
HAR systems consist of five phases: • sensing or data acquisition (1); • preprocessing (2);
• feature extraction (3); • training (4);
Background and Related Work
As seen in Figure 2.1there are two different stages: Preparation and Use.
Figure 2.1: Activity Recognition Steps (Source: [SBI+15]).
The Preparation stage can either be offline on a desktop machine or online on the smartphone itself. The Preparation stage is used to build the model parameters to later be used in the classi-fication. This stage includes the following HAR phases: data acquisition, preprocessing, feature extraction and training [SBI+15].
In the Use stage, the trained classifiers are used to classify different activities. This step can be done either offline in a machine learning tool, such as MOA, or online on the mobile smartphone itself. This stage includes the following HAR phases: data acquisition, preprocessing, feature extraction and classification [SBI+15].
2.1.1 Data Collection
The data needed to build the dataset is obtained through smartphone sensors. All the data are handled as streams. The sensor data are acquired at a fixed rate. The data is collected by test subjects when practicing the different pre-selected activities during a certain period of time. This period of time should be sufficient for the activities to be detected. Sebestyen et al. [SSH16] collected data lasting 20-25 seconds.
During data collection phase, it is important to pay attention to the type of sensors and the sampling rates. High sampling rates can avoid the information loss of signals and can lead to high accuracy of recognition [ZWR+17]. Liang et al. [LZY+12] used a sampling rate of 2 Hz for a tri-accelerometer and obtained an average accuracy of 89,1% for 11 activities, namely: standing, sitting, lying, driving, walking, running, ascending stairs, descending stairs, cycling and jumping.
Background and Related Work
However, the higher the sampling rates, the more energy is consumed. Due to this fact, it is important to consider the trade-off between the sampling rate and the energy consumption [ZWR+17].
2.1.2 Preprocessing
Sensor data acquired from the sensors are fed to the preprocessing stage. The preprocessing phase prepares the raw data to be transformed into a set of finite value features [SCF+10]. Normally the raw data collected by the sensors are noise-corrupted, which can lead to measurement inaccuracies and makes it hard to reflect the motion changing of smartphones as accurately as possible [CS17]. After obtaining the data from the previous phase, it is necessary to apply a filtering process before classification, in order to remove the noise associated with the data. In most cases, the noise associated with sensor data is neglected. However there is a type of noise that can seriously affect the classification of activities. This noise is caused by the vibrations that occur on the smartphone when it is carried by the user [MGARdlC15].
Morillo et al. [MGARdlC15] used a Butterworth low pass filter to reduce the noise generated. In order to remove the noise, Sebestyen et al. [SSH16] used a combination of filters, a Median Filter and a Moving Average Filter applied 4 times.
2.1.3 Sliding Windows
An activity, by itself, can not be represented by a single read from smartphone sensors, but it is a pattern on a sequence of the sensor readings [Car16]. Since the sensor data are streams, it is necessary to find methods of analyzing these data streams. One way to analyze data streams is to use sliding windows. The sliding window method is the most used to segment data for activity recognition. The sliding window method accumulates sensor data over a fixed time window. In this method, features are computed over one time window, and then are used as an instance for a training and testing set [KLG11]. A key factor is the selection of sliding window length, because the computational complexity depends on the number of samples [LaL13]. According to Zheng et al. [ZWR+17] the accuracy of the activity recognition systems increases with increasing of sliding window length. However, as the length of the sliding window increases, the delay in recognition of activities increases [ZWR+17].
The sliding window method uses two approaches: overlapping and non-overlapping sliding windows. In the non-overlapping approach, consecutive time windows do not share common data samples. The overlapping approach shares common data samples between time intervals, for example two consecutive time windows may have 50% of data samples in common [KLG11]. Cardoso et al. [CM17] tested the accuracy of activity recognition using non-overlapping and a 70% overlapping window. In the end they concluded that Overlapping Windows are significant and consistently better than Non-Overlapping Windows.
Background and Related Work
2.1.4 Feature Extraction
Human activities are performed over a longer period of time when compared to the sensor sam-pling rate. This step is important for filtering relevant information and obtaining quantitative mea-sures that allow signals to be compared [LaL13]. Extracting the right features is very important to the final recognition performance [STJ14].
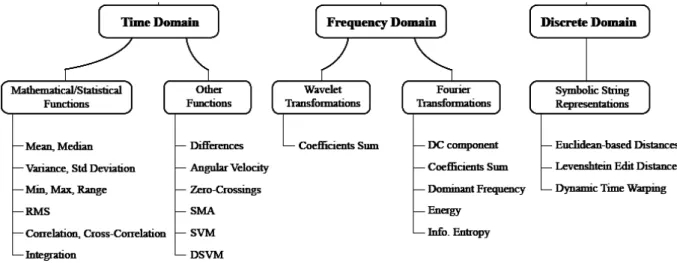
According to Figo et al. [FDFC10] there are three types of features extraction domains: Time Domain, Frequency Domain and Discrete Domain. Figure 2.2present all the domains of feature extraction, as well as some features associated to each domain.
Figure 2.2: Classification of techniques applied to sensor signals for feature extraction. (Source: [FDFC10])
Time Domain: Time-domain features contain the basic statistics of each data segment [STJ14]. These features are simple mathematical and statistical metrics and are used to extract basic signal information from raw sensor data. Furthermore, these metrics are used as preprocessing steps for metrics in other domains and a way to select key signal characteristics [FDFC10].
Frequency Domain: Frequency-domain features describe the periodicity of the sensor sig-nals [STJ14]. These repetitions usually correlates to the periodic nature of a specific activity such as walking or running. An often used signal transformation technique is the Fourier transform [FDFC10]. This transformation allows to represent in the frequency domain important character-istics of a time-based signal, such as average and dominant frequency components [FDFC10].
Discrete Domain: The interest in transforming sensor data into strings of discrete symbols has been proposed [FDFC10]. A fundamental aspect of this transformation has been the pro-cess of discretization. Although a limited symbol alphabet can lead to substantial compression in the signal representation, there is a risk of information loss. As soon as the signals are mapped to strings, exact or approximate matches and edit distances are fundamental techniques used to evaluate the similarity of strings and consequently to discover know patterns or classify the user activity [FDFC10].
Background and Related Work
2.1.5 Training
Before a HAR system can be used it is necessary to train the classifiers. The training phase is the preparation step to obtain the model parameters for later use in classification [SBI+15]. In this phase, the extracted features, from the previous phase, are used as input to train the classifier [BBS14].
To train the classifiers it is necessary to separate the data into training and testing sets. The training set is the actual dataset that is used to train the model. The model learns from this data. The test set provides the gold standard used to evaluate the model. It is only used once a model is completely trained [LCB06].
The training can be offline, on a desktop, or online on the smartphone itself. If training is offline, raw data from activities is first collected and stored. Later, these data are used for obtain-ing the model parameters. On the other hand, if trainobtain-ing is online, the raw data are not stored but instead directly processed for training. This step is performed infrequently due to the high processing effort, and the resulting models are stored for future use in the online activity recogni-tion. Due to the fact that it is computationally expensive, many researchers choose to use offline training [SBI+15]. Kose et al. [KIE12] used the online training for activity recognition. Liang et al. [LZY+12] used offline training on a desktop machine.
2.1.6 Classification
In this phase, the trained classifiers are used to classify different activities [SBI+15]. The features extracted from the raw sensor data are used as inputs of the classification algorithms [AMD+15]. Classification is considered a form of prediction, i.e., classification is the problem of identify-ing to which activity a new observation belongs. In case of Unsupervised Learnidentify-ing the procedure is known as clustering, and involves grouping data into categories based on some measure of inherent similarity [Car16].
Supervised Learning requires the use of labeled data to train the classifiers. On the other hand, Unsupervised Learning, tries to directly construct recognition models from unlabeled data [CN09]. Semi-Supervised Learning uses labeled and unlabeled data for training. Usually uses small amounts of labeled data and large amounts of unlabelled data [CM17].
2.2
Semi Supervised Learning
Semi-supervised learning is a special form of classification. As already mentioned, traditional supervised classifiers use only labeled data to train. However, labeled instances are often diffi-cult, expensive, or time consuming to obtain, as they require the efforts of experienced human annotators. Meanwhile, unlabeled data may be relatively easy to collect [Zhu08]. Typically Semi Supervised Learning uses a small amount of labeled data versus a large amount of unlabeled one [CM17].
Background and Related Work
Semi-supervised learning addresses this problem by using large amount of unlabeled data, together with the labeled data, to build better classifiers. This learning technique requires less human effort and gives higher accuracy [Zhu08].
2.2.1 Self-Training
Self-training [Zhu08] is a technique used for semi-supervised learning. This technique consists of training the classifier with a small set of labeled data and then use the classifier to classify the unlabeled data, adding the most confident classifications and their predicted labels, to the training set. The classifier is re-trained and the procedure repeated. Summing up the classifier uses its own predictions to teach itself [Zhu08].
Self-training has been applied to several natural language processing tasks and to object de-tection systems from images [Zhu08].
2.2.2 Co-Training
Co-Training [Zhu08] is a technique used for semi-supervised learning. This technique assumes that:
• features can be split into two sets;
• each sub-feature set is sufficient to train a classifier; • the two sets are conditionally independent given the class. Co-Training follows the following steps:
• First two separate classifiers are trained with the labeled data, on the two sub-feature sets respectively;
• Then each classifier assigns a label to the unlabeled data, and ‘teaches’ the other classifier with the few unlabeled examples they feel most confident;
• Finally each classifier is retrained with the additional training examples given by the other classifier, and the process repeats [Zhu08].
In co-training, unlabeled data helps reducing the version space size, i.e., the two classifiers must agree on the much larger unlabeled data as well as the labeled data. We need the assumption that features are sufficiently good, so that we can trust the labels by each learner. The sub-features need to be conditionally independent so that one classifier’s high confident data points are independent and identically distributed samples for the other classifier [Zhu08].
This technique only works well if the sub-feature sets are independent, i.e., one of the clas-sifiers correctly labels a piece of data that the other classifier previously misclassified. If both classifiers agree on all the unlabeled data, in other words they are not independent, labeling the data does not create new information [Car16].
Background and Related Work
Zhou and Li [ZL05] propose ‘tri-training’ which uses three learners. If two of them agree on the classification of an unlabeled point, the classification is used to teach the third classifier. This approach thus avoids the need of explicitly measuring label confidence of any learner [ZL05].
2.3
Classifiers
Classifiers are algorithms responsible for categorizing new observations, after training on known instances [Car16].
2.3.1 K-Nearest Neighbors (KNN)
In general, KNN [STJ14] is one of the most popular algorithms for pattern recognition and perhaps the simplest classification algorithm.
This algorithm is based on lazy learn, which means that it does not have an explicit learning phase. Instead, this algorithm memorizes the training objects, keeping them in a memory. The value of K defines how many neighbor objects have their class label consulted1.
It works by searching for the K closest training examples in the feature space. A new object is therefore classified by a majority vote of its neighbors, i.e., assigned to the class most common among its K nearest neighbors [KS12]. KNN uses a local-learning approach since it only uses the class information of those objects most similar to the new object1.
Before using the KNN is necessary to set the K, i.e., the number of nearest neighbors that are considered. The best choice of K depends upon the data [KS12]. A very large value may include neighbors that are very different to the object to be classified. But on the other hand if the value of K is too small, only objects very similar to the object to have its class predicted will be considered. Larger values of K may reduce the effect of noise on the classification, but make boundaries between classes less distinct. Also, if the goal is binary classification, it is helpful to choose an odd number to avoid ties [KS12].
Background and Related Work
Figure 2.3: How the value of k can affect the classification of a new object (Source: [Car16]). In this example, the star represents the new object and with a k=3, 2 instances of class B and 1 of class A are the nearest neighbors.
Kose et al. [KIE12] developed a Clustered KNN for their online activity recognition system. They evaluated the impact of K value on the classification performance of clustered KNN and concluded that increasing the K value affected accuracy rates positively. They observed on average 87% accuracy with K=10 whereas it increased to 91% when K=50 for the classification of four different activities: running, walking, standing and sitting.
Siirtola and Röning [SR12] used kNN in activity recognition process. The kNN was used to classify five activities: walking, running, cycling, driving a car and idling (sitting or standing). The average classification accuracy using knn was 94.5%.
2.3.2 Decision Trees
Decision trees build a hierarchical model. In this model attributes are mapped to nodes and edges represent the possible attribute values. Each branch from the root to a leaf node is called a classi-fication rule [LaL13].
A decision tree uses a divide-and-conquer strategy [Utg89]. In this strategy, a problem is solved by dividing it into simpler and smaller problems, and then applying the same strategy to the smaller problem. This division continues until the problem is simple enough to be directly solved 2. Solutions of these sub-problems can then be combined into a solution of the complex problem [Utg89].
The decision tree’s structure consists of a tree in which each node is a decision node, usually containing some condition based on attribute values, and two or more successors nodes. It can be also a leaf node, which is usually labeled with a class [Utg89].
2João Moreira. 2017. "Advanced Classification Methods". Presentation, FEUP , 2017
Background and Related Work
Figure 2.4: Decisions at each node to get a final classification (Source: [dOL12]).
For being an algorithm with low complexity in implementation, decision trees are used as the main classifier in many activity recognition systems [STJ14].
The disadvantage of decision tree lies on updating the model. After the decision tree model is built, it might be costly to update the model to integrate the new training examples [STJ14].
Walse et al. [WDT16] use several machine learning algorithms based on decision trees to clas-sify six activities: walking, jogging, walking upstairs, walking downstairs, sitting, and standing. The algorithms used are: Decision Stump, Hoeffding Tree, Random Tree, J48, Random Forest and REP Tree. Results were obtained from 57.31% for Decision Stump, 87.84% for Hoeffding Tree, 95.69% for Random Tree, 97.33% for J48, 97.83% for Random Forest and 94.44% for REP Tree.
2.3.3 Naïves Bayes
The Naïve Bayes belongs to the family of probabilistic classifiers1. Naïve Bayes is a generative Machine Learning algorithm. This type of algorithm induce classification models based on joint probabilities, the probability that a given object belongs to a particular class1.
The Naïve Bayes classifier greatly simplify learning process by assuming that features are independent given class [Ris01].
Background and Related Work
For a new example, the probability of a class given that example can be calculated by applying Bayes theorem:
• P(c|x) is the posterior probability of class (target) given predictor (attribute);
• P(c) is the prior probability of class. Can be obtained by simply verifying how frequent has the class been outputted in the seen data;
• P(x|c) is the likelihood which is the probability of predictor given class. The likelihood of a class can be obtained by multiplying the frequency of the example attribute values that result in that class, on the seen data;
• P(x) is the prior probability of predictor. This is a constant and can be ignored [Car16]. By multiplying the likelihood by prior probability of class, we obtain the relative probabilities of each class, given the new example. The class with more probability is more likely to be the true class of the example. In this approach the input features are assumed to be independent [AMD+15].
It only requires a small amount of training data to estimate the parameters necessary for clas-sification. This is important when dealing with an application in mobile environment, where the memory space is limited as well the processor power [Car16].
The Naive Bayes classifier is very popular due to its simplicity and ease of implementation [AMD+15]. Naive Bayes has proven effective in many practical applications, including text clas-sification, medical diagnosis, and systems performance management [Ris01]. The Naive Bayes classifier is also quite effective in various data mining tasks [KHRM06].
2.3.4 Ensemble Learning
Ensemble Learning [LaL13] instead of using a single learning algorithm, this method strategi-cally generates and combines the output of several classifiers to improve classification accuracy. This way solves the same problem and gets better predictive performance than of the algorithms individually [LaL13].
Ensemble Learning has been shown to be an efficient way of improving predictive accuracy and decomposing a complex problem into easier sub-problems. The selection of classifiers is an important factor. An ideal ensemble includes individual classifiers which are characterized by high diversity and accuracy. Classifiers must be selected to obtain positive results from their combination. It is also important to propose a combination rule, responsible for the final decision of the ensemble, which should explore the strengths of each individual classifier [KMG+17].
Ensemble Classifiers are clearly more expensive, computationally speaking, as they require several models to be trained and evaluated [LaL13].
There are several ensemble learning algorithms [Oza05]. The best known are Boosting and Bagging [Oza05]. In bagging each classifier has the same vote while boosting assigns different voting strengths to each classifier on the basis of their accuracy [Qui96].
Previous work in HAR uses Ensemble Learning, for instance, [Car16]. 14
Background and Related Work
Figure 2.6: A diagram of the ensemble learning [KMG+17].
2.4
Software
The software expected to be used in the development of this dissertation are described below. These software will enable the development of the application that will allow to test and evaluate the proposed solution.
2.4.1 Massive Online Analysis (MOA)
MOA [BHKP10] is a software environment written in JAVA, for implementing algorithms and running experiments for online learning from evolving data streams. It includes a collection of machine learning algorithms (classification, regression, clustering, outlier detection, concept drift detection and recommender systems) and tools for evaluation.
It is related to WEKA (Waikato Environment for Knowledge Analysis) [BHKP10], which is an award-winning open-source workbench containing implementations of several batch machine learning methods.
2.4.2 Android
Android [Goo18] is a mobile operating system developed by Google, based on the Linux kernel and designed primarily for touchscreen mobile devices such as smartphones and tablets.
The Android SDK provides the tools and APIs necessary to begin developing applications on the Android platform using the Java programming language. It includes a debugger, libraries, emulators, documentation, sample code, and several tutorials. Developers have full access to the same framework API’s used by the core applications.
Since both Android and MOA have Java as their programming language, it becomes easier to integrate both together [Goo18].
Background and Related Work
2.4.3 Plotly
Plotly [Plo18] is a Python open source graphing library. Plotly is an interactive, open-source, and browser-based graphing library for Python. Also ships with over 30 chart types, including scientific charts, 3D graphs, statistical charts, SVG maps, financial charts, and more.
Plotly’s Python graphing library makes interactive, publication-quality graphs online. Exam-ples of how to make line plots, scatter plots, area charts, bar charts, error bars, box plots, his-tograms, heatmaps, subplots, multiple-axes, polar charts, and bubble charts that can be seen in [Plo18].
2.5
Related Work
It was previously explained the main steps that a HAR system should follow, the classifiers most used in these systems and the main concepts behind machine learning applied to data streams.
In this section we present similar work done by other researchers. For each similar project is presented the main idea, the dataset collected, the features extracted from the raw data, the main experiments performed, the recognized activities, the obtained results and some disadvantages of these systems.
The analysis of the related work allows to elaborate the best strategy to follow in this disser-tation. The papers were chosen because they relate to this dissertation in terms of the classifiers used, recognized human activities and the use of supervised and semi-supervised learning.
2.5.1 Online Human Activity Recognition on Smartphones
Kose et al. [KIE12] developed an app for online activity recognition on smartphones using the built-in accelerometers. They use a single tri-axial accelerometer to recognize four main activities: walking, running, standing and sitting.
For data collection, they developed an application for Android called Activity Logger. In this application, user selects the activity to be performed, places the smartphone into the pocket and starts to perform the selected activity. For each activity, this application creates different training data files in which raw data from the 3-axes of the accelerometer is being logged. In the test phase, the application allows the user to select the system parameters, such as the sensor sampling rate and window size. Tests and data collection were performed with five volunteer subjects whose average age is 27 (1 female and 4 male). Both training and classification stages are performed on the smartphone. Supervised learning was used for classification.
All subjects carried the smartphone in the front pocket of their pants during both test and training phase. Each experiment lasted 4 minutes where each activity was performed for 60 sec-onds. The same test scenario was repeated 9 times with different system parameters based on window size and sampling rate. They have used several types of Android smartphones, Samsung SII Galaxy, HTC Desire Z, Samsung Galaxy Gio and T-Mobile G2 Touch (HTC Hero).
Background and Related Work
After data acquisition, the raw data is preprocessed using a low pass filter for noise removal. Different features were chosen depending on the classifier used. Clustered KNN and Naïve Bayes were used as classifiers. For clustered KNN four features, which are average, minimum, maxi-mum, and standard deviation, were extracted.
In addition to the accuracy, the impact that this system had on the smartphone’s resources, namely CPU utilization and memory usage, was also analyzed. Naïve Bayes achieved a 48% av-erage accuracy rate for all subjects with different sampling rates and window sizes. Compared to Naïve Bayes, on average, clustered KNN achieved a much better classification performance, around 92% accuracy. They also evaluated the impact of K value on the classification performance of clustered KNN and as expected, increasing the K value affected accuracy rates positively. They observed on average 87% accuracy with K=10 whereas it increased to 91% when K is 50. How-ever, accuracy rates were not affected from further increase of K values. They further analyzed the effect of sampling rate and window size on accuracies. In general, worst results are observed in cases when window size is selected as 2 seconds whereas best results are obtained with win-dow size of 1 second. For the winwin-dow sizes studied, sampling interval does not have a significant impact on the accuracy results. They obtained best results in the case where K is selected as 50, window size is selected as 1 second and sampling interval is selected as 50 msec. According to the tests performed with five different subjects, they obtained average 92% accuracy rate for this case.
To analyze the impact of the application on the smartphone all measurements were taken from Samsung Galaxy Gio. According to the results, CPU and memory usage never exceeded 42% and 22 MB, respectively. Applications using clustered KNN consume nearly the same amount of resources. On the other hand, Naïve Bayes has considerably higher CPU usage.
2.5.2 Location and Activity Recognition Using eWatch: A Wearable Sensor Plat-form
eWatch [MRSS06] is an online HAR system which that was built into a wrist watch form. This device was built with 4 sensors, namely an accelerometer, a light sensor, a thermometer and a microphone. In the study they focussed on six primary activities: sitting, standing, walking, as-cending stairs, desas-cending stairs and running.
To build the dataset they placed the sensor hardware on the left wrist, belt, necklace, in the right trouser pocket, shirt pocket, and bag. The subjects wore six eWatch devices located at these body positions during the study. The eWatch recorded sensor data from the accelerometer and light sensor into the flash memory. The annotations were done using an application running on an extra eWatch worn by the lead experimenter. Six subjects participated in the study; each subject performed the given tasks in 45 to 50 minutes. In total, it was collected over 290 minutes of sensor data. eWatch recorded both axes of the accelerometer and the light sensor. All sensors values were recorded with a frequency of 50 Hz and with 8 bit resolution. The data was collected under
Background and Related Work
controlled conditions, with a lead experimenter supervising and giving specific guidelines to the subjects on how to perform the activities.
The raw data collected from the accelerometers and the light sensor were split into short time windows. These windows are then transformed into the feature space by calculating several feature functions over the individual windows. Only time domain features were considered to avoid the costly computation that is required to transform the signal into the frequency domain.
They evaluated and compared several classification methods, namely Decision Trees (C4.5 algorithm), k-Nearest Neighbor, Naive Bayes and the Bayes Net classifier. Decision Trees and Naive-Bayes were found to achieve high recognition accuracy with acceptable computational com-plexity. Due to this fact the C4.5 classifier was chosen since it provides a good balance between accuracy and computational complexity.
The overall accuracy was up to 92.5% for the six ambulation activities. The execution time for feature extraction and classification is less than 0.3 ms, making the system very responsive. However, it achieved less than 70% for activities such as descending and ascending stairs.
To test the device on a daily basis a subject wore the eWatch with the built-in activity classifier on the wrist during the day. The system classified the activity in real time and recorded the classi-fication results to flash memory. In this test the device store 100 minutes of activity classiclassi-fication, as the user walked to a restaurant, sat down, ate lunch, went back to the office and sat down to continue working. The classification results match well with the actual activities. However eating lunch was partially interpreted as walking or running activity due to arm movements.
2.5.3 Activity Recognition Using Smartphone Sensors
Anjum et al. [AI13] developed a smartphone app that performs activity recognition that does not require any user intervention. This app is called Activity Diary and was developed for Android. It is also capable of recognizing human activities in real time. The app is capable to recognize seven main activities: inactive, walking, running, climbing stairs, descending stairs, cycling and driving. To build the dataset, an app was developed to collect data from smartphone sensors. Data collection was performed on a Samsung Galaxy Y phone with Android Gingerbread version 2.3.3. Smartphone placements during data collection were varied and included placement in hand, pants pocket, shirt pocket and handbag. They collected data from ten different people ranging in age from 12 to 25. A group of four people were used for training the data and the remaining users provided test data for the activity classification. In total were obtained 510 activity traces. Each activity trace contains data consisting of time series of 3 accelerometers and 3 gyroscopes. It also contains data from the phones GPS unit that includes longitude, latitude and speed.
In the pre-processing phase, using Eigen-decomposition of the covariance matrix, they cor-rected the varying orientation of the smartphone. The varying orientation of a smartphone does not allow a meaningful comparison of measurements of a particular axis accelerometer with mea-surements of the same axis accelerometer from a different activity trace.
Background and Related Work
Only time domain features were considered to avoid the costly computation that is required to transform the signal into the frequency domain. The time domain features used were the mean, variance, period, and Goodness of Linear Fit.
They trained and evaluated four different classification algorithms: Naive Bayes, C4.5 De-cision Tree, K-Nearest Neighbor (KNN) and Support Vector Machine (SVM). For performance evaluation they used 10-fold cross validation. This means, activity traces in the data set were di-vided into 10 sets. One set was selected to serve as test data, while the remaining 9 were used for training the classifier. Naive Bayes obtained a precision of 83%. The C4.5 obtained a precision of 94%. The KNN, with K=1, obtained a precision of 80%. The SVM obtained a precision of 79%.
2.5.4 COSAR: hybrid reasoning for context-aware activity recognition
Riboni and Bettini [RB11] developed a mobile context-aware activity recognition system, called COSAR (Combined Ontological/Statistical Activity Recognition) supporting hybrid statistical and ontological reasoning. They propose a new variant of multiclass logistic regression as the statisti-cal recognition method, and design an algorithm to integrate this method with ontologistatisti-cal reason-ing.
The system is capable to recognize the following activities and contexts: brushing teeth, hiking up, hiking down, riding bicycle, jogging, standing still, strolling, walking downstairs, walking upstairs and writing on blackboard.
To build the dataset the different activities were performed both indoor (hospital building, kitchen, laboratory, living room and rest room) and outdoor (garden, meadow, urban area and wood) by 6 volunteers (3 men and 3 women, ages ranging from 30 to 60). Each activity was per-formed by 4 different volunteers for 450 seconds each. While performing the activities, volunteers wore one sensor on their left pocket and one sensor on their right wrist to collect accelerome-ter data, plus a GPS receiver to track their current physical location. Overall, each activity was performed for 30 min; hence, the dataset is composed of 5 hours of activity data. Samples from ac-celerometers were taken at 16 Hz. For each activity instance, accelerometer readings were merged to build a feature vector composed of 148 features, including means, variances, correlations, kur-tosis, and other statistical measures.
To make the system more resistant to misclassification, COSAR uses a concept of potential activity matrix to filter activities based on the user’s location. For instance, if the user is walking downstairs, he is probably not in the woods.
They also developed the COSAR-hist (historical) which takes into account the classifications of previous windows. For example, if the predictions for the last five time windows were “jogging-jogging-walking-jogging-jogging”, the third window (“walking”) was likely a misclassification. In this case “walking”, will be ignored. The COSAR technique obtained an accuracy of 89%. The COSAR-hist technique obtained an accuracy of 93%. In some cases, standing still was confused with writing on a blackboard, as well as hiking up with hiking down. This is due to the fact that they are very similar activities in the movements performed.
Background and Related Work
2.5.5 Improving Human Activity Classification through Online Semi-Supervised Learning
Cardoso and Moreira [CM17] developed an online human activity recognition system through the use of Semi-Supervised Learning. They also compare the accuracy of algorithms with supervised learning and with semi-supervised learning.
The data set was collected with 30 volunteers, aged between 19 and 48 years. Each volunteer performed a protocol composed of 12 basic activities and their transitions: standing, sitting, lay-ing, walklay-ing, walking downstairs, walking upstairs, stand-to-sit, sit-to- stand, sit-to-lie, lie-to-sit, stand-to-lie and lie-to-stand. The recording was performed at a constant rate of 50Hz by an ac-celerometer and a gyroscope of a Samsung Galaxy SII. Each person repeated the activity routine twice, totaling around 15 minutes of data per person.
The following experiments were carried out: Perfect Segmentation Online Supervised Learn-ing, Perfect Segmentation Online Semi-Supervised LearnLearn-ing, Fixed-Length Sliding Window On-line Supervised Learning, Dynamic Data Segmentation, Fixed-Length Sliding Window OnOn-line Semi-Supervised Learning and Online Semi-Supervised Learning Using The Author’s Data. From these experiences the ones that will be analyzed are Fixed-Length Sliding Window Online Super-vised Learning and Fixed-Length Sliding Window Online Semi-SuperSuper-vised Learning, because they are the closest ones with the objectives of this thesis.
The used classifiers were: Naive Bayes, Very Fast Decision Trees and KNN. They also used Democratic Ensemble and Confidence Ensemble.
For the Democratic Ensemble the votes of each classifier in the ensemble were collected, equally scaled, and added. In the end, the final classification is the most voted activity. On the other hand the Confidence Ensemble uses the confidence of classifiers to classify an instance. For example: if a classifier is 99% certain of an activity label, but the other two agree on a different activity with just 30% certainty, then first classifier’s opinion should be taken into account.
In the experience Fixed-Length Sliding Window Online Supervised Learning both overlapping and non-overlapping sliding windows were tested, with the overlapping having an overlap value of 70%. They obtained an average accuracy of 81% for Non-Overlapping and 83% for Overlapping. From the analysis of the obtained results they concluded that Overlapping Windows are significant and consistently better than Non-Overlapping Windows.
In the experience Fixed-Length Sliding Window Online Supervised Learning, Semi-Supervised Learning and Semi-Supervised Learning were compared with a sliding window with 70% overlapping. For Supervised Learning an accuracy of 80% was obtained and for Semi-Supervised Learning an accuracy of 79% was obtained, for individual classifiers. Supervised Learning got an accuracy of 82.69% for Democratic and 84.55% for Confidence. Semi-Supervised Learning got an accuracy of 83.03% for Democratic and 84.63% for Confidence. In average, the Semi-Supervised Learning approach reduced the models performance. However, when working as an ensemble, their view of the data was beneficial at achieving consistently positive results.
Background and Related Work
2.5.6 A Preliminary Study on Hyperparameter Configuration for Human Activity Recognition
Garcia et al. [GCM+18] conducted a study on the impact of two hyperparameters, window size and overlapping between windows, on activity classification accuracy, for each user, using a leave-one-user-out evaluation approach. In addition, they also performed some experiments in the ODROID-XU+E board to evaluate the performance of the hyperparameters in terms of energy consumption and execution time.
In the study, the PAMAP2 public dataset was used. The data from this dataset was collected from three devices positioned in different body areas: wrist, chest and ankle. Each device con-tributes with data from three sensors: a 3-axis accelerometer, a 3-axis gyroscope and a 3-axis magnetometer. The PAMAP2 dataset contains 18 different activities: walking, running, nordic walking, cycling, lying, sitting, standing, ascending and descending stairs, ironing, vacuum clean-ing, rope jumpclean-ing, watching TV, computer work, car drivclean-ing, folding laundry, house cleaning and playing soccer. PAMAP2 contains 1,926,896 samples of raw sensor data from 9 different users. Data were collected at a frequency of 50 Hz.
A sliding window of raw sensor data from PAMAP2 dataset, is processed and converted into a single instance containing the features calculated based on the raw data. instance containing features to be used for the classification. These features include time-domain features, specifically mean and standard deviation for each sensor signal and Pearson Correlation between axes for the 3D sensors.
The hyperparameters explored were: the sampling window size (from 100 to 1000 with in-crements of 100) and the overlapping between windows (from 0.0 to 0.9 with inin-crements of 0.1). They conducted four experiments with a HAR system featuring an ensemble classifier consisting of three classifiers: kNN, Nave Bayes, and Hoeffding Tree (VFDT). They also intend to analyze the impact of using a semi supervised approach for activity recognition with a leave-one-user-out implementation. Results are shown by: window size, overlapping size, user and activity.
The results showed that Semi-supervised can improve accuracy, but not significantly. The Semi-supervised approach reduces variance for most of overlapping window and has average ac-curacy close to 90%. Overlapping has more influence on acac-curacy for values higher than 0.7, but semi-supervised is less susceptible to that influence than the supervised approach. Semi su-pervised also improves accuracy for window size hyperparameter. Windows with small sizes has worse results, especially for sizes equal to 100 and 200. For user 5, either in supervised approach or semi supervised, the variance is higher than users 2 and 1. The semi-supervised ensemble reduces accuracy variance in users 4 and 8.
For window size 500 and overlapping of 0.8, the accuracy of each activity has notable dif-ferences depending on the user. For example, for user 1 the highest accuracy is for the activities Running, Cycling, Vacuum Cleaning and Ironing, but is not the same for user 7, where activities, such as: Lying, Standing, Walking and Nordic Walking, have better accuracy values.
![Figure 2.1: Activity Recognition Steps (Source: [SBI + 15]).](https://thumb-eu.123doks.com/thumbv2/123dok_br/19254498.977106/30.892.191.689.208.484/figure-activity-recognition-steps-source-sbi.webp)
![Figure 2.3: How the value of k can affect the classification of a new object (Source: [Car16])](https://thumb-eu.123doks.com/thumbv2/123dok_br/19254498.977106/36.892.252.601.148.419/figure-value-affect-classification-new-object-source-car.webp)
![Figure 2.6: A diagram of the ensemble learning [KMG + 17].](https://thumb-eu.123doks.com/thumbv2/123dok_br/19254498.977106/39.892.192.738.134.364/figure-diagram-ensemble-learning-kmg.webp)