Research Article
Predictors of Quality of Life in Portuguese Obese Patients:
A Structural Equation Modeling Application
Estela Vilhena,
1,2,3José Pais-Ribeiro,
4,5Isabel Silva,
6Helena Cardoso,
7and Denisa Mendonça
2,31Polytechnic Institute of C´avado and Ave, 4750-810 Barcelos, Portugal 2ICBAS, University of Porto, 4050-313 Porto, Portugal
3ISPUP, Institute of Public Health, University of Porto, 4050-600 Porto, Portugal
4Faculty of Psychology and Educational Sciences, University of Porto, 4200-135 Porto, Portugal 5UIPES, 1140-041 Lisbon, Portugal
6University of Fernando Pessoa, 4249-004 Porto, Portugal
7UMIB/ICBAS and Hospital Santo Ant´onio/CHP, 4099-001 Porto, Portugal Correspondence should be addressed to Estela Vilhena; [email protected]
Received 5 October 2013; Revised 23 December 2013; Accepted 24 December 2013; Published 16 February 2014 Academic Editor: Terry Huang
Copyright © 2014 Estela Vilhena et al. This is an open access article distributed under the Creative Commons Attribution License, which permits unrestricted use, distribution, and reproduction in any medium, provided the original work is properly cited. Living with obesity is an experience that may affect multiple aspects of an individual’s life. Obesity is considered a relevant public health problem in modern societies. To determine the comparative efficacy of different treatments and to assess their impact on patients’ everyday life, it is important to identify factors that are relevant to the quality of life of obese patients. The present study aims to evaluate, in Portuguese obese patients, the simultaneous impact of several psychosocial factors on quality of life. This study also explores the mediating role of stigma in the relationship between positive/negative affect and quality of life. A sample of 215 obese patients selected from the main hospitals in Portugal completed self-report questionnaires to assess sociodemographic, clinical, psychosocial, and quality of life variables. Data were analysed using structural equation modeling. The model fitted the data reasonably well, CFI = 0.9, RMSEA = 0.06. More enthusiastic and more active patients had a better quality of life. Those who reflect lower perception of stigma had a better physical and mental health. Partial mediation effects of stigma between positive affect and mental health and between negative affect and physical health were found. The stigma is pervasive and causes consequences for psychological and physical health.
1. Introduction
Obesity is defined as a complex and multifactorial con-dition affected by interaction of genetic, metabolic, social,
behavioral, and cultural factors [1]. Obese people experience
impairments resulting in a significant impact on health and
contribute to reduced quality of life (QoL) [2,3]. An
individ-ual is considered obese if he/she has a BMI (Body Mass Index)
of 30 or more [4]. The interest in studying QoL in these obese
patients continues to grow [1]. QoL is a multidimensional
construct which is often measured as a subjective assessment
of different life domains [5]. The identification of a set of
simultaneous factors that contribute to a better quality of life can help to determine the comparative efficacy of different
treatments and to assess the impact of treatment on patients
everyday life [3]. Although, according to Vieira et al. [3], this
type of investigations has not been the focus of many prior research.
Fontaine and Cheskin [6], in their study, consider
dispo-sitional optimism as a predictor of weight loss. Dispodispo-sitional optimism defined as the expectation or belief in positive
outcomes in the future [7] has been shown to be associated
positively with physical well-being [8]. However, there are
few studies where the role of dispositional optimism in QoL in obese patients is studied. In the literature and in
consonance with Carr and colleagues [9] the impact of body
physical health on quality of life has been broadly docu-mented. Although the relation between physical function
Background (variables to control for)
Clinical variables Quality of life components
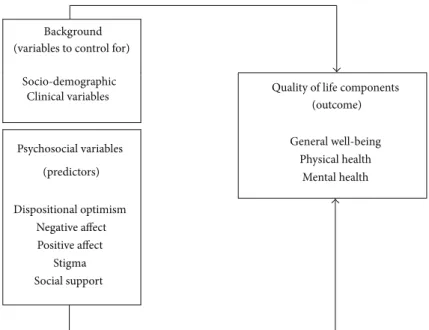
(outcome) Psychosocial variables (predictors) General well-being Physical health Mental health Dispositional optimism Negative affect Positive affect Stigma Social support Socio-demographic
Figure 1: Conceptual model of sociodemographic, clinical, and psychosocial factors influencing QoL.
limitation and negative affect has not been fully studied in obese people, studies suggest that other chronic physical conditions interfere in functioning of these patients, which in turn triggers negative affect. The authors refer that the obese people have personal characteristics that may affect their mood and contribute to poor health or interpersonal discrimination. Studies reveal that the impact of obesity on feelings and emotions is associated with changes in negative
affect rather than in positive affect [9, 10]. However, the
relationship between positive and negative affect with QoL
remains unclear [10]. According to Wiczinski and colleagues
[11] obesity has been shown to be associated with a reduced
QoL. These authors also refer that social support may play an important role in QoL. They found that social support was associated with mental and physical QoL components.
However, Andenaes and colleagues [2] refer that social
support has rarely been studied in obese people.
For obese people, the stigma is generalized and repre-sents numerous consequences for their psychological and
physical health [12]. These persons are highly susceptible
to institutional and interpersonal discrimination, teasing
and, problematic relationships with family members [9,10].
According to Ogden and Clementi [13] obesity influences not
only individuals health but also their psychological state. In obese people with appropriate support, stigma may present the sufficient triggers to encourage the changes which are necessary for weight loss and improve their QoL.
Although these psychosocial factors identified as predic-tors of QOL are linked and not easily separated, often they have been analysed individually. There is a lack of studies that analyse the simultaneous association between psychosocial predictors and QOL. Then, it will be relevant to examine the simultaneous impact of them on QOL.
The aim of the present study was to evaluate the simul-taneous impact of dispositional optimism, positive and nega-tive affect, stigma, and social support factors on quality of life,
in Portuguese obese patients. To explore the complexity of the relationship between variables we use structural equation model (SEM) that “is the only analysis that allows complete
and simultaneous tests of all the relationships” [14, page 679].
We have constructed a model (Figure 1) in which we
described the influence of psychosocial variables on QoL, controlling for socio-demographic and clinical variables. We hypothesized that psychosocial variables have a simultaneous impact on QoL. It was suggested that the negative effect of stigma is dependent in part on the internal perceptions, beliefs, and emotions of the stigmatized person, above and
beyond the effects of direct discrimination by others [15].
Then we hypothesized that stigma exerts a mediator effect between positive/negative affect and QoL components.
2. Methods
2.1. Sample. This cross-sectional study used a sequential
sample of 215 volunteer obese patients. These patients were approached directly by their physicians during the consul-tation in outpatient departments of four central Portuguese Hospitals (a hospital located in the central coast of Portugal, Lisbon, and four on the north coast, Oporto). All patients agree to collaborate with the help of 5 physicians. Inclusion criteria are as follows: (1) diagnosis of obesity, disease
diag-nosed at least 3 years prior to the study; (2) age≥ 17 years
at the time of the interview; (3) educational level higher than 6 years; (4) to return to usual daily life with disease under control; (5) no cognitive disturbances. Prior to data collection, ethical approval for this study was obtained from the institutions’ ethical committees. After a description of the study aims and the participant rights, all patients who met the inclusion criteria agreed to participate.
2.2. Measures. Obese patients completed self-report
and quality of life variables. Psychologists were responsible for data collection after medical appointment. They were trained in the protocol used.
2.2.1. Sociodemographic and Clinical Variables. Data
regard-ing age, sex, education, severity of disease perception (“gen-erally, how do you classify your illness?” coded using an increasing scale from 1: nothing serious to 11: very serious), and time since obesity diagnosis were analised. Severity of
disease was assessed with an anchoring vignette scale [16]
following the recommendations of Sen [17] and the Eurostat
statistics report practices. The scale is similar to the pain
severity scale [18].
2.2.2. Psychosocial Variables
(1) Dispositional Optimism. Dispositional optimism was
eval-uated with the Life Orientation Test-Revised (LOT-R) [19].
The LOT-R was developed to assess individual differences in generalized optimism versus pessimism. The Portuguese
validated scale [20] showed similar characteristics to the
original version. It consists of ten statements, in which three items reflect expectations for positive outcomes, three for negative outcomes, and four are filter items. The optimism score was calculated by adding the three optimism questions value and the pessimism score was calculated by adding the three pessimism questions value. The overall LOT-R score was calculated by reverse scoring the three pessimism scores and summing responses to all six questions. Higher scores indicate greater optimism. The Portuguese version shows a
Cronbach𝛼 of 0.71.
(2) Positive Affect and Negative Affect. To assess positive
affect (PA) and negative affect (NA), the validated Portuguese
version [21] of the Positive and Negative Affect Schedule
(PANAS) scale, constructed by Watson et al. [22], was
administered. It consists of twenty statements, in which ten items reflect expectations for PA and ten for NA. Items were averaged to obtain scale scores, and higher scores of PA indicate more positive affect or the extent to which the individual feels enthusiastic, active, and alert. A higher score of NA indicates more negative affect, which reflects the individual aversive mood states and general distress. The
authors of PANAS calculated the Cronbach𝛼 coefficients in
different samples and found that they ranged from 0.90 to 0.96 for PA and from 0.84 to 0.87 for NA. Portuguese version shows similar characteristics to the original, with a Cronbach 𝛼 of 0.86 for the positive affect and 0.89 for the negative affect scales.
(3) Stigma. Self-perception of stigma was assessed using a
five-item one-dimensional questionnaire, answered in a likert type scale with seven alternatives between totally agree and
totally disagree, developed by Pais-Ribeiro et al. [23]. Higher
scores reflect lower perception of stigma. For the five items
Cronbach𝛼 shows a value of 0.82.
(4) Social Support. Social support was assessed with the Social
Support Survey (MOS) [24,25]. This is a multidimensional
self-questionnaire, adapted to the Portuguese population, that evaluates various dimensions of social support. The MOS consists of four separate social support subscales: emotional/informational, tangible, affectionate, and positive social interaction. An overall functional social support index is also used. All subscales have shown strong reliability over
time with a Cronbach𝛼 higher than 0.91.
2.2.3. Outcome Variables
(1) Quality of Life. The 36-item Short-Form Health Survey
(SF-36) [26], developed for the MOS study, was used and
divided into eight dimensions that represent two major components: the physical and the mental components of health. In this study, we used the results from the IQOLA
project [27], in which a second-order factor was found,
with three components of SF-36 (general well-being—GWB, physical health—PH, and mental health—MH). All scales and the component scores are positively scored so that higher scores represent better health-related QoL. The Portuguese
version of the MOS SF-36 [28, 29] shows a Cronbach𝛼 of
0.70.
2.3. Statistical Analysis. Descriptive statistics were used to
describe sociodemographic and clinical characteristics of the sample.
2.3.1. Structural Equation Modeling (SEM). Structural
equa-tion modeling (SEM) was used to test the conceptual model to evaluate the simultaneous impact of dispositional optimism, positive and negative affect, stigma, and social support factors on quality of life. SEM is a multivariate technique that allows for representing, estimating and testing theoretical models that involve several relationships between variables (observed and latent), in order to understand the patterns
of correlation/covariance between them [14]. Latent variables
are not directly observed, generally they correspond to hypothetical constructs or factors which are explanatory variables presumed to reflect a continuum that is not directly
observable [14,30]. SEM is a combination of factor and path
analyses, corresponding to the measurement and structural models, respectively. First, we applied confirmatory factor analysis (CFA) (measurement model) in order to assess whether all the latent variables were represented by their respective indicators (observed variables). The structural model indicates the direct and indirect effects of latent and observed variables (which are not indicators of latent variables). Before estimating the hypothesized model the distribution of continuous variables was analised to assess significant departure from normality. To account for the nonnormality of the data the robust maximum likelihood
estimation procedure was used [31]. The adequacy of the
model was assessed according to goodness of fit indexes. The Satorra-Bentler Scale chi-square test was used as an index of discrepancy between the original correlation matrix and
the correlation matrix estimated from the model [32]. A
nonsignificant𝑃 value (𝑃 > 0.05) and the ratio (𝑆−𝐵𝜒2)/𝑑𝑓 <
Age Sch SDP TSD Sex Stg NA PA GWB PH MH GH VH PF PP CP EP SF MF Significant (𝛼=5%) No significant 0.6 87 0.87 1 0.914 0.767 0.811 d1 0.6 47 0.6 56 0.5 07 0.7 20 0.524 0.566 0.443 0.672 0.605 0.702 −0.3 19 0.7 01 0.84 0 0.7 43 0.811 0.7 33 0.6 15 0.7 51 0.84 8 0.340 /0.04 9 ∗ 0.23 3 0.528 ∗Indirect effect 0.602 0.723 0.525 0.617 0.798 0.570 0.7 00 0.7 28 0.6 03 0.7 21 −0.248 0.192 0.182 0.25 2 − 0.3 27 0.24 5 0.13 8 −0.577 d4 d5 d6 −0.27 5/−0.06 7∗ − 0.27 4 Q1DC Q2DC Q3DC Q4DC Q5DC Q2SF Q4SF Q6SF Q7SF Q9SF Q12SF Q14SF Q16SF Q18SF Q20SF e1DC e2DC e3DC e4DC e5DC e2SF e4SF e6SF e7SF e9SF e12SF e14SF e16SF e18SF e20SF Q1SF Q3SF Q5SF Q8SF Q10SF Q11SF Q13SF Q15SF Q17SF Q19SF e2SF e3SF e5SF e8SF e10SF e11SF e13SF e15SF e17SF e19SF e3MH e1GH e2VH e1PH e2PH e3PH e1MH e2MH
Figure 2: Standardized estimates: Structural Equation Model. Age: age; Sch: education; SDP: severity of disease perception; TSD: time since diagnosis; Sex: sex; Stg: stigma; NA: negative affect; PA: positive affect; GWB: general well-being; PH: physical health; MH: mental health.
a chi-square test is dependent on the number of subjects, other goodness-of-fit indexes were also used. Comparative Fit Index (CFI), with maximum value 1.00, is derived from the comparison of the hypothesized model with the independent
model; a value of CFI> 0.90 suggests a close fit [33]; Root
Mean Square Error Approximation (RMSEA) [34] values
help to answer the question of how well the model would fit the population covariance matrix if it were available; values less than 0.05 indicate a good fit, being acceptable values
until 0.08 [14, 30, 35–37]. Based on multivariate Lagrange
Multiplier (LM) tests, post-hoc modifications to the proposed model were made to add new paths as necessary. To compare two or more models the Akaike Information Criterion (AIC)
[38] was used, with smaller values representing better model
fit. The significance of all direct and indirect effects was evaluated to determine which variables have a direct and
indirect impact on QoL. The R2 values were calculated for
all predictors, mediators, and outcome variables to determine
the proportion of explained variance in outcome [30].
In Figure 2rectangles represent observed variables and circles represent latent variables; the error terms of observed
variables are represented by𝑒 and of latent variables are
rep-resented by𝑑 (disturbances); single-headed arrows represent
the influence of one variable in another, and double-headed arrows represent associations between pairs of variables.
Analyses were conducted with the EQS 6.1 [39] package and
a level of significance of 0.05 was considered.
The observed and latent variables evaluated are
summa-rized inTable 1.
2.3.2. Mediation Analysis. The possible mediation of stigma
between positive/negative affect and QoL components was assessed based on the traditional method proposed by Baron
and Kenny [40]. A mediating variable transmits the effect
of an independent variable on a dependent variable [40,41].
The analysis of this effect requires several steps: (1) positive (negative) affect is a predictor of a QoL component, (2) a positive (negative) affect is a predictor of stigma, (3) control-ling for stigma, the relationship between a positive (negative) affect and a QoL component should reduce or cease to be statistically significant. If it fails to be statistically significant,
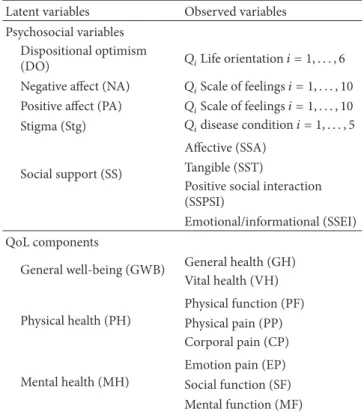
Table 1: Observed and latent variables in the assessment of quality of life of obese people.
Latent variables Observed variables
Psychosocial variables Dispositional optimism
(DO) 𝑄𝑖Life orientation𝑖 = 1, . . . , 6
Negative affect (NA) 𝑄𝑖Scale of feelings𝑖 = 1, . . . , 10
Positive affect (PA) 𝑄𝑖Scale of feelings𝑖 = 1, . . . , 10
Stigma (Stg) 𝑄𝑖disease condition𝑖 = 1, . . . , 5
Social support (SS)
Affective (SSA) Tangible (SST)
Positive social interaction (SSPSI)
Emotional/informational (SSEI) QoL components
General well-being (GWB) General health (GH)
Vital health (VH) Physical health (PH) Physical function (PF) Physical pain (PP) Corporal pain (CP) Mental health (MH)
Emotion pain (EP) Social function (SF) Mental function (MF)
then we have a full mediation model (i.e., mediator explains completely the relationship between a psychosocial variable and QoL component). However, if the relationship between a positive (negative) affect and QoL component decreases significantly, we have a partial mediation. Significance of the mediation is based on the indirect effect. The indirect
effect may be estimated in two ways, either ̂𝑎 ⋅ ̂𝑏 or ̂𝑐 − ̂𝑐,
where𝑐 is the regression coefficient of the model regressing
the QoL component on positive (negative) affect 𝑎 is the
regression coefficient relating positive (negative) affect and
stigma,𝑏 is the regression coefficient relating stigma and the
QoL component adjusted for positive (negative) affect, and𝑐
is the coefficient relating positive (negative) affect and QoL component but now adjusted for stigma. The value of the mediated or indirect effect estimated by taking the difference
in the coefficients,̂𝑐− ̂𝑐, corresponds to the reduction in the
independent variable (positive/negative affect) effect on the dependent variable (QoL components) when adjusted for the mediator (stigma). To test for significance, the difference is then divided by the standard error of the difference and the
ratio is compared to a standard normal distribution [41].
3. Results
3.1. Sample Characteristics. The mean age of patients was
42.98 years (sd = 11.3) and 86.5% were female. Mean level education was 8.17 years (sd = 4.19), mean time since diagnosis was 11 years (sd = 9.5), and mean perception of severity of disease was 7.31 (sd = 2.69).
3.2. Analysis. First, the individual impact of each
psychoso-cial factor in QoL components, controlling for sociode-mographic and clinic variables, was analised. Then, the simultaneous impact of dispositional optimism, positive and negative affect, stigma and social support factors on QoL components was analysed, evaluating the hypothetical model postulated in the aim of the study.
Tables2and3show the results obtained for the
measure-ment and structural models, for the first analysis where each psychosocial factor was independently analysed.
For all psychosocial factors, the results suggest a satis-factory model fit. All factor loadings between each indicator and latent variables were statistically significant, indicating that all were well represented by their respective indicators. The proportion of explained variance for each indicator was moderate to high.
The structural modelfit statistics indicate an acceptable
model fit for all psychosocial factors (Table 3). Controlling
for sociodemographic and clinical variables, all factors had a statistically significant impact on the components of QoL. Models results showed that an optimist attitude, a good social support, a lower perception of stigma, and more positive affect contribute to better general well-being and better physical and mental health. Just the negative affect behaves like a negative predictor of QoL.
The following results refer to the model where the simul-taneous impact of psychosocial variables on quality of life was considered.
Measurement model include eight latent variables (dispo-sitional optimism, negative and positive affect, stigma, social support, general well-being, and physical and mental health) and 43 observed variables referring to the corresponding indicators of the eight latent variables. The results showed
a satisfactory model fit:𝑆 − 𝐵𝜒2
832 = 1271.8896,𝑃 < 0.001;
(𝑆−𝐵𝜒2)/𝑑𝑓 = 1.52; CIF = 0.90; RMSEA = 0.054, RMSEA (90%
IC) = (0.04; 0.06). All factor loadings between each indicator and latent variables were statistically significant, indicating that all were well represented by their respective indicators. The proportion of explained variance for each indicator was
also moderate to high (𝑅2values ranging from 0.22 to 0.87).
According to the objective of this research, our main model analyse the simultaneous impact of dispositional optimism, positive and negative affect, stigma, and social support on QoL controlling for sociodemographic and clinical variables. The mediation effect of stigma between positive/negative affect and the QoL components was also examined (model 1).
However, the social support and dispositional optimism were found not to be statistically significant and were sub-sequently removed from the model, corresponding to model 2 and model 3, respectively. Results of overall model fit and of the comparison between the three models are shown in
Table 4.
The results show that fit indexes are comparable in the three models, although in the model 1 and model 2 the CFI values were in the borderline. Based on the Akaike Information Criterion (AIC) we chose to present model 3.
Table 2: Goodness-of-fit test for measurement model. Measurement model
Predictor variable 𝑆 − 𝐵𝜒2 df 𝑃 (𝑆 − 𝐵𝜒2)/df CFI RMSEA (90% IC)
Optimism 144.0097 71 <0.001 2.03 0.936 0.071 (0.05, 0.08)
Social support 101.3522 48 <0.001 2.11 0.959 0.074 (0.05, 0.09)
Stigma 145.8685 59 <0.001 2.47 0.949 0.085 (0.06, 0.10)
Positive affect 191.4264 129 <0.001 1.48 0.958 0.050 (0.03, 0.06)
Negative affect 270.2263 129 <0.001 2.09 0.913 0.075 (0.06, 0.08)
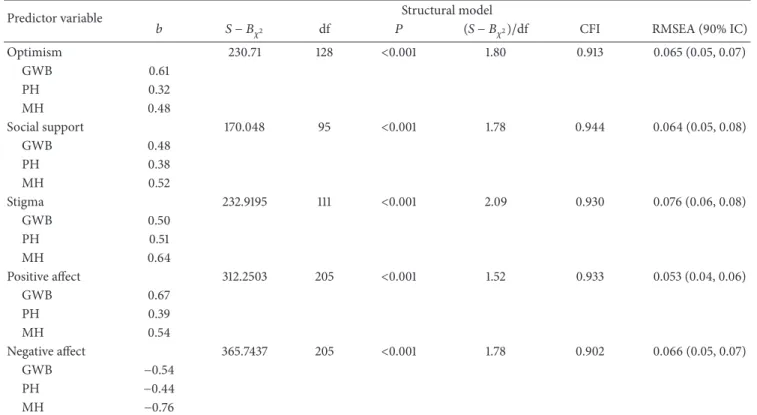
Table 3: Goodness-of-fit test for structural model.
Predictor variable Structural model
𝑏 𝑆 − 𝐵𝜒2 df 𝑃 (𝑆 − 𝐵𝜒2)/df CFI RMSEA (90% IC)
Optimism 230.71 128 <0.001 1.80 0.913 0.065 (0.05, 0.07) GWB 0.61 PH 0.32 MH 0.48 Social support 170.048 95 <0.001 1.78 0.944 0.064 (0.05, 0.08) GWB 0.48 PH 0.38 MH 0.52 Stigma 232.9195 111 <0.001 2.09 0.930 0.076 (0.06, 0.08) GWB 0.50 PH 0.51 MH 0.64 Positive affect 312.2503 205 <0.001 1.52 0.933 0.053 (0.04, 0.06) GWB 0.67 PH 0.39 MH 0.54 Negative affect 365.7437 205 <0.001 1.78 0.902 0.066 (0.05, 0.07) GWB −0.54 PH −0.44 MH −0.76
Table 4: Structural equations models and model fit indexes. Model fit indexes
Model 𝑆 − 𝐵𝜒2 df 𝑃 (𝑆 − 𝐵𝜒2)/df CFI RMSEA (90% IC) AIC
1 1719.94 1039 <0.001 1.65 0.83 0.062 (0.057, 0.067) 2755.13
2 1453.50 864 <0.001 1.68 0.83 0.063 (0.057, 0.069) 2491.79
3 1006.34 629 <0.001 1.59 0.90 0.059 (0.052, 0.065) 2375.35
The results (Figure 2) showed that age has a negative
impact (𝑏 = −0.327) and school grade has a statistically significant positive impact (𝑏 = 0.182) on physical health. The severity of disease perception influences statistically and positively the mental health (𝑏 = 0.138). A simultaneous direct and positive impact between stigma and physical (𝑏 = 0.245) and mental health (𝑏 = 0.252) was found. Positive affect had a statistically and positively significant impact on the components of QoL: general well-being (𝑏 = 0.528), physical health (𝑏 = 0.233), and mental health (𝑏 = 0.340). Negative affect had also an impact, but statistically negative,
on general well-being(𝑏 = −0.319), physical health (𝑏 =
−0.275), and mental health (𝑏 = −0.577).
Mediation analyses were evaluated testing the signifi-cance of the indirect effect between predictors and QoL
com-ponents [42]. The results showed two statistically significant
indirect effects, one meaning that stigma exerts a partial mediation between positive affect and mental health (̂𝑎̂𝑏 = 0.05, 𝑃 < 0.05) and the other that stigma exerts a partial
mediation between negative affect and physical health (̂𝑎̂𝑏 =
4. Discussion
The prevalence of obesity is increasing rapidly and becomes a
major public health problem in many countries [2]. Portugal
is not an exception. The prevalence in Portugal is 15.1%, lower
than that reported in the USA (35.9%) [43]. Several successful
weight reduction programs have been implemented in
Portu-gal [44,45].
Our study is concentrated on psychosocial predictors of QoL, which are related and not easily separated. There is a lack of studies that have examined the simultaneous associations between psychosocial predictors and quality of life outcomes. Our study contributes to the reduction of this fact and to better understand the role of psychosocial variables in the quality of life.
The factors identified as predictors of QoL could be helpful for health care and improving the measurement of treatment efficacy and help to assess and compare the efficacy of different treatments. These findings can help to assess the impact on how patients feel and function in their everyday
life [1].
Despite the strengths of this study, it is important to note some of its limitations. The cross-sectional design does not allow any conclusions on the longitudinal evaluation of these patients.
Furthermore, this is a hospital-based study and patients attending primary health care units are underrepresented. Although our findings constitute a relevant contribution, further studies are needed to better address the topic of QoL in obese patients.
The primary goal of this study was to identify the psy-chosocial predictors of QoL in a Portuguese obese patients. To briefly summarize our findings, controlling for sociode-mographic and clinical variables, we found that positive and negative affect and the stigma factors were relevant predictors of QoL.
In this study, first the individual impact of dispositional optimism, positive and negative affect, stigma, and social support factors on QoL components was analysed, in order to compare our findings with those from other studies with similar approaches. The results are consistent with the
literature [2,8–10], showing that a more optimistic attitude, a
better positive affect, a lower perception of stigma or a better social support contribute to general to a better QoL.
However the principal goal of the study was to take into account simultaneous psychosocial variables, with the aim to clarify their simultaneous impact on QoL. The dispositional optimism and the social support have been referred as important factors in the life of obese individuals. In this study their impacts on QoL cease to be significant in presence of positive and negative affect and stigma factors.
Research from Pasco et al. [46] and Carr et al. [47] shows
that obese persons have significantly higher levels of negative
affect than their thinner peers. Also a systematic review [48]
shows that a quarter of the population in Germany displayed definite stigmatizing attitudes about obesity. Similar results
were found by Sutin and Terracciano [49] about negative
attitudes toward obese people in the American society resulting in poorer mental health outcomes and that weight
discrimination increases risk for obesity. In concordance with these findings our study suggests that negative attitudes toward obese people or stigma can result in poor health outcomes.
Puhl and Heuer [50] report that stigma and
discrimina-tion toward obese persons are pervasive and pose numerous consequences for their psychological and physical health.
Similarly, Schafer and Ferraro [51] reported that obesity is
widely recognized as a health risk, representing a disadvan-taged social position. They also refer that perceived weight discrimination is harmful and increases the health risks of
obesity. Puhl et al. [52], also show that the language used
by health professionals expresses negative attitudes toward overweight and obese people, and has negative impacts on obese people.
This study reveals that positive affect has a statistically significant and positive impact on all components of QoL. More enthusiastic and active people have a better subjective well-being and a better physical and a better mental health. Negative affect behaves like a negative predictor of physical and mental health. Aversive mood states contribute to a poor
QoL. Other researches [9,10] support that the positive and
negative affect reveal that obese patients are more likely to have negative affect and have more negative feelings such as distress, anger, fear, and shame.
Obese people with lower perception of stigma have a better quality of life, in physical and mental domains.
Varta-nian and Smyth [53] refer that several antiobesity campaigns
appear to embrace stigmatization of obese individuals as a public health strategy. Those campaigns are based in the idea that stigmatizing obese individuals will motivate them to change their behavior and will also result in successful
behav-ior changes. Puhl and Heuer [12] refer that stigmatization
of obese patients represents serious risks to physical health. Stigma seems to have potential costs and benefits in obesity.
The results of this study also showed the relation between negative affect and physical health where mediated by stigma, as well as the relation between positive affect and mental health. These results support the importance of the stigma in QoL of these patients.
The use of SEM allows us to understand the complexity of the simultaneous relationships between the variables we use. The study suggests that all the variables are important but when taken together they can have different levels of importance for the explanation of the results.
Conflict of Interests
The authors declare that there is no conflict of interests regarding the publication of this paper.
Acknowledgments
The authors would like to thank all patients and their doctors for their participation in the study. This study was supported by a Grant from the Fundac¸˜ao para a Ciˆencia e Tecnologia (PTDC/PSI/71635/2006).
References
[1] R. L. Kolotkin, K. Meter, and G. R. Williams, “Quality of life and obesity,” Obesity Reviews, vol. 2, no. 4, pp. 219–229, 2001. [2] R. Andenaes, M. S. Fagermoen, H. Eide, and A. Lerdal,
“Changes in health-related quality of life in people with morbid obesity attending a learning and mastery course. A longitudinal study with 12-months follow-up,” Health and Quality of Life
Outcomes, vol. 10, p. 95, 2012.
[3] P. N. Vieira, J. Mata, M. N. Silva et al., “Predictors of psycholog-ical well-being during behavioral obesity treatment in women,”
Journal of Obesity, vol. 2011, Article ID 936153, 8 pages, 2011.
[4] World Health Organization (WHO), http://www.who.int/
mediacentre/factsheets/fs311/en.
[5] P. A. Parker, W. F. Baile, C. de Moor, and L. Cohen, “Psychosocial and demographic predictors of quality of life in a large sample of cancer patients,” Psycho-Oncology, vol. 12, no. 2, pp. 183–193, 2003.
[6] K. R. Fontaine and L. J. Cheskin, “Optimism and obesity treat-ment outcomes,” Journal of Clinical Psychology, vol. 55, no. 1, pp. 141–143, 1999.
[7] M. F. Scheier and C. S. Carver, “Dispositional optimism and physical well-being: the influence of generalized outcome expectancies on health,” Journal of Personality, vol. 55, no. 2, pp. 169–210, 1987.
[8] M. F. Scheier and C. S. Carver, “Effects of optimism on psycho-logical and physical well-being: theoretical overview and empir-ical update,” Cognitive Therapy and Research, vol. 16, no. 2, pp. 201–228, 1992.
[9] D. Carr, M. A. Friedman, and K. Jaffe, “Understanding the relationship between obesity and positive and negative affect: the role of psychosocial mechanisms,” Body Image, vol. 4, no. 2, pp. 165–177, 2007.
[10] J. A. Pasco, L. J. Williams, F. N. Jacka, S. L. Brennan, and M. Berk, “Obesity and the relationship with positive and negative affect,” Australian & New Zealand Journal of Psychiatry, vol. 47, no. 5, pp. 477–482, 2013.
[11] E. Wiczinski, A. D¨oring, J. John, and T. von Lengerke, “Obesity and health-related quality of life: does social support moderate existing associations?” British Journal of Health Psychology, vol. 14, no. 4, pp. 717–734, 2009.
[12] R. M. Puhl and C. A. Heuer, “Obesity stigma: important consid-erations for public health,” American Journal of Public Health, vol. 100, no. 6, pp. 1019–1028, 2010.
[13] J. Ogden and C. Clementi, “The experience of being obese and the many consequences of stigma,” Journal of Obesity, vol. 2010, Article ID 429098, 9 pages, 2010.
[14] B. Tabachnick and L. Fidell, Using Multivariate Statistics, HarperCollins College, New York, NY, USA, 1996.
[15] J. Chronister, C. C. Chou, and H. Y. Liao, “The role of stigma coping and social support in mediating the effect of societal stigma on internalized stigma, mental health recovery, and quality of life among people with serious mental illness,” Journal
of Community Psychology, vol. 41, no. 5, pp. 582–600, 2013.
[16] A. van Soest, L. Delaney, C. Harmon, A. Kapteyn, and J. P. Smith, “Validating the use of anchoring vignettes for the correction of response scale differences in subjective questions,”
Journal of the Royal Statistical Society A, vol. 174, no. 3, pp. 575–
595, 2011.
[17] A. Sen, “Health: perception versus observation. Self reported morbidity has severe limitations and can be extremely mislead-ing,” British Medical Journal, vol. 324, no. 7342, pp. 860–861, 2002.
[18] M. A. Ferreira-Valente, J. L. Pais-Ribeiro, and M. P. Jensen, “Validity of four pain intensity rating scales,” Pain, vol. 152, no. 10, pp. 2399–2404, 2011.
[19] M. F. Scheier, C. S. Carver, and M. W. Bridges, “Distinguishing optimism from neuroticism (and trait anxiety, self-mastery, and self-esteem): a reevaluation of the life orientation test,” Journal
of Personality and Social Psychology, vol. 67, no. 6, pp. 1063–1078,
1994.
[20] J. Pais Ribeiro and L. Pedro, “Contribuic¸˜ao para a an´alise psicom´etrica e estrutural da escala revista de avaliac¸˜ao do optimismo (escala de orientac¸˜ao para a vida revista-EOR-R) em doentes com esclerose m´ultipla,” in Actas do 6ºCongresso
Nacional de Psicologia da Sa´ude, I. Leal, J. Pais Ribeiro, and S.
Neves, Eds., pp. 133–139, 2006.
[21] I. C. Galinha and J. L. Pais Ribeiro, “Contribuic¸˜ao para o estudo da vers˜ao portuguesa da Positive and Negative Affect Schedule (PANAS): II—estudo psicom´etrico,” An´alise Psicol´ogica, vol. 2, no. 23, pp. 219–229, 2005.
[22] D. Watson, L. A. Clark, and A. Tellegen, “Development and validation of brief measures of positive and negative affect: the PANAS scales,” Journal of Personality and Social Psychology, vol. 54, no. 6, pp. 1063–1070, 1988.
[23] J. Pais-Ribeiro, I. Silva, M. Abreu, N. Costa, H. Cardoso, and C. Venˆancio, “Stigma and quality of life of obese women— preliminary study,” The European Journal of Obesity, vol. 2, supplement 2, pp. 244–244, 2009.
[24] A. C. Ponte and J. Pais Ribeiro, “Estudo preliminar das pro-priedades m´etricas do mos social support survey,” in Actas do
7ºCongresso Nacional de Psicologia da sa´ude, J.P.R. Lisboa: ISPA,
I. Leal, I. Silva, and Marques, Eds., pp. 53–56, 2008.
[25] J. Pais-Ribeiro and A. C. Ponte, “Propriedades m´etricas da vers˜ao portuguesa da escala de suporte social do MOS, (MOS Social Support Survey) com idosos,” Psicologia, Sa´ude &
Doenc¸as, vol. 10, no. 2, pp. 163–174, 2009.
[26] J. E. Ware, K. K. Snow, M. Kosinski, and B. Gandek, SF-36 Health
Survey: Manual and Interpretation Guide, The Health Institute.
New England Medical Center, Boston, Mass, USA, 1993. [27] S. D. Keller, J. E. Ware Jr., P. M. Bentler et al., “Use of structural
equation modeling to test the construct validity of the SF-36 Health Survey in ten countries: results from the IQOLA project,” Journal of Clinical Epidemiology, vol. 51, no. 11, pp. 1179– 1188, 1998.
[28] P. Ferreira, “Criac¸˜ao da vers˜ao portuguesa do MOS SF-36: parte I—adaptac¸˜ao cultural e lingu´ıstica,” Acta M´edica Portuguesa, vol. 13, pp. 55–66, 2000.
[29] P. Ferreira, “Criac¸˜ao da vers˜ao portuguesa do MOS SF-36: parte II—testes de validade,” Acta M´edica Portuguesa, vol. 13, pp. 55– 66, 2000.
[30] R. B. Kline, Principles and Practice of Structural Equation
Modeling, The Guilford Press, New York, NY, USA, 2011.
[31] A. Satorra and P. M. Bentler, “Corrections to test statistics and standard errors in covariance struture analysis,” in Latent
Variables Analysis: Apllications for Development Research, A.
von Eye and C. C. Clogg, Eds., vol. 419, Sage, Thousand Oaks, Calif, USA, 1994.
[32] L.-T. Hu and P. M. Bentler, “Cutoff criteria for fit indexes in covariance structure analysis: conventional criteria versus new
alternatives,” Structural Equation Modeling, vol. 6, no. 1, pp. 1– 55, 1999.
[33] P. M. Bentler, “Comparative fit indexes in structural models,”
Psychological Bulletin, vol. 107, no. 2, pp. 238–246, 1990.
[34] R. H. Hoyle, “The structural equation modeling approach: basic concepts and fundamental issues,” in Structural Equation
Modeling, Concepts, Issues and Applications, R. H. Holy, Ed., pp.
1–15, Sage, Thousand Oaks, Calif, USA, 1995.
[35] B. M. Byrne, Structural Equation Modeling with EQS: Basic
Concepts, Applications and Programming, Lawrence Erlbaum
Associates, 2006.
[36] R. C. MacCallum and J. T. Austin, “Applications of structural equation modeling in psychological research,” Annual Review
of Psychology, vol. 51, pp. 201–226, 2000.
[37] D. W. Russell, J. H. Kahn, R. Spoth, and E. M. Altmaier, “Analyzing data from experimental studies: a latent variable structural equation modeling approach,” Journal of Counseling
Psychology, vol. 45, no. 1, pp. 18–29, 1998.
[38] H. Akaike, “Factor analysis and AIC,” Psychometrika, vol. 52, no. 3, pp. 317–332, 1987.
[39] P. M. Bentler, EQS 6 Structural Equations Program Manual, Multivariate Software, Encino, Calif, USA, 2006.
[40] R. M. Baron and D. A. Kenny, “The moderator-mediator vari-able distinction in social psychological research. Conceptual, strategic, and statistical considerations,” Journal of Personality
and Social Psychology, vol. 51, no. 6, pp. 1173–1182, 1986.
[41] D. P. MacKinnon, A. J. Fairchild, and M. S. Fritz, “Mediation analysis,” Annual Review of Psychology, vol. 58, pp. 593–614, 2007.
[42] K. J. Preacher and K. Kelley, “Effect size measures for mediation models: quantitative strategies for communicating indirect effects,” Psychological Methods, vol. 16, no. 2, pp. 93–115, 2011. [43] OECD, OECD Factbook 2013: Economic, Environmental and
Social Statistics, OECD Publishing, 2013.
[44] M. N. Silva, D. Markland, E. V. CarraC¸ a et al., “Exercise
autonomous motivation predicts 3-yr weight loss in women,”
Medicine and Science in Sports and Exercise, vol. 43, no. 4, pp.
728–737, 2011.
[45] P. Teixeira, S. B. Going, L. B. Houtkooper et al., “Weight loss readiness in middle-aged women: psychosocial predictors of success for behavioral weight reduction,” Journal of Behavioral
Medicine, vol. 25, no. 6, pp. 499–523, 2002.
[46] J. Pasco, L. Williams, F. Jacka, S. Brennan, and M. Berk, “Obesity and the relationship with positive and negative affect,” The
Australian and New Zeland Journal of Psychiatry, vol. 47, no. 5,
pp. 477–482, 2013.
[47] D. Carr, M. A. Friedman, and K. Jaffe, “Understanding the relationship between obesity and positive and negative affect: the role of psychosocial mechanisms,” Body Image, vol. 4, no. 2, pp. 165–177, 2007.
[48] C. Sikorski, M. Luppa, M. Kaiser et al., “The stigma of obesity in the general public and its implications for public health—a systematic review,” BMC Public Health, vol. 11, article 661, 2011. [49] A. Sutin and A. Terracciano, “Perceived weight discrimination and obesity,” PLoS ONE, vol. 8, no. 7, Article ID e70048, 2013. [50] R. M. Puhl and C. A. Heuer, “Obesity stigma: important
considerations for public health,” American Journal of Public
Health, vol. 100, no. 6, pp. 1019–1028, 2010.
[51] M. H. Schafer and K. F. Ferraro, “The stigma of obesity: does perceived weight scrimination affect identity and physical
health?” Social Psychology Quarterly, vol. 74, no. 1, pp. 76–97, 2011.
[52] R. Puhl, J. L. Peterson, and J. Luedicke, “Motivating or stigma-tizing? public perceptions of weight-related language used by health providers,” International Journal of Obesity, vol. 37, no. 4, pp. 612–619, 2012.
[53] L. R. Vartanian and J. M. Smyth, “Primum non nocere: obesity stigma and public health,” Bioethical Inquiry, vol. 10, pp. 49–57, 2013.
Submit your manuscripts at
http://www.hindawi.com
Stem Cells
International
Hindawi Publishing Corporationhttp://www.hindawi.com Volume 2014
Hindawi Publishing Corporation
http://www.hindawi.com Volume 2014 INFLAMMATION
Hindawi Publishing Corporation
http://www.hindawi.com Volume 2014
Behavioural
Neurology
Endocrinology
International Journal of Hindawi Publishing Corporationhttp://www.hindawi.com Volume 2014
Hindawi Publishing Corporation
http://www.hindawi.com Volume 2014
Disease Markers
Hindawi Publishing Corporation
http://www.hindawi.com Volume 2014 BioMed
Research International
Oncology
Journal of Hindawi Publishing Corporationhttp://www.hindawi.com Volume 2014
Hindawi Publishing Corporation
http://www.hindawi.com Volume 2014 Oxidative Medicine and Cellular Longevity Hindawi Publishing Corporation
http://www.hindawi.com Volume 2014
PPAR Research
The Scientific
World Journal
Hindawi Publishing Corporationhttp://www.hindawi.com Volume 2014
Immunology Research Hindawi Publishing Corporation
http://www.hindawi.com Volume 2014 Journal of
Obesity
Journal ofHindawi Publishing Corporation
http://www.hindawi.com Volume 2014
Hindawi Publishing Corporation
http://www.hindawi.com Volume 2014 Computational and Mathematical Methods in Medicine
Ophthalmology
Journal of Hindawi Publishing Corporationhttp://www.hindawi.com Volume 2014
Diabetes Research
Journal of Hindawi Publishing Corporationhttp://www.hindawi.com Volume 2014
Hindawi Publishing Corporation
http://www.hindawi.com Volume 2014
Research and Treatment
AIDS
Hindawi Publishing Corporation
http://www.hindawi.com Volume 2014
Gastroenterology Research and Practice
Hindawi Publishing Corporation
http://www.hindawi.com Volume 2014