Blood Pressure, Anthropometry and Adiposity in a
Paediatric Sample
SARA TAVARES NASCIMENTO
DISSERTAÇÃO DE CANDIDATURA AO GRAU DE MESTRE APRESENTADA À FACULDADE DE CIÊNCIAS DA NUTRIÇÃO E ALIMENTAÇÃO DA UNIVERSIDADE DO PORTO
Supervisor/Orientador: Prof. Doutora Carla Maria Barreto da Silva de Sousa Rêgo
Co-supervisor/Coorienrador: Prof. Doutor Bruno Miguel Paz Mendes Oliveira
À Avó Maria, à Avó Luísa, ao Avô António
iii
“To laugh often and much; to win the respect of intelligent people and the affection of children... to leave the world a better place... to know even one life has breathed easier because you have lived. This is to have succeeded.”
v Agradecimentos
A uma dissertação associa-se apenas um nome, apesar de, na maioria dos casos, sua construção depender do conhecimento e/ou trabalho de um conjunto de pessoas, sem os quais a mesma não seria possível. Como tal, esta dissertação tem o meu nome, mas a sua realização só foi possível devido ao apoio de um grupo de pessoas a quem gostaria de expressar o meu sincero agradecimento por todo o apoio dado.
À Prof. Doutora Carla Rêgo quero expressar o mais sentido reconhecimento e admiração. Obrigada por ter semeado em mim a paixão pela nutrição pediátrica e por ter partilhado comigo o seu conhecimento e a sua sabedoria. Estou grata por mais uma vez ter aceitado orientar-me e por ter conseguido sempre um espaço para mim na sua agenda tão cheia. Para mim, a Professora é, e será sempre um exemplo a seguir.
Ao Prof. Doutor Bruno Oliveira, gostaria de reconhecer a indispensável ajuda no tratamento estatístico e agradecer a sua disponibilidade, boa disposição e paciência. Obrigada por ter insistido, mesmo quando as coisas não pareciam correr bem e por me ter feito questionar todas as frases deste trabalho até não restarem quaisquer dúvidas.
Ao Dr. Emídio Carreiro, Diretor do Centro da Criança e do Adolescente do Hospital cuf Porto, agradeço ter-me permitido voltar a integrar este serviço onde sempre fui recebida com tanta simpatia.
Gostaria também de reconhecer o trabalho de recolha de dados, feito por todas as estagiárias de Ciências da Nutrição que passaram pelo Centro da Criança e do Adolescente do Hospital cuf Porto entre 2011 e 2013. Fazendo um agradecimento especial à Sara Ferreira e à Catarina Barros, que comigo deram os primeiros passos na nutrição pediátrica. Sem todas vocês este trabalho não seria possível.
À Marta Dias e à Rita Nogueira gostava de expressar o meu agradecimento pelo apoio e por terem possibilitado as minhas constantes trocas de horário, sem as quais a realização atempada desta dissertação seria impossível.
vi
Às minhas colegas de mestrado e amigas, Sara Muller, Ana Barros, Inês Machado, Isabel Nunes e Tâmara Andrade, um muito obrigada por todos os bons momentos que passamos juntas e por terem partilhado comigo as dificuldades deste percurso.
Aos meus pais, gostaria de expressar gratidão por nunca terem colocado entraves aos meus sonhos e pelo seu apoio discreto mas constante. Obrigada! Tudo o que sou hoje é o reflexo da vossa dedicação e do amor incondicional que me deram.
À minha família, obrigada por serem um porto de abrigo tão seguro. Obrigada pelos jantares de sábado que foram um compromisso social “obrigatório” e me fizeram desligar do resto. Aos meus primos, Bernardo, Rodrigo e Catarina, saibam que todos os vossos sonhos são possíveis com trabalho e dedicação. Aos meus amigos, obrigada pela motivação e por compreenderem (e perdoarem) as minhas ausências nos últimos meses. Prometo que agora vou por as amizades em dia.
Ao Pedro, agradeço por todo o carinho e dedicação. Obrigada por teres atenuado os momentos de tempestade e pela tua infinita paciência para os meus horários. Quando tudo parecia estar a correr mal transmitiste-me a tua calma tão característica, sem a qual tinha sido tudo mais difícil.
vii Abstract
Background: Hypertension prevalence in paediatric ages has risen exponentially in the last decades. Since it was suggested that this increase is concomitant to the rise of obesity prevalence, major importance have been given to research focusing on somatic indicators that may predict/diagnose this condition.
Objectives: To evaluate high blood pressure prevalence and its association with anthropometric and adiposity parameters in a paediatric sample.
Sample and methods: A sample of 214 children and adolescents (6 to 18 years old) followed in an outpatient clinic context by: health surveillance; overweight/obesity; sports guidance. This is a retrospective study, with blood pressure register being inclusion criteria. Height was measured whereas, weight, BMI and body composition were directly given by InBody® 230. Both waist circumference and blood pressure were also collected. Nutritional status and growth pattern were performed using WHO criteria as reference.
Results: A high prevalence of obesity (57.5%) was observed and 90.3% showed a WHtR above the cut off point indicating cardiometabolic risk. Blood pressure prevalence above 90th percentile was 45.8% and 25.3% of our sample showed high SBP and/or DBP. Only weak correlations were found between SBP and BMI z-score (R = 0.210), WHtR (R = 0.382) and %FM (R = 0.170) and between DBP and BMI z-score (R = 0.185) and %FM (R = 0.221). In the multivariate analysis only fat mass had a significant effect (medium effect size) on blood pressure.
Conclusions: Children and adolescents with increased BMI z-score, fat mass and WHTR are more susceptible to have high blood pressure. This effect appears to be more significant for SBP.
ix Resumo
Introdução: A prevalência de hipertensão arterial em idade pediátrica tem aumentado exponencialmente nas últimas décadas. A constatação de uma associação com o aumento da prevalência da obesidade aumentou o interesse relativo à identificação de marcadores somáticos que possam predizer/diagnosticar esta patologia.
Objetivos: Avaliar a prevalência de pressão arterial elevada e a sua associação com parâmetros antropométricos e de adiposidade numa amostra pediátrica. Amostra e métodos: Foram estudadas 214 crianças e adolescentes (6-18 anos) seguidas em consulta de pediatria por: vigilância de saúde; excesso de peso/obesidade; orientação medico-desportiva. Trata-se de um estudo retrospetivo, sendo critério de inclusão o registo da pressão arterial. Procedeu-se à recolha da altura, Procedeu-sendo o peso, o IMC e a composição corporal diretamente fornecidos pela InBody® 230. Procedeu-se ainda à recolha do perímetro da cinta, bem como da pressão arterial. A caracterização do estado nutricional usou como padrão de referência os critérios de referência da OMS. Resultados: Registou-se uma elevada prevalência de obesidade (57,5%) e 90,3% apresentou uma razão perímetro da cinta/altura indicadora de risco cardiometabólico. A prevalência de pressão arterial acima do percentil 90 foi de 45,8% e 25,3% da nossa amostra apresentou pressão arterial sistólica e/ou diastólica elevada. Observou-se uma correlação fraca entre a pressão arterial sistólica e o z-score do IMC (R = 0,210), o perímetro da cinta/altura (R = 0,382) e a percentagem de massa gorda (R = 0,170) e entre a pressão arterial diastólica e o z-score do IMC (R = 0,185) e a percentagem de massa gorda (R = 0,221). Na análise multivariada apenas a massa gorda apresentou um efeito significativo (efeito médio) na pressão arterial.
Conclusões: Crianças e adolescentes com valores aumentados de IMC, de massa gorda e da razão perímetro da cinta/altura são mais suscetíveis a expressar valores de pressão arterial elevada. Este efeito é superior para a pressão arterial sistólica.
xi Contents
List of Tables ... xiii
List of Abbreviations ... xv
Introduction... 1
Aim and Material and Methods ... 9
Results ... 15
Discussion and Conclusions ... 23
Final Considerations ... 31
xiii List of Tables
Table 1- General characterization of anthropometric parameters, BMI, body composition, blood pressure and physical activity (n = 214). ... 16 Table 2- Characterization of nutritional status using BMI z-score according to WHO criteria (n = 214). ... 16 Table 3- Characterization of WHtR according to risk of cardiometabolic comorbility (n = 144). ... 17 Table 4- Characterization of SBP and DBP according to the Forth Report reference (n = 214). ... 17 Table 5- Physical activity: distribution according to weekly performed practice (n=163). ... 18 Table 6- Characterization of family BMI and prevalence of overweight (WHO criteria). ... 18 Table 7- General characterization of age, anthropometric parameters, BMI, blood pressure, physical activity and Tanner stage according to gender. ... 19 Table 8- Correlation between %Pc90SBP with age, anthropometric parameters, BMI, body composition, physical activity and Tanner. ... 20 Table 9- Correlation between %Pc90DBP with age, anthropometric parameters, BMI, body composition, physical activity and Tanner. ... 21 Table 10- Measure of the effect size of sex, age, height and %FM on %Pc90SBP and %Pc90DBP. ... 21
xv List of Abbreviations
%Pc90: 90th percentile percentage
%Pc90DBP: Diastolic blood pressure 90th percentile percentage %Pc90SBP: Systolic blood pressure 90th percentile percentage BMI: Body mass index
BP: Blood pressure
DBP: Diastolic blood pressure
DEXA: Dual-energy X-ray Absorptiometry FM: Fat mass
MM: Muscle mass
NHBPEP: National High Blood Pressure Education Program Working Group on High Blood Pressure in Children and Adolescents
PA: Physical activity
SBP: Systolic blood pressure WC: Waist Circumference
WHO: World Health Organization WHtR: Waist-to-height ratio
1
2 Introduction
Overweight and obesity prevalence is increasing exponentially and affects the world population as a whole, including the paediatric age group [1]. Worldwide, approximately 10% of school aged children and adolescents suffer from overweight and obesity [2]. In Europe, overweight and obesity prevalence ranges from 10-36% [2]. Portugal follows this trend and is placed among the 5 European countries with higher childhood obesity prevalence (15.3% according to WHO reference) [3].
The global epidemics of childhood obesity is associated with significant changes in blood pressure (BP), resulting in what appears to be a concomitant increase in paediatric hypertension prevalence [4]. Nevertheless, hypertension is a complex and multifactorial pathology that results from the interaction between environmental, cultural, social and hereditary factors [5]. Although hypertension is less frequently diagnosed in children [6], the amount of juvenile cases is increasing greatly [7]. Furthermore, only recently the medical community stopped considering this disease exclusive to adulthood [8], reason why there is considerable lack of knowledge about its distribution in juvenile population. This is of major relevance, as longitudinal studies demonstrate that children with high blood pressure have a higher tendency to become hypertensive adults [9-10]. This concept is commonly defined as tracking [11-12] and was first referred to in 1984 [13].
The existent data about paediatric hypertension is inconsistent. Total hypertension prevalence is not known, mostly because it is yet to define a global definition, a standard measurement and cut-off values applicable globally [14]. According to the current reference definition [7] it would be expected that hypertension prevalence in this age group would be of 1-3% [15]. However, by analysing the results of National Health and Nutrition Examination Surveys group (NHANES) it is possible to observe that juvenile hypertension prevalence is rising, considering that it was 2.7% in 1988-1994 survey and 3.7% in 1999-2002 (results from 1963-1994 were not considered because the method used was not comparable to the actual one) [14, 16]. In Portugal, studies made in children and/or adolescents showed prevalences that ranged from 9.8% to 52%
3
[8, 17-19]. In Portugal, adulthood hypertension is a well studied condition. In 2007 the prevalence was estimated to be 42.1% [20]. World Health Organization (WHO) 2011 report about noncommunicable diseases indicated an estimated value of high blood pressure of 47.9% in Portugal [21]. This value is one of the highest presented on this report [21].
Since 1977, blood pressure monitoring has been recommended in children and adolescents [22]. In 2004, the National High Blood Pressure Education Program Working Group on High Blood Pressure in Children and Adolescents (NHBPEP) has published the “Fourth Report on the Diagnosis, Evaluation and Treatment of High Blood Pressure in Children and Adolescents” where the criteria about adequate intervention and diagnosis of paediatric hypertension were updated. This document is currently used as reference. In this report, normal blood pressure, pre-hypertension and hypertension are respectively defined as: the mean value from three or more occasions, adjusted for sex, age and height, of the systolic blood pressure (SBP) and/or diastolic blood pressure (DBP) lower than 90th percentile, equal or higher than 90th percentile but lower than 95th percentile and equal or higher than 95th percentile [7]. These definitions are based on the distribution of blood pressure values in a presumably healthy population [7] and its application is made through North American reference charts, which values were obtained by the auscultatory method [7].
When physiologic evolution is considered, blood pressure values progressively increase until 17-18 years and they stabilize, reaching adulthood values [15]. It is known that childhood hypertension is associated with positive hypertension family history, low birth weight and with overweight [15]. Giving the fact that the hereditary component of paediatric hypertension is of 50% approximately [23] it can be said that substantial part of SBP and DBP have hereditary influence [24]. Studies have demonstrated that both intrauterine growth retardation and low birth weight are risk factors to hypertension and cardiovascular diseases in adulthood [25-27]. The basis for the associations between low birth weight and intrauterine growth retardation with high blood pressure risk are mentioned in the literature as “programming” [28]. Considering this, children presenting any of these conditions should have their growth pattern and body composition, as well as their blood pressure, more warily monitored during childhood [15].
4
It was not until the last two decades that it has been accepted that some health risk factors, particularly related to cardiovascular disease, may be determined by distribution and quantity of adipose tissue [29]. The association between juvenile nutritional status and cardiovascular risk factors has been demonstrated by numerous studies [30-31] and most of them positively associate obesity with hypertension [32-34]. The relation between central and general obesity measures is frequently studied in both children and adults [35-36]. In addition, some of those studies concluded that fast weight gains in early stages of life may increase the risk of developing high blood pressure in later life [37]. Overweight and obese children present more risk of high blood pressure than normal weight children, fact that was demonstrated by Freedman (1999) [38] in a study which indicates that obese children have 4.5 and 2.4 times more probability of having high SBP and DBP, respectively, when compared with normal weight ones. Besides that, the relation between weight gain and abdominal fat mass accumulation with high blood pressure values is positive [39]. In children, a weight percentile equal or superior to 85th percentile, associated to central obesity is an indicator of high probability of developing hypertension [39]. Obesity and hypertension relationship might be partially explained by a hyperactivity of the central nervous system which is partly expressed by heart rate rise and also by the variation of blood pressure values [40].
In relation to blood pressure measurement, the previously mentioned report by NHBPEP indicates that it should be monitored in every child older than 3 years old, preferably using the auscultatory method (gold-standard) and an appropriate cuff adapted to the size of the child or adolescent’s arm [7]. This aspect must be carefully considered since an oversized cuff may undervalue the result, as well as an undersized cuff might overvalue the result [29].
In clinical practice, blood pressure is most commonly measured by the oscilometric method [9]. The oscilometric devices calculate both SBP and DBP values [9] using algorithms. It is important to highlight that the algorithms used differ according to the device and brand [41], fact that explains the variety of results obtained when different oscilometers are used. Although this method is practical, effective and decreases the observer error [7], when oscilometry is
5
used it should be considered that the obtained values are considerably higher than those obtained by the auscultatory method and more prone to errors in the paediatric ages [9, 42]. For this reason, when hypertension is diagnosed by the oscilometric method it should always be confirmed by auscultometry [7].
Hypertension is divided in primary, when it is not a direct consequence of another disease [15] and its diagnose is made by exclusion of other causes [29], and in secondary, when modifiable causes are present and are liable to be treated with specific interventions [15]. Primary hypertension is generally characterised by blood pressure values above 99th percentile and by the presence of peripheral arterial pulses together with negative results in diagnostic parameters for other diseases [15]. Hypertension family history and high Body Mass Index (BMI) values are significant risk factors for primary hypertension [29]. On the other hand, secondary hypertension is generally diagnosed in small children or in adolescents who present specific systemic conditions that suggest this pathology [29]. In these age groups, hypertension caused by renal disease or aorta coarctation are responsible for 70 to 90% of the secondary forms [43] while endocrinal and other causes are less frequent [15]. In childhood, the secondary form prevails; as age increases, primary forms become more frequent [15]. Thus the increase of hypertension prevalence reflects an epidemiologic change from the secondary form to the primary form [44].
Hypertension prevention is based on adequate lifestyle and nutrition since early childhood and throughout life [15]. Furthermore, the main therapeutic of paediatric hypertension is almost exclusively dietetic and behavioural [7]. Moreover weight loss is the primary treatment for hypertension associated to obesity [7, 15] and naturally, physical activity should be part of this treatment [7]. If none of the changes mentioned before is effective, there are antihypertensive drugs that can be used concomitantly with the remaining treatment [7]. Regarding physical activity recommendations, in the last years we have seen major changes. The actual recommendations for the juvenile population are at least 60 minutes of daily physical activity of moderate/vigorous intensity [45-47].
6
Since early ages, different blood pressure values may result both in structural and functional organ changes [15]. Taking this into account, it is important to avoid damage by establishing an early diagnose and taking corrective measures as soon as possible [48]. Once hypertension is diagnosed, both presence and level of organ damage must be determined because it will allow the cardiovascular risk classification. During childhood it is rare to witness the presence of long-term sequels such as myocardial infarction, heart failure, stroke or renal disease. Despite this, paediatric hypertension is an independent risk factor for hypertension in adulthood aside from its association with early cardiovascular markers within which are included left ventricular hypertrophy [49] (most documented consequent in children and adolescents), intima-media artery thickness [50], atherosclerosis [51] and diastolic dysfunction [52].
To diagnose hypertension in paediatric ages is not simple [48] since it relies on charts containing many reference values (dependent of age, sex and height). Despite the existence of computer programmes portraying these cut-off values, it may be difficult for health professionals to include them in their clinical routine [48]. Another relevant aspect is that it is not possible to establish a single cut-off value as it was made for adults [9]. These observations have important implications to the development of predictive methods that allow an early and effective action in this field. For this reason, research performed within this area has been focused in the identification of methods and cut-off values which are both simple and easy to apply, not only to the clinical practice, but also to the epidemiological research. These methods must have adequate specificity and sensitivity to accurately predict risk of developing hypertension. In this direction, many authors have proposed that anthropometric measures may play an important role estimating the risk to develop diabetes mellitus and cardiovascular disease risk factors such as hypertension and high cholesterol [53-56]. Some examples of these methods are: BMI, waist circumference (WC) and waist-to-height ratio (WHtR).
BMI is widely used as a nutritional status characteriser in general population. In children, this index is widely used to define overweight [57], even so, its predictive value concerning hypertension is still arguable [35, 58]. The use of this parameter as an adiposity measurer has been criticised, particularly in
7
children given their constant growth and body composition changes. Annual BMI increases may be more attributable to free-fat mass increases than to fat mass (FM) accumulation [57]. This aspect is also supported by the fact that children and adolescents with similar BMI values may present significant differences in fat mass quantity [59]. However, there is a positive association between high BMI values and SBP and DBP [60]. Considering all this, several studies have been made in order to relate BMI with blood pressure [55, 60-61]. The range of conclusions illustrates the need of performing more studies within this age group. Considering that BMI is not a measure of body fat distribution it is suggested that it may be preferable to use a body fat distribution index, alone or in association with BMI, in order to increase the sensibility to detect children and adolescents with cardiometabolic risk factors [62]. In this sense, there is one parameter that must be considered which is waist circumference.
An elevated waist circumference may be indicative of an accumulation of excessive fat around organs inside the abdominal cavity [63], reason why it is considered the main indicator of visceral accumulation, with which the same risk factors related to obesity are frequently associated [64]. It is considered a good central obesity marker due to, as previously said, its association with visceral fat [33]. However, BMI has the advantages of being better validated and the fact that its measurement is more precise [33]. In addition, in overweight individuals, waist circumference measurement site may affect its relation with cardiovascular risk factors. Literature does not seem consensual in this point since most authors propose the midpoint between the lowest rib and the iliac crest as being more strongly associated to these factors comparing with the umbilicus site or the iliac crest [65-66] and this measuring site is also the one recommended by WHO for adult’s [67]. On the other hand, some authors have recently suggested that for identifying cardiovascular risk, there are no significant differences between the measurement site used [65]. One study reported that children with high waist circumference values had on average 6.0mmHg SBP and 2.6mmHg DBP above blood pressure values of normal waist circumference [66]. Nowadays, there are waist circumference reference charts defined for some populations including the United Kingdom and Spain [68-69], among others. It seems to be clear that waist circumference has some
8
degree of predictivity about blood pressure, although it is yet to be defined the exact relationship. In paediatrics, waist circumference is not regularly measured, probably because no international organisation has yet developed or approved applicable cut-off values for children and adolescents [70]. It must always be considered that children with high blood pressure do not necessarily have high values of waist circumference and vice-versa [71]. It is also important to consider that waist circumference might under or overvalue hypertension risk in shorter or taller individuals, respectively [36].
Finally, the ratio between waist circumference and height (WHtR) appeared as an approach to minimize the error associated to height [72] which was previously mentioned. A few studies indicate a superiority of the association from high blood pressure values with waist circumference [64], which are contradicted by a higher number of studies that refer WHtR as more accurate [64, 73-74]. Another advantage of using this ratio instead of waist circumference is the fact that a single cut-off point appropriate to all age groups is established, which is independent of race, age or sex 76]. The cut-off point is 0.500 [75-76], and most studies refer that using this value would simplify the application of this predictive method [36, 75].
Taking into consideration all aspects mentioned above as well as the concerning increase of hypertension prevalence concomitantly with juvenile obesity epidemics, it is utterly relevant to develop studies focusing on blood pressure in this age group in order to increase knowledge and implement urgent corrective measures to reverse the problem, in a public health point of view.
9
10 Aim
The present study aims to evaluate high blood pressure prevalence, as well as its associations with anthropometric and adiposity parameters in paediatric ages.
Experimental design
This study is characterised as retrospective, transversal and analytical and comprises data collected from November 2011 to June 2013, obtained from the patient’s informatic clinical process.
The present study was approved by the Ethical Commission from the hospital.
Sample
The study includes a convenience sample of children and adolescents with ages between 6 and 18 years old, followed by one paediatrician in an outpatient clinic. These appointments included: a) children/adolescents in routine health surveillance; b) individuals with excess weight or obesity and c) high intensity sports practitioners.
It was defined as inclusion criteria the registration of blood pressure. As exclusion criteria were considered the presence of any chronic disease that compromises either growth or nutritional status, as well as the existence of any pathology that is proven to interfere with blood pressure, such as renal, endocrinal or cardiac diseases. Any children or adolescent with gestational age inferior than 37 weeks [77], with low-birth weight (< 2500g) [77] or with intra-uterine growth retardation was excluded due to the distinct growth pattern associated to prematurity and also due to the higher susceptibility for cardiovascular disease observed in children light for gestational age [26-27]. From the paediatrician’s patient list, 214 children and adolescents were recruited according to the criteria previously defined.
11 Materials and methods
All values are reported to the first appointment with the paediatrician, and were collected following a standard protocol that includes clinical and nutritional evaluation among other parameters. The assessment of all anthropometric values followed both methodology and techniques internationally recommended [78].
1- Anthropometric parameters 1.1- Weight
Weight evaluation was obtained using the InBody® 230 device, with a 0.1kg precision, with every child and adolescent being barefoot and on underwear. The results obtained were expressed in kilograms for the whole sample. From weight, the z-score values were calculated using the WHO AnthroPlus® software, version 1.0.4 [79], for children from 6 to 10 years old, according to the WHO criteria [80].
1.2- Height
To obtain the height values a stadiometer Seca® 220 with 0.1cm precision was used and every child and adolescent was barefoot and on underwear. These results were expressed in meters for all sample. The z-score was calculated using the WHO AnthroPlus® software, version 1.0.4 [79].
1.3- Body Mass Index
BMI was directly calculated by the InBody® 230 software. It was expressed in kilograms per square meter. The z-score values were obtained by WHO AnthroPlus® software, version 1.0.4 [79]. To define excess weight and obesity it was assumed a z-score value equal or higher than 1.0364 (which is equivalent 85th percentile) and equal or higher than 1.6449 (which is equivalent to 95th percentile), respectively. Every child and adolescent was barefoot and on underwear.
12
1.4- Waist Circumference and Waist-to-height ratio
To evaluate waist circumference a 150cm flexible measuring tape with 0.1cm precision was used and the measurement was performed on bare skin at the umbilicus level. The results are expressed in centimetres. These values together with height in centimetres allowed the establishment of the ratio between waist circumference and height. The cut-off used to represent cardiovascular risk was 0.500, according to McCarthy [76].
2- Body composition
Body composition was assessed by direct segmental multi-frequency bioelectrical impedance using InBody® 230 device and the values obtained were expressed in percentage for fat mass (0.1% precision) and in kilograms for muscle mass (MM) (0.1kg precision). This method is able to predict fat mass excess in a way similar to DEXA (Dual-energy X-ray Absorptiometry) [81]. Every child and adolescent was evaluated barefoot and on underwear. Percentage of MM was calculated using both values of muscle mass and weight in kilograms.
3- Pubertal stage
Pubertal stage was characterized by the paediatrician according to Tanner criteria [82]. It was stratified as Tanner 1: prepubertal, Tanner 2 and 3: medium puberty and Tanner 4 and 5: final puberty.
4- Blood pressure
Blood pressure evaluation was performed by oscilometric method using a Philips® VM6 device with a 0.1mmHg precision. The measurement was made according to international recommendations [7]. This measurement was performed only once, unless any error or odd value occurred. SBP and DBP values obtained were expressed in millimetres of mercury. The 90th percentile
13
percentage (%Pc90) was calculated according to the values of the charts of the Fourth Report on the Diagnosis, Evaluation and Treatment of High Blood Pressure in Children and Adolescents reference [7].
5- Family obesity history
By direct enquire to the parents the information concerning height and weight was collected, in order to calculate both parents’ reported BMI values.
6- Physical Activity
The assessment of physical activity behaviour was performed by oral enquiry to the child/adolescent and/or to his parents, and included school sport, as well as extra-curricular organized sport. The results were expressed in hours per week. Physical activity was divided in equal or less than 3 hours per week and in more than 3 hours per week, aiming to assess school sport and extracurricular physical activity, respectively.
Statistical Analysis
Statistical analysis was performed using IBM® SPSS® Statistics version 21.0 for Windows®. Descriptive statistics was expressed by frequencies, mean values, standard deviation, minimum and maximum values for all variables. All scale variables had a distribution close to the Normal, according to skewness and kurtosis coefficient values, except for BMI and physical activity. For scale variables, differences between genders were calculated using Student’s t-test. In ordinal variables, Mann-Whitney U test was used to evaluate differences between sexes. Pearson and Spearman correlation coefficients were computed to assess the degree of association between variables. Finally, multivariate analysis was performed to evaluate the effect size of some variables on %Pc90SBP and %Pc90DBP. The obtained effect size was interpreted using the partial η2 value, through a qualitative definition of between-subject effects
14
proposed by Cohen, J. (1988) [83]. This criterion identifies the overall adjusted importance of the analyzed variables. The effect size was classified as small (η2 < 0.035), medium (0.035 ≤ η2 < 0.100) and large (η2 ≥ 0.100).
15
16 Results
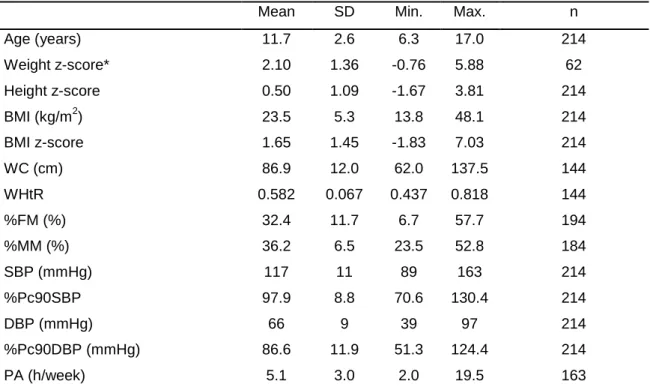
This analysis comprises 214 children and adolescents aged from 6-18 years old (mean age of 11.7 years), of whom 89 (41.6%) were boys. General characterization of the sample is presented in Table 1. Both BMI z-score and WHtR showed high mean values.
Table 1- General characterization of anthropometric parameters, BMI, body composition, blood pressure and physical activity (n = 214).
Mean SD Min. Max. n Age (years) 11.7 2.6 6.3 17.0 214 Weight z-score* 2.10 1.36 -0.76 5.88 62 Height z-score 0.50 1.09 -1.67 3.81 214 BMI (kg/m2) 23.5 5.3 13.8 48.1 214 BMI z-score 1.65 1.45 -1.83 7.03 214 WC (cm) 86.9 12.0 62.0 137.5 144 WHtR 0.582 0.067 0.437 0.818 144 %FM (%) 32.4 11.7 6.7 57.7 194 %MM (%) 36.2 6.5 23.5 52.8 184 SBP (mmHg) 117 11 89 163 214 %Pc90SBP 97.9 8.8 70.6 130.4 214 DBP (mmHg) 66 9 39 97 214 %Pc90DBP (mmHg) 86.6 11.9 51.3 124.4 214 PA (h/week) 5.1 3.0 2.0 19.5 163
WC: waist circumference; WHtR: waist-to-height ratio; FM: fat mass; MM: muscle mass; SBP: systolic blood pressure; DBP: diastolic blood pressure; PA: physical activity
* z-score values for weight were only calculated for children between 6 and 10 years old
according to the WHO reference
Overweight and obesity prevalence (WHO criteria) for all sample and its characterization are presented in Table 2. It was possible to observe that more than two thirds of our sample was overweight/obese (67.8%).
Table 2- Characterization of nutritional status using BMI z-score according to WHO criteria (n = 214).
% n
BMI z-score < 1.0 32.2 69
BMI z-score ≥ 1.0 67.8 145
BMI z-score ≥ 1.6 57.5 123
17
Waist-to-height ratio for all sample is presented in Table 3. Almost all of our sample (90.3%) had a WHtR above the cut-off value, being considered at risk for cardiometabolic comorbidities.
Table 3- Characterization of WHtR according to risk of cardiometabolic comorbility (n = 144).
% n
WHtR < 0.500 9.7 14
WHtR ≥ 0.500 90.3 130
WHtR < 0.500: without cardiometabolic risk; WHtR ≥ 0.500: high cardiometabolic risk
Since each blood pressure measure was strongly correlated with its 90th percentile percentage (R = 0.856 p < 0.001 for SBP and R = 0.955 p < 0.001 for DBP), when appropriate, we used %Pc90SBP and %Pc90DBP instead of SBP and DBP, respectively, because the former are adjusted for height, age and sex.
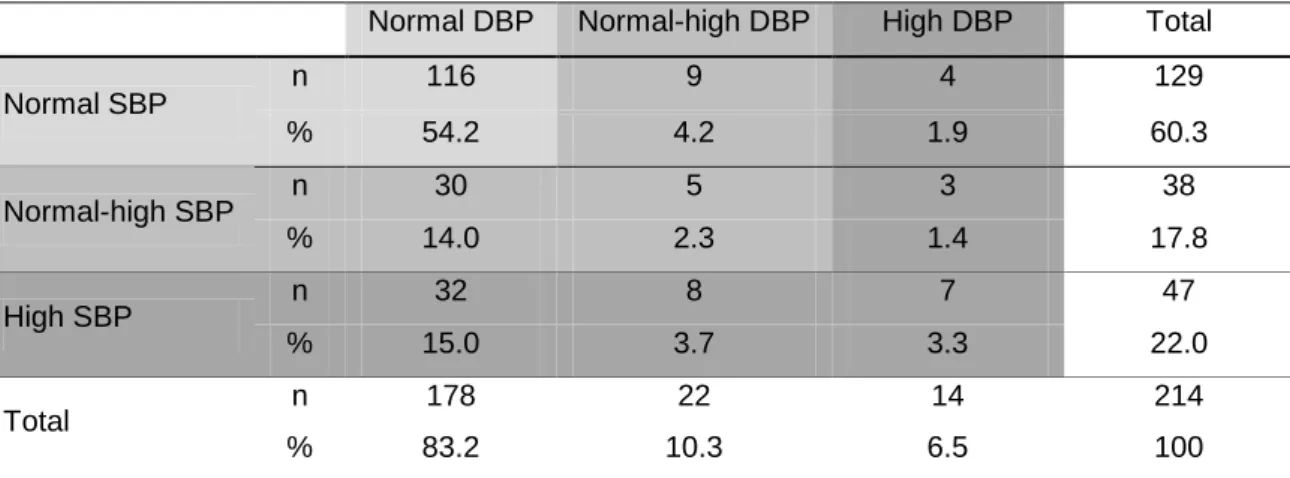
In Table 4 it is possible to observe both systolic and diastolic blood pressure characterization, considering the Fourth Report reference (26). Almost half of our sample (45.0%) showed risk for high blood pressure (normal-high/high) and a quarter (25.3%) already presented high SBP and/or DBP. Finally, 39.8% and 16.8% of the sample showed SBP and DBP above 90th percentile, respectively.
Table 4- Characterization of SBP and DBP according to the Forth Report reference (n = 214).
Normal DBP Normal-high DBP High DBP Total
Normal SBP n 116 9 4 129 % 54.2 4.2 1.9 60.3 Normal-high SBP n 30 5 3 38 % 14.0 2.3 1.4 17.8 High SBP n 32 8 7 47 % 15.0 3.7 3.3 22.0 Total n 178 22 14 214 % 83.2 10.3 6.5 100
Normal BP: < 90th percentile; Normal-high BP: ≥ 90th percentile < 95th percentile; High BP: ≥ 95th percentile
18
Sample´s physical activity habits are presented in Table 5. The division in hours per week was performed taking into consideration those children and adolescents that only made school sport, which took a maximum time of 3hours/week, and those who, besides school sport, also participated in extra-curricular sport activities (> 3hours/week). There was a slightly higher percentage of individuals with extracurricular activities (54.6%).
Table 5- Physical activity: distribution according to weekly performed practice (n=163).
% n
PA ≤ 3h/week 45.4 74
PA > 3h/week 54.6 89
PA: physical activity
Considering family history, the majority of parents had a BMI above 25kg/m2, as it is shown in Table 6.
Table 6- Characterization of family BMI and prevalence of overweight (WHO criteria).
Mean SD Min. Max. n Mother’s BMI (kg/m2 ) 26.7 5.4 19.2 47.3 94 Father’s BMI (kg/m2 ) 27.8 4.6 19.4 49.6 87 % n Mother (BMI ≥ 25kg/m2 ) 58.5 55 Father (BMI ≥ 25kg/m2 ) 74.2 69 BMI ≥ 25kg/m2 : overweight
When the sample was divided according to gender, significant differences were observed regarding weight, BMI z-score, waist-to-height ratio and SBP, with higher values for males in all cases (Table 7). No differences were observed considering blood pressure percentage of 90th percentile.
19
Table 7- General characterization of age, anthropometric parameters, BMI, blood pressure, physical activity and Tanner stage according to gender.
Boys Girls Mean SD n Mean SD n p Age (years) 11.9 2.5 89 11.6 2.7 125 0.399 Weight (kg) 57.9 18.3 89 51.7 16.0 125 0.009 Weight z-score* 2.25 1.69 23 2.01 1.14 39 0.472 Height (m) 1.53 0.15 89 1.49 0.13 125 0.557 Height z-score 0.62 1.16 90 0.40 1.02 125 0.142 BMI (kg/m2) 24.3 5.8 89 23.0 4.9 125 0.067 BMI z-score 1.93 1.55 89 1.45 1.34 125 0.016 WHtR 0.600 0.071 60 0.570 0.062 84 0.006 %FM (%) 31.3 13.3 83 33.2 10.3 111 0.272 %MM (%) 37.0 7.5 77 35.6 5.5 107 0.127 SBP (mmHg) 119 13 89 116 9 125 0.047 %Pc90SBP 98.2 9.89 89 97.8 8.0 125 0.765 DBP (mmHg) 67 10 89 66 9 125 0.192 %Pc90DBP 87.5 13.0 89 86.0 11.0 125 0.383 PA (h/week)U 4.9 2.6 72 5.2 3.3 91 0.681 TannerU % (n=50) % (n=55) p Tanner 1 34.5 32.0 0.446 Tanner 2 + 3 45.5 48.0 Tanner 4 + 5 20.0 20.0
Tanner 1: prepubertal; Tanner 2 + 3: medium puberty; Tanner 4 + 5: final puberty
WHtR: waist-to-height ratio; FM: fat mass; MM: muscle mass; SBP: systolic blood pressure; DBP: diastolic blood pressure; PA: physical activity
t-test except for U (Mann-Whitney U test). Bold indicates p < 0.05
* z-score values for weight were only calculated for children between 6 and 10 years old according to the WHO (reference)
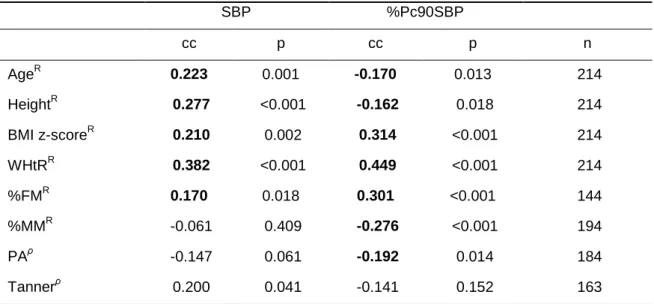
Correlations between blood pressure and age, anthropometric parameters, BMI and physical activity were computed (Table 8 and Table 9).
We observed that SBP was positively and weakly correlated with age, height, BMI z-score, waist-to-height ratio and fat mass percentage. DBP was also weakly correlated with the previous variables, except for WHtR, in addition to very weak and negative correlations with muscle mass percentage and physical activity. Moreover, both %Pc90SBP and %Pc90DBP showed significant, positive and weak correlations with BMI z-score and fat mass percentage while
20
only %Pc90SBP was correlated with WHtR. Negative and very weak correlations were observed between, %Pc90 of both SBP and DBP, with muscle mass percentage and physical activity, whereas age and height were only correlated with %Pc90SBP.
Table 8- Correlation between %Pc90SBP with age, anthropometric parameters, BMI, body composition, physical activity and Tanner.
SBP %Pc90SBP cc p cc p n AgeR 0.223 0.001 -0.170 0.013 214 HeightR 0.277 <0.001 -0.162 0.018 214 BMI z-scoreR 0.210 0.002 0.314 <0.001 214 WHtRR 0.382 <0.001 0.449 <0.001 214 %FMR 0.170 0.018 0.301 <0.001 144 %MMR -0.061 0.409 -0.276 <0.001 194 PAρ -0.147 0.061 -0.192 0.014 184 Tannerρ 0.200 0.041 -0.141 0.152 163 R
Pearson correlation; ρ Spearman’s ρ correlation. Bold indicates p <0.05
cc: coefficient correlation; WHtR: waist-to-height ratio; FM: fat mass; MM: muscle mass; SBP: systolic blood pressure; PA: physical activity
We found strong associations between fat mass percentage and BMI z-score (R = 0.873 p < 0.001), between fat mass percentage and waist-to-height ratio (R = 0.776 p < 0.001), as well as between BMI z-score and WHtR (R = 0.817 p < 0.001). In order to prevent collinearities, only fat mass percentage was considered in the multivariate analysis. We also tried to include physical activity effect in the previously mentioned model, but its effect was not significant when adjusted for the other variables. For this reason, and due to the fewer registered physical activity frequencies, we opted to exclude it from the multivariate analysis. Even though, as expected, Tanner stage classification was correlated with age (ρ = 0.683 p < 0.001) we decided not to apply it to the entire sample and use age instead.
21
Table 9- Correlation between %Pc90DBP with age, anthropometric parameters, BMI, body composition, physical activity and Tanner.
DBP %Pc90DBP CC p CC P n %pc90SBPR - - 0.266 <0.001 214 AgeR 0.142 0.038 -0.053 0.440 214 HeightR 0.187 0.006 -0.032 0.638 214 BMI z-scoreR 0.185 0.007 0.229 0.001 214 WHtRR 0.135 0.106 0.153 0.067 144 %FMR 0.221 0.002 0.267 <0.001 194 %MMR -0.159 0.031 -0.248 0.001 184 PAρ -0.193 0.014 -0.208 0.008 163 Tannerρ 0.167 0.89 0.034 0.731 105 R
Pearson correlation; ρ Spearman’s ρ correlation. Bold indicates p <0.05
cc- coefficient correlation; WHtR: waist-to-height ratio; FM: fat mass; MM: muscle mass; DBP: diastolic blood pressure; PA: physical activity
In order to measure the effect size of sex, age, height and fat mass percentage on %Pc90SBP and %Pc90DBP, a multivariate analysis was performed and the results are presented in Table 10. We observed that individuals with higher fat mass percentages had higher %Pc90SBP and %Pc90DBP (medium effect size). The other variables did not have a significant effect on blood pressure. Table 10- Measure of the effect size of sex, age, height and %FM on %Pc90SBP and %Pc90DBP. n=196 %Pc90SBP %Pc90DBP Sex η2 (p) 0.003 (0.629) 0.012 (0.296) M Mean (SD) 98.15 (9.888) 87.49 (13.019) F Mean (SD) 97.78 (7.994) 86.01 (11.020) Age η2 (p) 0.000 (0.920) 0.000 (0.788) Height η2 (p) 0.003 (0.461) 0.001 (0.658) %FM η2 (p) 0.076 (<0.001) 0.071 (<0.001)
M: male; F: female; FM: fat mass Bold indicates p < 0.05
23
24 Discussion and Conclusions
The significant increase of hypertension and high blood pressure in paediatric ages is a cause of concern among worldwide health authorities as also among health professionals. Given the impact of this disease in the adult population, it is urgent that some preventive measures are taken. This fact was supported by the premise that some cardiovascular risk factors, including high blood pressure, start to develop early in life. Considering this, and also taking into account that hypertension diagnose in juvenile ages is not simple, researchers have centred most of their investigation in somatic indicators that seem promising in early prevention and diagnose of this pathology.
Portugal is a country where hypertension prevalence in adults is elevated [20] and where paediatric hypertension is probably underdiagnosed. In this context, recognizing the importance of prevention and of an early diagnose, it was our intention, to further understand these relationships in a sample of children and adolescents. In fact, the purpose of this thesis was to evaluate the association between some anthropometric measures and body composition with blood pressure in paediatric ages. Recently, some studies focused on themes related to this but only few of them studied Portuguese samples [84-86].
We analysed a convenience sample with ages between 6.3 and 17.0 years old. According to Tanner classification, we were able to verify that almost half of boys (45.5%) and girls (48.0%) were included in the group of Tanner stage 2 and 3, which means they had already initiated puberty (Table 7).
When we focused on nutritional status we were able to conclude that our sample presented an elevated prevalence of overweight and obesity, 67.8% and 57.5%, respectively (Table 2). Portugal presents one of the highest prevalences of overweight and obesity in paediatric ages, with values greater than 30% [3]. Even considering the national high prevalence, one possible reason for the unusual high value observed in our sample is the fact that some of the assessed children were followed in this specific appointment due to excess weight. This fact may also justify the high adiposity percentage observed (mean value of 32.4%), but with a considerable variability, since the values ranged from 6.7% to 57.7% (Table 1). The wide inconsistency of
25
individuals comprised in this particular sample, including both overweight and athletic children/adolescents explained this large range of values. According to Fernandes (2011) [61], who studied the relationship between blood pressure, body fat and BMI in a sample of children and adolescents, the mean fat mass percentage value was 17.8%. This result is almost half of the value observed in our sample which highlights the magnitude of our result. Likewise, a Portuguese study performed in a juvenile sample (8-18 years), presented a mean value of 24.0% which, despite being higher than the previously mentioned study, is still lower than our result [86]. Focusing on muscle mass values, a similar explanation may be given, with athletes being likely responsible for the higher numbers (Table 1). Nonetheless, in this last case differences are less evident than those of fat mass percentage, demonstrating that obesity is probably associated with an increment of both fat mass and muscle mass increases. Even though existing evidence suggests that in early ages fat accumulation is predominantly general, it also appears that this accumulation is gender independent and electively abdominal [87]. It seems certain that besides being an indicator of intra abdominal fat, waist circumference is also a cardiovascular risk predictor. However, its validity in paediatric ages is not consensual, particularly below 6 years old [88]. Giving the lack of established cut-off points for juvenile individuals, including for Portuguese population, we decided to focus on waist-to-height ratio. This decision was supported by the documented relevance of WHtR as a cardiovascular risk marker and also by the existence of a cut-off point (0.500), which was supported by several authors [75-76] and was proved a feasible reference for all age groups and populations [76]. Despite this, we believe it is important to mention that waist circumference mean value was of 86.9cm which, even without a specific reference, solely by comparing it with adulthood values [89], is possible to suspect that it is an uncharacteristic value. The WHtR mean of our sample (0.582) is a clear indicator of cardiovascular risk (Table 3). Regarding this parameter there is little consistency in the results published until now, [62, 73, 90-92]. Once again, our result is probably related to the high prevalence of overweight/obesity showed by our sample. Despite the initial impact of this outcome we should note that measurements were taken during a regular paediatrician appointment, reason
26
why waist circumference measurement was only performed when it seemed adequate. This means that, in those who had adequate weight or were athletes, this parameter may have not been measured, once it was highly unlikely that unusual values were present. Finally, our results may have been somewhat affected by the fact that this parameter was measured at the umbilicus level instead of between the last rib and the iliac crest site [93]. Some authors studied the discrepancy between waist circumferences measurement sites and found differences of 12.5cm between the narrowest waist site and the umbilicus level [93]. Though, Harrington (2012) described a 4.8cm difference between the measurement sites and concluded that this difference only affected central obesity prevalence assessment, and not its relationship with cardiovascular risk (207). Our choice of site was supported by studies, in paediatrics, which provided data indicating good correlations between all waist circumference measurement sites [65, 94]. Taking this into consideration, it seems advisable, for investigators, to opt for sites that are more easily accepted by children/adolescents [65, 93]. This last aspect is of major relevance, once it may not be easy to identify bone markers in overweight and obese individuals, fact that may cause discomfort and constraint in paediatric ages [95].
Since sexual dimorphism has particular relevance from the beginning of puberty, it is important to consider its impact on some biological parameters. Besides with no difference in chronological age was found in our sample, the variables that were different between boys and girls were weight, BMI z-score, WHtR and SBP, with higher values for boys (Table 7). Even though in early ages, fat mass accumulation is predominantly general, there is another aspect that must be considered in order to justify this WHtR values, which is, disease duration. In this case, and since we had no information about this last aspect, in boys, we can presume that overweight had started relatively recently, already being an expression of the greater tendency for android fatness expressed by this sex in adult ages [87, 96]. A possible explanation for the existing differences in SBP may be the fact that boys had higher BMI z-score and were also older and taller (not significant) than girls, which may have positively affected blood pressure. In addition, since puberty is associated with a doubled risk of high blood pressure [87] and considering that most of our male sample
27
had already initiated puberty (Table 7), this is also a possible explanation for our result. Although not significant, we considered relevant to make reference to the higher value of fat mass percentage observed in girls, which may be related to body composition characteristics associated with females during adolescence [87].
To be aware of family background we collected parent’s weight and height, in order to calculate their reported BMI. We were able to conclude that most children/adolescents had parents with excess weight, more specifically, 58.5% of mothers and 74.2% of fathers enquired had BMI values above 25kg/m2 (Table 6). These results may indicate obesity transmission in two ways, whether by genetic susceptibility sharing [97] and/or also by suggesting the presence of an obesogenic environment [97-98].
In practice, and according to WHO, children and youth should make at least 60 minutes of daily physical activity of moderate/vigorous intensity [47]. It was possible to observe that, considering the mean value, the sample evaluated did not fulfil this recommendation, despite the presence of a high weekly frequency (Table 5). It is relevant to mention that our value is likely to overestimate the frequency in the population, since some of the children/adolescents evaluated were competition athletes. This fact may be observed by the maximum value of hours per week found (19.5h/week) (Table 1). Furthermore, 54.6% of our sample practiced extracurricular activities in addition to school sport. Lower values of extracurricular sports were expected, given the high frequency of obese individuals found in this study. Even taking into account that our sample comprised athletes, there was still a great percentage of individuals that were physically active outside school. Nonetheless, there are some possible explanations for these results. Since physical activity is an important component of excess weight treatment in paediatrics [99], and also taking into account the prevalence of this characteristic in our sample, it is likely that some of the overweight children/adolescents practiced sports outside school for one of two main reasons: whether by parental initiative in view of improving their children’s health or already as part of medical recommendation.
28
On the subject of blood pressure, the central point of our work, given the impossibility of the establishment of a single reference value [9], instead of focusing on SBP and DBP mean values, we rather focused on %Pc90SBP and %Pc90DBP which are better indictors of the sample blood pressure status. We observed that more than half of the sample had normal SBP values and more than three quarters had normal DBP values (Table 4). Nonetheless, it is important to mention that individuals with SBP and DBP above 90th percentile represent 45.8% of our sample, which is considered an elevated value since similar international studies indicate lower prevalences [39, 54, 91]. We also found an elevated prevalence of high SBP and/or DBP (25.3%). This value is approximately half of the prevalence of hypertension in the adult Portuguese population [20]. In what concerns hypertension, once again the results are discrepant. In international studies, we found one study with a lower prevalence of high blood pressure than ours [33], while other presented a considerable higher prevalence [100]. In Portuguese studies, we found one, performed in adolescents, which showed high blood pressure prevalence, as well as, their SBP and DBP mean values overlapped ours [86]. Once again, BMI may have some influence on our results, since literature demonstrates associations between BMI z-score values higher than 1.0 (matching 85th percentile) and the expression of elevated blood pressure values [39]. We did not found studies that had evaluated blood pressure 90th percentile percentage, reason why it was not possible to compare our results with others.
Regarding correlation tests only weak and very weak associations were found. Nevertheless, some of them presented statistical significance, reason why they are worth notice. Considering both SBP and DBP, values increase with height and age which is in agreement with what is mentioned in the literature [7, 29]. At the same time, SBP shows positive correlations with all adiposity indicators (BMI z-score, %FM and WHtR) and the same happens for DBP, with exception for WHtR, which was not statistically significant (Table 8 and Table 9). These results are also in agreement with some authors who propose that weight and fat mass have some impact in blood pressure [9, 36]. In addition, DBP also showed negative and very weak correlations with muscle mass percentage and physical activity (Table 9). By the analysis of %Pc90SBP and %Pc90DBP they
29
both correlated positively with BMI z-score and fat mass percentage and negatively with muscle mass and physical activity, while %Pc90SBP also correlated with WHtR (Table 8 and Table 9). These results are related with those obtained for SBP and DBP, respectively, although, there are some aspects that require some reflection. While SBP and DBP were positively correlated with age and weight, both %Pc90SBP and %Pc90DBP, showed negative and not significant correlations, with these variables (Table 8 and Table 9). Taking into account that %Pc90SBP and %Pc90DBP calculus include both age and height, it was expected that the correlation between them would be weaker, as it was observed, once the strong effect added by age and height was removed. For this reason, the correlations between %Pc90SBP and %Pc90DBP with BMI z-score, fat mass percentage and WHtR were reinforced. Similar results (very weak and weak correlations) between some of these variables and blood pressure were found in other studies [33, 73, 101]. More specifically, a study concluded that all correlations between SBP and BMI (R = 0.27), fat mass percentage (R = 0.27), waist circumference (R = 0.30) and WHtR (R = 0.27) were weak while DBP presented the same level of correlation (R = 0.26 for fat mass percentage and R = 0.25 for WHtR), with exception for BMI (R = 0.19) and waist circumference (R = 0.20) that had very weak correlations [73]. A second study also demonstrated that BMI (R = 0.28) and waist circumference (R = 0.26) were weakly correlated with SBP while WHtR (R = 0.19) was very weakly correlated, and regarding DBP only BMI (R = 0.26) showed weak correlations and both waist circumference (R = 0.24) and WHtR (R = 0.19) were very weakly correlated [101]. Comparing our results with the last two studies we noticed that for SBP, our fat mass percentage correlation was lower, while WHtR was considerably higher (Table 8). For DBP, the only comparison possible was with fat mass percentage where correlation values were very similar (Table 9). A Portuguese study [86] assessed correlations between these variables according to sex, and higher correlations were found for boys in SBP (BMIboys = 0.29 BMIgirls = 0.18; %FMboys = -0.07 %FMgirls = 0.04) and in DBP with BMI (BMIboys = 0.23 BMIgirls = 0.15). Comparing these values with the ones for our entire sample we obtained higher correlations for fat mass (Table 8 and Table 9). No comparisons with BMI may be made since we considered BMI z-scores.
30
In order to further comprehend the relationship between %Pc90SBP and %Pc90DBP with fat mass indicators, a multivariate analysis was performed and the previous results were supported. Considering that a moderate effect was observed, it seems evident that high blood pressure is positively affected by fat mass percentage. The non-significant effect of sex, age and height indicates that the usage of the %Pc90 is effective to compensate for the relationship of these variables with blood pressure.
It is important to refer that the present study shows some limitations, such as: 1) we studied a convenience sample which is not representative of the Portuguese paediatric population; 2) blood pressure measurement was made by oscilometry and, most of the times, only once.
Despite that, this study showed that children and adolescents with increased values of BMI, fat mass and WHtR are more susceptible to increased blood pressure. This effect appears to be more evident in SBP. Even considering that the variables were significantly related, the results obtained also stated that none of these parameters should be used as a substitute of blood pressure measurements. However, as risk indicators, they seem to be effective, which means that children/adolescents with these signs should have their blood pressure under tight surveillance.
31
32 Final Considerations
From the conclusions of our work, the importance of regular blood pressure assessment and the usage of percentile tables were enhanced. In addition, it highlighted the value of anthropometry and body composition assessment in paediatric ages, and supported the theory of higher cardiovascular risk in those with increased values [30-31, 36]. Ultimately, it is of high urgency to develop more studies in this area, particularly focusing on the establishment of a practical and fast way to identify children and adolescents at risk of developing hypertension. This field of studies is of particular relevance for the Portuguese population since hypertension is already highly prevalent in adults. Besides, studies like ours show that this disease seems to have already affected a great percentage of children and adolescents.
33
34 References
1. Haslam, D.W. and W.P.T. James, Obesity. The Lancet, 2005. 366(9492): p. 1197-1209.
2. Lobstein, T., L. Baur, and R. Uauy, Obesity in children and young people: a
crisis in public health. Obes Rev, 2004. 1: p. 4-104.
3. Rito, A., et al., Prevalence of obesity among Portuguese children (6-8 years old)
using three definition criteria: COSI Portugal, 2008. Pediatr Obes, 2012. 2012 Dec;7(6):413-22. doi(2012 Aug 17): p. 10.1111/j.2047-6310.2012.00068.x.
4. Muntner, P., et al., Trends in blood pressure among children and adolescents. JAMA, 2004. 291(17): p. 2107-2113.
5. Ayatollahi, S., et al., Reference Values for Blood Pressure of Healthy
Schoolchildren in Shiraz (Southern Iran) using Quantile Regression. Int
Cardiovasc Res J, 2010. 4(2): p. 55-65.
6. Podoll, A., et al., Inaccuracy in pediatric outpatient blood pressure
measurement. Pediatrics, 2007. 119(3): p. e538-43.
7. National High Blood Pressure Education Program Working Group on High Blood Pressure in Children and Adolescents, The fourth report on the
diagnosis, evaluation, and treatment of high blood pressure in children and adolescents. Pediatrics, 2004. 114(2 Suppl 4th Report): p. 555-76.
8. Maldonado, J., et al., An approach of hypertension prevalence in a sample of
5381 Portuguese children and adolescents. The AVELEIRA registry. "Hypertension in children". Blood Press, 2011. 2011 Jun;20(3):153-7. doi(2010
Dec 9): p. 10.3109/08037051.2010.542649.
9. Lurbe, E., et al., Management of high blood pressure in children and
adolescents: recommendations of the European Society of Hypertension. J
Hypertens, 2009(10): p. 27(9):1719-42.
10. Bao, W., et al., Essential hypertension predicted by tracking of elevated blood
pressure from childhood to adulthood: the Bogalusa Heart Study. Am J
Hypertens, 1995. 8(7): p. 657-65.
11. Toschke, A.M., et al., Meta-analysis of blood pressure tracking from childhood
to adulthood and implications for the design of intervention trials. Acta Paediatr,
2010 2010 Jan;99(1):24-9. doi: p. 10.1111/j.1651-2227.2009.01544.x.
12. Chen, X. and Y. Wang, Tracking of blood pressure from childhood to adulthood:
a systematic review and meta-regression analysis. Circulation, 2008. 2008 Jun
24;117(25):3171-80. doi(2008 Jun 16): p.
10.1161/CIRCULATIONAHA.107.730366.
13. Hofman, A., Blood pressure in childhood: an epidemiological approach to the
aetiology of hypertension. J Hypertens, 1984. 2(4): p. 323-8.
14. Falkner, B., Hypertension in children and adolescents: epidemiology and
natural history. Pediatr Nephrol, 2010. 2010 Jul;25(7):1219-24. doi(2009 May
7): p. 10.1007/s00467-009-1200-3.
15. Spagnolo, A., et al., Focus on prevention, diagnosis and treatment of
hypertension in children and adolescents. Ital J Pediatr, 2013(10): p. 39:20.
16. Din-Dzietham, R., et al., High Blood Pressure Trends in Children and
Adolescents in National Surveys, 1963 to 2002. Circulation, 2007. 116(13): p.
1488-1496.
17. Silva, D., et al., Prevalence of hypertension in Portuguese adolescents in
Lisbon, Portugal. Rev Port Cardiol, 2012. 2012 Dec;31(12):789-94. doi(2012
Nov 8): p. 10.1016/j.repc.2012.02.022.
18. Ramos, E., Barros, H., Prevalência de hipertensão arterial em adolescentes de
13 anos da cidade do Porto. Rev Port Cardiol, 2005. 24 (9): p. 1075-1087.
19. Maldonado, J., Pereira, T., Fernandes, R., Carvalho, M., Distribuição da
pressão arterial em crianças e adolescentes saudáveis: dados do Registo da Aveleira. Rev Port Cardiol, 2009. 28 (11): p. 1233-1244.