Original article (short paper)
Fat mass is negatively associated with the
physiological ability of tissue to consume oxygen
Valentine Z. Vargas1 , Claudio A. B. de Lira2 , Rodrigo L. Vancini3 , Angeles B. R. Rayes1 , Marilia S. Andrade1
1Universidade Federal de Säo Paulo, UNIFESP, Departamento de Fisiologia, São Paulo, SP, Brazil; 2Universidade Federal de Goiás, UFG, Setor de Fisiologia Humana e do Exercício, Faculdade
de Educação Física e Dança, Goiânia, GO, Brazil; 3Universidade Federal do Espírito Santo,
UFES, Centro de Educação Física e Desportos, CEFD, Vitória, ES, Brazil
Abstract –– Aims: To describe the relationship between variables related to body composition and peak oxygen uptake (V̇O2 peak) and to verify whether fat mass can affect these relationships. Methods: Eighty participants underwent cardiopulmonary exercise testing to measure V̇O2 peak and a body composition assessment to measure fat mass, fat free mass (FFM), and total body mass (BM). Results: There were significant relationships between V̇O2 peak relative to FFM (fat free mass) (mL/kgFFM/min) and absolute fat mass (kg) (r=-0.50, p<0.001) and relative fat mass (%) (r=-0.56, p<0.001). Absolute V̇O2 peak (L/min) had a high positive relationship with FFM (r=0.83, p<0.0001); the relationship between V̇O2 peak (L/min) and FFM remained high and positive even when accounting for absolute fat mass (kg) (r=0.83, p<0.001). V̇O2 peak relative to total body mass (mL/kgBM/min) showed a high negative relationship with relative fat mass (%) (r=-0.89, p<0.001) and a positive relationship with fat free mass (kg) (r=0.57, p<0.001), which did not change when accounting for fat mass (kg) (r=0.56, p<0.001). Conclusion: These data indicate that the physiological ability of tissue to consume oxygen (V̇O2 peak in mL/kgFFM/min) is negatively associated with fat mass. Moreover, the individual’s cardiorespiratory capacity to transport oxygen for working muscles (V̇O2 peak in L/min) is strongly related to absolute FFM, and this association is not affected by fat mass. Finally, a better body mass composition (high FFM
and low fat mass) is important for aerobic physical fitness (V̇O2 peak in mL/kgBM/min) and improved physiological ability of tissue to consume oxygen (V̇O2 peak in mL/kgFFM/min).
Keywords: aerobic physical fitness; body composition; peak oxygen uptake; obesity; fat free mass.
Introduction
According to the World Health Organization (WHO), 39% of adults aged 18 years and over were overweight in 2016, and 13% were obese1. This number, which is increasing exponentially worldwide, has been strongly associated with physical inactivity1. Globally, around 31% of adults (men 28% and women 34%)
aged 15 years and over were insufficiently active in 2008. As
a consequence, approximately 3.2 million deaths each year are
attributable to insufficient physical activity2.
A sedentary lifestyle and obesity are public health issues because they are thought to be important risk factors for several noncommunicable diseases, such as cardiovascular diseases and type 2 diabetes mellitus3. However, there is currently no consensus about whether obesity and a sedentary lifestyle are related or whether they are actually independent risk factors. Several previous studies aimed to verify the relationship between obesity and physical
fitness. Their results revealed lower cardiorespiratory fitness for
obese than for thinner subjects for several different populations4-10. However, contradictory results about the relationship between fat
body mass and physical fitness were found in the literature4,11.
Aerobic physical fitness levels have traditionally been assessed
by maximal oxygen uptake (V̇O2 max) and can be defined as the
highest rate at which oxygen can be taken up, transported, and utilized by the body during maximal exercise12. Furthermore, V̇O2 max can be used as a means for identifying physiological impairments and as prognostic data for several types of heart disease13. Achieving a clear plateau in oxygen uptake (V̇O
2) during
cardiopulmonary exercise testing has traditionally been used as the best evidence of V̇O2 max. However, in clinical testing situations, a clear plateau may not be detected. Consequently, peak oxygen uptake (V̇O2 peak) is often used as an estimate for V̇O2 max. For practical purposes, V̇O2 max and V̇O2 peak are used interchangeably13.
In order to compare different individuals, V̇O2 max/peak is usually expressed relative to total body mass (BM) (in mL/kgBM/ min), and when comparing exercise tolerance, this representation should be used14. Specifically, when V̇O
2 max/peak is used in
clinical situations, it should be presented relative to fat free
mass (FFM) (in mL/kgFFM/min), as this better reflects the
physiological ability of the tissue to consume oxygen11. It is possible that the confusion surrounding the proper expression of V̇O2 max/peak contributes to the conflicting results regarding the relationship between body composition and V̇O2 max/peak. In overweight and obese adults, this relationship may present some peculiarities. Overweight and obese people are characterized by high fat mass percentage, which is a negative
point for V̇O2 max/peak relative to BM, but not necessarily for expressed in absolute values (L/min). This is because higher fat free mass, a metabolically active tissue, is also expected for overweight and obese people and may contribute to higher absolute V̇O2 max/peak values11. On the other hand, it is not known if a high fat mass can prejudice the ability of the fat free mass to consume oxygen.
To the best of our knowledge, no data are available about the relationship between body composition and different ways to express V̇O2 max/peak (absolute, relative to BM or relative to FFM). Therefore, the main aim of this study was to describe the relationship between total body mass and body composition (body fat mass and fat free mass in absolute and relative values) and V̇O2 peak in individuals with different body mass index (BMI) and to verify whether the level of individual fat mass is able to affect these relationships. We hypothesized that absolute values for V̇O2 peak (L/min) will have a significant relationship with absolute fat free mass, but V̇O2 peak relative to BM (mL/ kgBM/min) will not, and will instead show a stronger relationship with fat mass. We also hypothesized that higher fat mass will impair the relationship between V̇O2 peak and FFM and will also be negatively associated with the physiological ability of the tissue to consume oxygen. These data may be helpful for better understanding the factors associated with aerobic physical
fitness in lean and overweight or obese populations and to aid
evaluation of these populations.
Methods
Participants
Adults of both sexes, 18-66 years old, were invited to take part in this study. Participants were recruited through advertisements that were posted on social networks and at a medical school. Inclusion criteria were: body mass index (BMI) > 20 and <42 kg/m2, plus no history of neurological, cognitive, orthopedic, respiratory, or endocrine disease (except obesity). BMI was calculated by dividing body mass by height squared (kg/m2).
Subjects were classified according to BMI by using the following
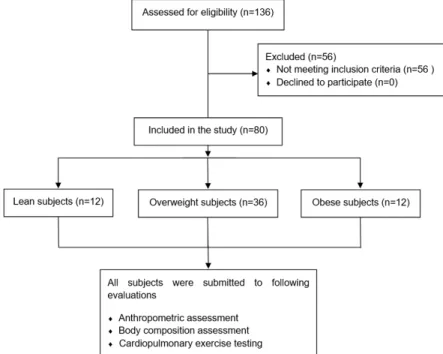
criteria: a BMI < 25 kg/m2 indicates lean subjects, while BMI ≥ 25 kg/m2 indicates overweight subjects, and a BMI ≥ 30 kg/m2 indicates obese subjects1. Between July 2013 and December 2014, 136 subjects were assessed for study eligibility by medical assessment that included a medical history questionnaire and a medical examination. Fifty-six individuals were excluded after application of the inclusion criteria. Eighty subjects participated in this study, the subjects presented the following characteristics: age: 47.4±10.3 years old; body mass: 82.2±14.3 kg; height: 164.2±8.7 cm; BMI: 30.5±5.0 kg/m2; fat mass: 42.0±12.3 %; fat mass: 33.4±12.4 kg and fat free mass: 44.8±10.6 kg. According to BMI
criteria, 12 subjects were classified as lean, 36 were classified as overweight and 32 were classified as obese. Figure 1 illustrates flow chart showing participant selection.
Figure 1. Flow chart for selection of study participants.
The participants were informed about the study’s purpose and experimental procedures, and all gave informed written consent before taking part. All experimental procedures were approved by the Human Research Ethics Committee (protocol number 215.154) of the University and are in accordance with the Declaration of Helsinki.
Cardiopulmonary exercise testing
the Borg scale15. During the cardiopulmonary exercise testing, ventilation and expired gases were measured breath by breath using a metabolic analyzer (Quark, Rome, Italy). For analysis, mean values were calculated every 20 seconds for each variable. Calibration procedures for the metabolic analyzer were performed according to the manufacturer’s guidelines before each test. The highest V̇O2 measured at the cessation of exercise was called V̇O2 peak because none of the participants reached the criteria for V̇O2 max16.
Body composition
Body composition was assessed by dual-energy X-ray absorptiometry (DXA, software version 12.3, Lunar DPX, Madison, WI). The variables analyzed were: FFM in absolute values (kg) and relative to BM (%), fat mass in absolute values (kg) and relative to total body mass (%), and total body mass (kg). This method has been previously demonstrated to be reliable and valid17.
Statistical analyses
The statistical analyses were performed using the Statistica software (version 6.0, Statsoft Inc., Tulsa, Oklahoma, USA). Data were expressed as mean and standard deviation (SD). All variables had a normal distribution according to the Kolmogorov-Smirnov normality test, and exhibited homogeneous variability on the Levene test. One-way ANOVA was used to assess differences between lean, overweight and
obese groups. When significant interactions were present,
Newman-Keuls post-hoc procedures were used to identify
the specific differences.
Pearson´s correlation coefficients between V̇O2 peak and body mass composition were calculated taking into account the volunteer’s age. To this end, the pool of participants from the three groups was used. Pearson´s correlation coefficients between V̇O2 peak and fat free mass (kg) were also calculated taking into account the fat mass (kg). Correlations below 0.49 are described as poor; those from 0.50 to 0.69 are described as “moderate”; those from 0.70 to 0.89 are described as “high,” and those 0.9 and above are described as “very high”18. The level of significance was set at 0.05 for all statistical procedures.
Results
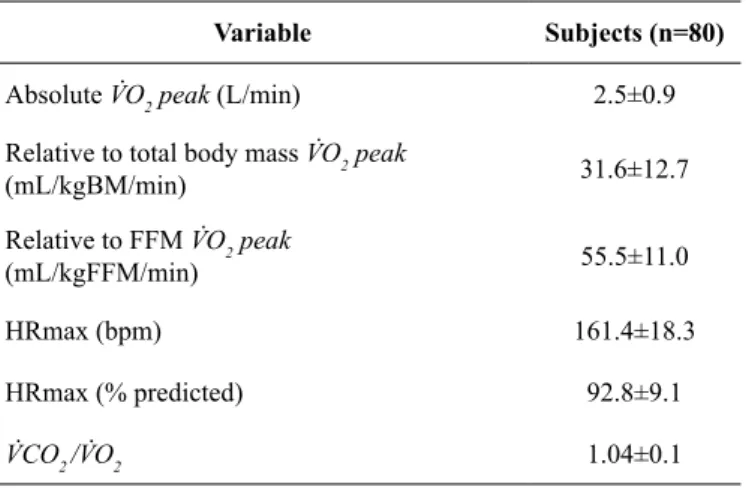
The treadmill performance of the participants is shown in
Table 1. All participants finished the test without intercurrence.
Table 2 presents Pearson coefficient correlations between
V̇O2 peak and total body mass (kg), absolute fat mass (kg), fat free mass (kg) and relative fat mass (%). Absolute fat mass (kg) (r=-0.52, p<0.001), fat free mass (kg) (r=0.83, p<0.001)
and relative fat mass (%) (r=-0.75, p<0.001) showed significant
correlation with absolute values for V̇O2 peak (L/min) (Table 2). When the relationship between V̇O2 peak (L/min) and fat free mass (kg) was analyzed taking into account the fat mass (kg),
the correlation was also classified as high (r=0.83, p<0.001)
(Table 3). We found that V̇O2 peak expressed relative to BM
(mL/kgBM/min) presented a significant and negative correlation
with BM (kg) 0.37, p=0.001), relative fat mass (%) (r=-0.89, p<0.001) and absolute fat mass (kg) (r=-0.80, p<0.001). Moreover, V̇O2 peak expressed relative to BM (mL/kgBM/min)
also presented a significant but positive correlation with fat
free mass (kg) (r=0.57, p<0.001), which was not affected when absolute fat mass (kg) was taking into account (Table 3). As V̇O2 peak expressed relative to BM (mL/kgBM/min), expressed
relative to FFM (mL/kgFFM/min) presented significant and
negative correlation with BM (kg) (r=-0.25, p=0.026), absolute fat mass (kg) (r= -0.50, p<0.001) and relative fat mass (%) (r=-0.56, p<0.001) as showed in Table 2.
Table 2. Pearson coefficient correlation values between and body composition variables (n=80).
Variables V̇O2 peak
(L/min) p value
V̇O2 peak
(ml/kgBM/min) p value
V̇O2 peak
(ml/kgFFM/min) p value
Total body mass (kg) 0.09 0.421 -0.37* 0.001 -0.25* 0.026
Fat mass (kg) -0.52* <0.001 -0.80* <0.001 -0.50* <0.001
Fat free mass (kg) 0.83* <0.001 0.57* <0.001 0.33* 0.003
Fat mass (%) -0.75* <0.001 -0.89* <0.001 -0.56* <0.001
V̇O2 peak: peak oxygen uptake. FFM: fat free mass. *significant correlation.
Table 1. Results obtained from cardiopulmonary exercise test (n=80).
Variable Subjects (n=80)
Absolute V̇O2 peak (L/min) 2.5±0.9 Relative to total body mass V̇O2 peak
(mL/kgBM/min) 31.6±12.7
Relative to FFM V̇O2 peak
(mL/kgFFM/min) 55.5±11.0
HRmax (bpm) 161.4±18.3
HRmax (% predicted) 92.8±9.1
V̇CO2 /V̇O2 1.04±0.1
Discussion
Given that no data are available about the relationship between body composition and different ways to express V̇O2 max/peak (absolute, relative to BM, or relative to FFM) in individuals with different BMI, the main aim of the present study was to verify the relationship between body composition and V̇O2 peak values expressed in different ways. The aim was also to verify if the level of fat mass can affect these
relationships. As was hypothesized, the most relevant finding is
that the fat mass (in kg or in %) negatively affected the highest rate at which oxygen can be used by an individual to perform muscular work (V̇O2 peak in L/min) as well as physical fitness (V̇O2 peak in mL/kgBM/min) and the physiological ability of the tissue to consume oxygen (V̇O2 peak in ml/kgFFM/min).
This finding suggests that the level of fat mass affects exercise
tolerance and the muscular capacity to consume oxygen. Furthermore, individuals presenting higher fat free mass also presented the better V̇O2 peak values (absolute, relative to total body mass, and relative to fat free mass) assessed in this study. However, contrary to our initial hypothesis, higher fat mass did not impair the relationship between V̇O2 peak and FFM, in other words, fat mass is negatively associated with V̇O2 peak, however it did not impair the relationship between V̇O2 peak and FFM. The high positive relationship (r=0.83) between FFM (kg) and V̇O2 peak (L/min) values confirms our initial hypothesis and corroborates the importance of FFM for V̇O2 peak. In the same direction, the relationship between FFM (kg) and V̇O2 peak (L/min) values was not modified when fat mass (kg) was taken into account. These data were expected since FFM demands a greater amount of oxygen than other tissues in the body. On the other hand, Chatterjee, Bandyopadhyay19 showed higher absolute V̇O
2 max in obese
boys than in non-obese boys with similar levels of physical
fitness; this may be explained by a higher muscle mass in the
obese volunteers, but the authors did not present these data. In the present study, fat mass was negatively associated with V̇O2 peak (L/min) however, it is unlikely that this association has a causal relationship. Considering that our individuals with higher fat mass also have lower FFM, it is possible that V̇O2 peak (L/min) presented a significant association with the percentage of fat mass, because individuals with higher fat mass also have less FFM, and lean mass can impair V̇O2 peak (L/min). As such, the lack of change in Pearson correlation between V̇O2 peak (L/min) and FFM (kg) when fat mass (kg)
was taken into account suggests that fat mass has no harmful effect on the maximal rate at which oxygen can be used by an individual.
In order to compare different individuals, with different fat mass, V̇O2 max/peak is commonly presented relative to BM (ml/kgBM/min)11. Our data showed significant high negative relationship between (ml/kgBM/min) and fat mass percentage (r=-0.89) or absolute fat mass (r=-0.80), and these data were in accordance with previous data (r=-0.83 to -0.40)5-10; this indicates that poor body composition implies poor aerobic
physical fitness, or, in others words, poor exercise tolerance. Physical fitness is a set of measurable health and skill-related attributes that include cardiorespiratory fitness, muscular strength and endurance, body composition and flexibility,
balance, agility, reaction time and power20. Barry, Baruth, Beets, Durstine, Liu, Blair21 conducted a meta-analysis to quantify the
joint association of cardiorespiratory fitness and weight status on mortality from all causes and found that the unfit individuals,
those who present lower V̇O2 max (mL/kgBM/min), had twice the risk of mortality regardless of BMI. Moreover, overweight and obese individuals had similar mortality risks as normal
weight-fit individuals. These results suggest not only that obesity and low fitness levels should be considered independent
entities, but also that physical activity programs (mainly strength training) which improve FFM and, consequently, oxygen consumption capacity should be promoted. Indeed, in terms of minimizing the risk of mortality, improving oxygen consumption capacity was more important than simply initiating a program to reduce body mass21.
In order to evaluate the physiological ability of the tissue to uptake oxygen, the V̇O2 peak values should be expressed relative to FFM (ml/kgFFM/min)11. In fact, when the relationship between this variable and body composition was evaluated,
significant associations were detected for fat mass (in kg or in
%) and FFM. Previous studies have argued that obese individuals
have fat mass infiltration within the skeletal muscle, which may
compromise the contractile component of the muscle, impairing strength development22,23. Our data expand this view; the data suggest that higher fat mass was associated with diminished physiological ability of the tissue to uptake oxygen. Conversely, Goran, Fields, Hunter, Herd, Weinsier11 found contradictory
results. These authors did not find a significant association
between V̇O2 max (ml/kgFFM/min) and fat mass; however, they studied children, and it is possible that children’s physiological capacity for oxygen consumption is different from adults’.
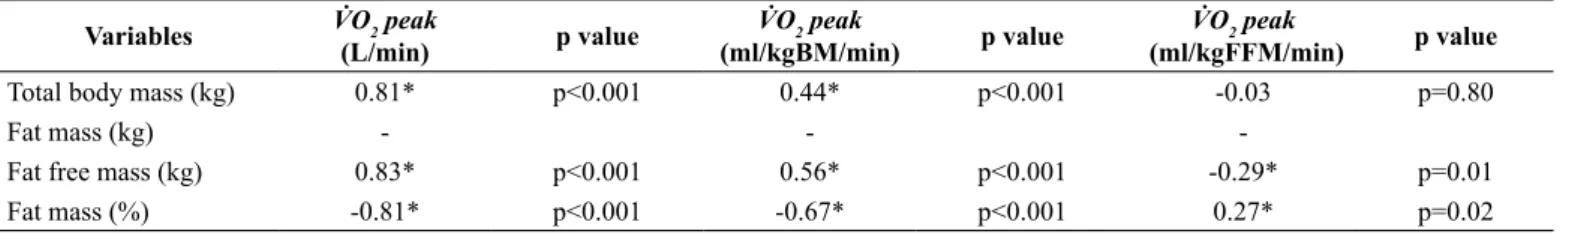
Table 3. Pearson coefficient correlation values between V̇O2 peak and body composition variables (n=80) analyzed taking into account the fat mass.
Variables V̇O2 peak
(L/min) p value
V̇O2 peak
(ml/kgBM/min) p value
V̇O2 peak
(ml/kgFFM/min) p value
Total body mass (kg) 0.81* p<0.001 0.44* p<0.001 -0.03 p=0.80
Fat mass (kg) - -
-Fat free mass (kg) 0.83* p<0.001 0.56* p<0.001 -0.29* p=0.01
Fat mass (%) -0.81* p<0.001 -0.67* p<0.001 0.27* p=0.02
In summary, cardiorespiratory performance, exercise tolerance, and physiological ability of the tissue to uptake oxygen varied according to body composition.
The practical implication of this study is that physical activity programs that improve FFM and reduce fat mass should be considered for obese people. Such programs improve oxygen uptake capacity and prevent the fat mass from impairing the physiological ability of the tissue to uptake oxygen. This matter is very important because there is an inverse relationship between V̇O2 max/peak and mortality from all causes; the relationship was independent of gender and persisted after adjustment for traditional cardiovascular disease (CVD) risk factors (e.g., age, blood cholesterol, blood pressure, obesity, smoking status, family history, blood glucose and type 2 diabetes)24. More recently, Kavanagh et al.25 showed among women referred for cardiac rehabilitation, those with higher V̇O2 peak presented a decrease in mortality by about 50%. In addition, these same authors showed that an increase in V̇O2 peak of 1ml/kg/min was associated with a decrease in cardiac mortality of about 10%.
Conclusion
The physiological ability of tissue to consume oxygen (V̇O2 peak in mL/kgFFM/min) is lower when an individual presents higher fat mass (in kg or in %). The individual’s cardiorespiratory capacity to transport oxygen for working muscles (V̇O2 peak in L/min) is highly associated with absolute FFM, and this association is not affected by the level of individual
fat mass. Finally, aerobic physical fitness (V̇O2 peak in mL/ kgBM/min) is highly associated with fat mass (negatively) and with FFM (positively).
Limitation of the study
In the present study, participants were submitted to a cardiopulmonary exercise test to measure V̇O2 peak, however, skeletal muscle capacity to consume oxygen was not measured, therefore caution should be taken with the interpretation of the results.
References
1. World Health Organization. Available from: http://www.who.int/ mediacentre/factsheets/fs311/en/ [Accessed 25th November 2017]. 2. World Health Organization. Available from: http://www.who. int/dietphysicalactivity/factsheet_inactivity/en/ (Accessed 25th November 2017)
3. Barnes AS. Obesity and sedentary lifestyles: risk for cardiovascular disease in women. Tex Heart Inst J. 2012;39(2):224-7.
4. Dickie K, Micklesfield LK, Chantler S, Lambert EV, Goedecke JH.
Cardiorespiratory fitness and light-intensity physical activity are
independently associated with reduced cardiovascular disease risk in urban black south African women: a cross-sectional study. Metab Syndr Relat Disord. 2016;14(1):23-32. doi: 10.1089/met.2015.0064.
5. Dencker M, Wollmer P, Karlsson MK, Lindén C, Andersen LB, Thorsson O. Body fat, abdominal fat and body fat distribution related to VO(2PEAK) in young children. Int J Pediatr Obes. 2011;6(2-2):e597-602. doi: 10.3109/17477166.2010.526612. 6. Watanabe K, Nakadomo F, Maeda K. Relationship between
body composition and cardiorespiratory fitness in Japanese
junior high school boys and girls. Ann Physiol Anthropol. 1994;13(4):167-74.
7. Franchini E, Nunes AV, Moraes JM, Del Vecchio FB. Physical
fitness and anthropometrical profile of the Brazilian male judo
team. J Physiol Anthropol. 2007;26(2):59-67.
8. Ostojic SM, Stojanovic MD, Stojanovic V, Maric J, Njaradi N.
Correlation between fitness and fatness in 6-14-year old Serbian
school children. J Health Popul Nutr. 2011;29(1):53-60.
9. Wanderley FA, Oliveira J, Mota J, Carvalho MJ. Six-minute walk distance (6MWD) is associated with body fat, systolic blood pres-sure, and rate-pressure product in community dwelling elderly subjects. Arch Gerontol Geriatr. 2011;52(2):206-10. doi: 10.1016/j. archger.2010.03.020.
10. Patkar KU, Joshi AS. Comparison of VO2max in obese and non-obese young Indian population. Indian J Physiol Pharmacol. 2011;55(2):188-92.
11. Goran M, Fields DA, Hunter GR, Herd SL, Weinsier RL. Total
body fat does not influence maximal aerobic capacity. Int J Obes
Relat Metab Disord. 2000;24(7):841-8.
12. Bassett DRJr, Howley ET. Maximal oxygen uptake: “classi-cal” versus “contemporary” viewpoints. Med Sci Sports Exerc. 1997;29(5):591-603.
13. American Thoracic Society; American College of Chest Physicians. ATS/ACCP Statement on cardiopulmonary exercise testing. Am J Respir Crit Care Med. 2003;167(2):211-77.
14. Batterham AM, Vanderburgh PM, Mahar MT, Jackson AS. Modeling the influence of body size on V(O2) peak: ef-fects of model choice and body composition. J Appl Physiol. 1999;87(4):1317-25.
15. Noble BJ, Borg GA, Jacobs I, Ceci R, Kaiser P. A category-ratio perceived exertion scale: relationship to blood and muscle lactates and heart rate. Med Sci Sports Exerc. 1983;15(6):523-8.
16. Howley ET. VO2max and the plateau--needed or not? Med Sci Sports Exerc. 2007;39(1):101-2.
17. Colyer SL, Roberts SP, Robinson JB, Thompson D, Stokes KA, Bilzon, JL, et al. Detecting meaningful body composition changes in athletes using dual-energy x-ray absorptiometry. Physiol Meas. 2016;37(4):596-609. doi: 10.1088/0967-3334/37/4/596. 18. Munro BH, editor. Statistical methods for health care research,
5th ed. Lippincott Williams & Wilkins: Philadelphia, USA, 2005. 19. Chatterjee S, Chatterjee P, Bandyopadhyay A. Cardiorespiratory fitness of obese boys. Indian J Physiol Pharmacol. 2005;49(3):353-7.
20. Caspersen CJ, Powell KE, Christenson GM. Physical activity,
exercise, and physical fitness: definitions and distinctions for
health-related research. Public Health Rep. 1985;100(2):126-31. 21. Barry VW, Baruth M, Beets MW, Durstine JL, Liu J, Blair SN. Fitness
vs. fatness on all-cause mortality: a meta-analysis. Prog Cardiovasc Dis. 2014;56(4):382-90. doi: 10.1016/j.pcad.2013.09.002. 22. Rahemi H, Nigam N, Wakeling JM. The effect of intramuscular
obese. J R Soc Interface. 2015;12(109):20150365. doi: 10.1098/ rsif.2015.0365.
23. Hilton TN, Tuttle LJ, Bohnert KL, Mueller MJ, Sinacore DR.
Excessive adipose tissue infiltration in skeletal muscle in individuals
with obesity, diabetes mellitus, and peripheral neuropathy: associa-tion with performance and funcassocia-tion. Phys Ther. 2008;88(11):1336-44. doi: 10.2522/ptj.20080079.
24. Blair SN, Kohl HW, Paffenbarger Jr RS, Clark DG, Cooper KH,
Gibbons LW. Physical fitness and all-cause mortality. A prospective
study of healthy men and women. JAMA. 1989;262(17):2395-401. 25. Kavanagh T, Mertens DJ, Hamm LF, Beyene J, Kennedy J, Corey P, et al. Peak oxygen intake and cardiac mortality in women referred for cardiac rehabilitation.J Am Coll Cardiol. 2003;42(12):2139-43.
Acknowledgements
We would like to thank FAPESP for the financial support
(grant number: 2013/08245-2), the participants who volunteered their time to participate in the study, and the Olympic Training
and Research Center (Centro Olímpico de Treinamento e Pesquisa - COTP, São Paulo, Brazil).
Corresponding author
Claudio Andre Barbosa de Lira
Faculdade de Educação Física e Dança (FEFD), Universidade Federal de Goiás (UFG), Avenida Esperança s/n, Campus Samambaia. CEP: 74.690-900, Goiânia, Goiás, Brazil.
E-mail: [email protected]
Manuscript received on June 7, 2018 Manuscript accepted on August 14, 2018