Best practices for pervious concrete mix design
and laboratory tests
Boas práticas para dosagem e testes laboratoriais
em concreto permeável
a Federal University of Pampa, Alegrete, RS, Brazil;
b Department of Civil Engineering, Federal University of Rio Grande do Sul, Porto Alegre, RS, Brazil; c Department of Civil and Environmental Engineering, Lamar University, Beaumont, United States.
Received: 23 Nov 2017 • Accepted: 22 Mar 2018 • Available Online:
F. B. P. COSTA a, b
A. LORENZI b
L. HASELBACH c
L. C. P. SILVA FILHO b
Abstract
Resumo
Pervious concrete may be used for stormwater management since it allows the water to pass through its interconnected macropores into storm-water systems or soils below. However, there is a need for additional standards related to pervious concrete prior to its widespread use, and there are many aspects related to mix design for desired properties, compaction methods, and test procedures that are not yet completely understood. These variables may significantly affect the functional and mechanical performance of the material. In this paper, mix designs and test specimen preparation techniques were evaluated. The IBRACON method for mixture design was used to obtain the mixture proportions and the calculated density for the desired porosity of 25%. In addition, two different types of specimens (cast or cored) and compaction methods (roller or Proctor hammer compacted) were performed. The density of each specimen was controlled to obtain the same calculated density. Several tests were conducted to compare the following variables: density, porosity, surface infiltration rate, permeability and compressive strength. Additionally, the effects of mortar capping versus neoprene-rubber caps on compressive strength measurements of pervious concrete were evaluated. The experi-mental results showed that cast specimens have more consistent results than cores. The design method studied with strict control of density was efficient to obtain the desired porosity mainly for cast specimens. The roller leads to a more compacted top surface resulting in a decrease in the infiltration rate and permeability of the cores. The mortar capping method is more consistent than the other.
Keywords: pervious concrete, mix design, laboratory procedures, compaction method.
O concreto permeável é um material de potencial para ser utilizado no gerenciamento de águas pluviais, uma vez que permite a percolação da água através de seus macroporos interconectados, seja para sistemas de águas pluviais ou para o próprio solo. No entanto, há uma ne-cessidade de normas adicionais relacionadas ao material para seu uso difundido e, ainda, há muitos aspectos relacionados aos parâmetros de dosagem para propriedades desejadas/projetadas, método de compactação e procedimentos laboratoriais, que ainda não foram com-pletamente compreendidos. Tais variáveis podem afetar significativamente o desempenho funcional em termos hidráulicos e mecânicos do material. Neste trabalho, o método do IPT/EPUSP para dosagem foi utilizado para obter as proporções de mistura e a densidade calculada, para uma porosidade desejada de 25%. Além disso, dois tipos diferentes de amostras (moldadas e extraídas) e métodos de compactação (Proctor e rolo) foram realizados. A densidade de cada amostra foi controlada para obter a mesma densidade calculada. Diversos testes foram realizados para comparar as seguintes variáveis: densidade, porosidade, taxa de infiltração, permeabilidade e resistência à compressão. Além disso, foram avaliados os efeitos do tipo de capeamento (com argamassa e com borracha de Neoprene) nos corpos de prova submetidos ao ensaio de compressão. Os resultados experimentais mostram que os corpos de prova moldados apresentam resultados mais consistentes que as amostras extraídas. O método de dosagem, com controle rigoroso da densidade, foi eficiente para obtenção da porosidade desejada, principalmente para os corpos de prova moldados. O rolo conduz a uma superfície superior mais compacta, o que resulta na diminuição da taxa de infiltração e permeabilidade para as amostras extraídas. O capeamento dos corpos de prova com argamassa apresenta resultados mais consistentes.
1. Introduction
Pervious concrete (PC) is a special type of concrete pavement mainly composed of narrowly graded coarse aggregate and ce-mentitious materials, which provides an interconnected macropore internal structure [1-4]. The volume of connected pores is typical-ly in the range of 15-35% sufficient to facilitate the flow of water through the pavement layer [1,2,4]. PC is increasingly used in the United States and Japan due to its environmental benefits, such as controlling stormwater runoff, restoring groundwater supplies, and reducing water and soil pollution [1]. In addition, it can reduce urban heat island effects and acoustic noise in roads [5,6]. PC is not usually as strong as traditional concrete for similar mix-es and thicknmix-essmix-es. The pore structurmix-es that allow water to flow through the material also decrease its strength [7]. As the strength of PC depends mainly on its porosity, which can vary throughout, its structural performance is more variable than traditional concrete [8]. Therefore, the use of PC is typically restricted to lower-strength applications, such as sidewalks, parking lots, recreational spac-es and subbasspac-es for conventional pavements. Furthermore, the implementation of PC as a pavement material in many countries (especially emerging countries) is limited due to the lack of stan-dardized techniques for material preparation and testing, and also construction practices [9].
Currently, PC mixtures are proportioned to achieve a design range of porosity in order to achieve an initial water permeability of the pavement, while maintaining sufficient mechanical performance. The associated pore size characteristics with a usual range of 2 to 8 mm are then related to the aggregate type, size and distribution, and the method of compaction [2].
Some current methods used for design of PC mixtures are from the American Concrete Institute [2], Zouaghi’s method [10], Zheng method [11], Nguyen’s method [12], and Taguchi’s method [13]. These design methods consider different parameters. Some of them do not take into account the water to cementitious (w/c) ratio and the effect of compaction on the properties of PC, etc. This leads to a non-standard mixture proportion application. In this study, the IBRACON method [14] is used to determine the mix proportions of PC. As well known, the method is simple and gives the cement content, aggregate content, water content, and density of the fresh
mixture. The method can be applied to any concrete with a slump of zero mm to self-compacting concrete. The difference in applying this method from traditional concrete to PC is considering in the cement consumption equation the desired porosity. Although mix-ture proportioning is a major contributing factor, the compaction ef-fort also directly affects the porosity [15]. As mentioned by Ibrahim
et al. [7], it is important to emphasize that the desired porosity is achieved by both factors, i.e. controlling the aggregate proportions and properties, as well controlling the level of compactive effort. The conventional methods used in traditional concrete are not rec-ommended to apply to PC mixtures as they may not be representa-tive and consistent. For instance, the casting technique using a rod has been found to be inappropriate for laboratory PC specimens [16]. At present there is no standard test method to evaluate the compressive and flexural strength of PC. One suggested method considers a cylindrical traditional sample size (10x20 cm) with a compact effort of the fresh mixture in two layers providing twenty blows per layer using the standard Proctor hammer [8]. Accord-ing to Chandrappa et al. [9], this method can cause the crushing/ breaking of the coarse aggregate near the top surface due to the impact generated by the Proctor hammer. Additionally, it can result in an inaccurate representation, since the compaction method of PC pavement in situ is made with a roller in only a single layer. On the other hand, this method may reduce the scatter in the test re-sults due to the decrease of vertical porosity effect [16]. According to Gaedicke et al. [17], the use of a Proctor hammer to compact PC has shown more consistent results.
The Proctor hammer has been used to compact specimens in dif-ferent ways, i.e. using difdif-ferent types of specimens, blows, and lifts [17-22]. There is a lack of studies that compare cast and cored specimens compacted using the Proctor hammer as recently pro-posed and rolled specimens to represent in situ situations. In this
context, research needs to be conducted to evaluate and compare both of the design and compaction methods that have been men-tioned. Therefore, we aim to (i) simplify the design of PC mixtures
utilizing the IBRACON method for mixture proportion; (ii) verify the
efficiency of the design method for both cast and cored specimens in order to obtain the desired density and porosity; (iii) correlate
results by the different compaction methods (Proctor and roller) of cast and cored specimens; and (iv) determine the effects of
mor-tar capping and neoprene-rubber on compressive strength mea-surements of PC. In the present paper, we also show an adapted method to determine the infiltration of PC cylindrical specimens. With the results obtained in this paper, we intend to provide a com-parison between laboratory techniques and the unique variations.
2. Materials and experimental program
2.1 Materials and mix design
The materials used in the PC mixtures included high early Port-land cement (CP-V ARI MAX), basalt aggregate and a rheology-modifying admixture for PC. The aggregate used in this research has a lamellar shape and it is composed of 30% of fines (< 4.75 mm). A previous study has shown that this aggregate does not impact the hydraulic functionality of PC [23]. The aggregate grad-ing curve is shown in Figure 1. The nominal maximum size is
Figure 1
Particle-size distribution of aggregate
020 40 60 80 100
1 10 100
Accumulated
retained
(%)
12.5 mm, the specific gravity is 2.80 g/cm³, and the water absorp-tion is 1.3%. The coarse aggregate was incorporated into the mix-ture in a dry condition. The rheology-modifying admixmix-ture used provides a delay of the setting time, and more workability. The ad-mixture is in accordance with the requirements of ASTM C494 [24] as a Type D water-reducer and retarder.
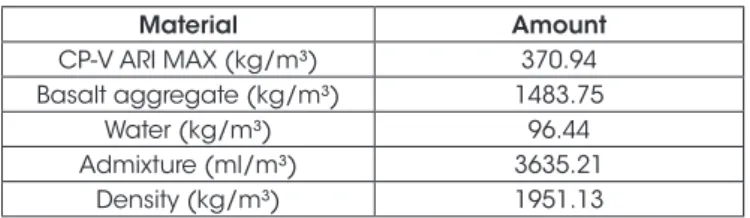
The PC mix proportions were determined using the IBRACON method for a target porosity of 25%. The mass-based aggregate to cementitious material ratio was 4, and the mass-based water to ce-mentitious material ratio (w/c) was 0.26 (minimum recommended by ACI 522-R-10 [2]). The admixture dosage used was 980 ml per 100 kg of cementitious material according to the producer’s speci-fication. The final PC mixture design is shown in Table 1.
The PC mixture was prepared in a standard concrete mixer with a capacity of 120 liters. The coarse aggregate with a little of the wa-ter was first mixed, and then, afwa-ter a rapid mixing of these mawa-teri- materi-als, the remaining water and the admixture were slowly added. Af-ter that, the PC mixture was additionally mixed for about 3 minutes. This mixing sequence was obtained from previous studies per-formed by the technical group in the laboratory (LEME/UFRGS), in which it was realized that if the all dry materials were placed in the mixer, the subsequent addition of water causes them to stick to the walls of the mixer. Thus, a portion of the water is added to the ag-gregate so that, when the cement is added, a more homogeneous mixture is obtained with a small amount of the cementing paste sticking to the walls of the mixer. The consistency of the PC mixture obtained in this research is illustrated in Figure 2.
2.2 Preparation of specimens
One slab (650 mm length x 450 mm width x 200 mm height) and six cylindrical specimens (200 mm length and 100 mm diameter) were cast. The slab was intended to have cores extracted and was compacted using a roller of 48.8 kg/m simulating an in situ
compac-tion method. The weight of the slab was controlled to obtain the calculated density shown in Table 1. A total of six cored samples were extracted from the concrete slab to represent the in-place properties of the material. The compaction method used on the cast cylindrical specimens was 20 blows in two layers using a 2.5 kg standard Proctor hammer as previously mentioned. The total compaction impact by the Proctor hammer is 50 kg per layer. The weight of each cylindrical specimen based on the calculated den-sity was obtained with this compaction method. The calculated density is shown in Table 1. It is important to emphasize that in pre-vious study evaluated in the laboratory, for densities above 2000 kg/m³, the Proctor hammer compacting method of 20 blows per layer is not effective enough to achieve the desired density and, consequently, the desired porosity. Depending on the materials used in the PC mixture, it could be necessary more than 20 blows to achieve the desired density. The slab and cylindrical specimens were demolded after 48 hours and cured for 28 days at ambient temperature (about 24±2 °C) and a relative humidity of 50±5%. The cores samples were extracted 7 days before testing.
2.3 Test procedures
2.3.1 Fresh and hardened density
The fresh density was determined for the cast cylindrical speci-mens. The mass of each PC specimen compacted with the Proc-tor hammer was measured immediately after casting. The fresh density was calculated as described in ASTM C1688 [25]. The hardened density for the cast cylindrical specimens and the cores was calculated according to ASTM C1754 [26]. The masses of both the cast cylindrical specimens and cores were measured and then divided by each specimen bulk volume. This procedure was performed at the age of 27 days (1 day before the compres-sive strength tests).
2.3.2 Porosity
The porosity of the cast cylindrical specimens and cores was ob-tained according to ASTM C1754 [26]. The procedure was also carried out at the age of 27 days. After measuring their dry masses, the cast and cored specimens were submerged in a water bath for 30 minutes. The submerged masses were measured with a hy-drostatic balance. The volume of the specimens was determined based on their dimensions measured using a caliper. The porosity (P) was then calculated following the equation:
(1)
where Md is the dry mass of the specimen in g, Ms is the submerged mass of the specimen in g, ρw is the density of water g/cm³, and V is the volume of the specimen in cm³.
Table 1
PC mix proportion
Material Amount
CP-V ARI MAX (kg/m³) 370.94 Basalt aggregate (kg/m³) 1483.75
Water (kg/m³) 96.44
Admixture (ml/m³) 3635.21 Density (kg/m³) 1951.13
Figure 2
2.3.3 Infiltration rate
Infiltration rate is an important property that is critical for storm-water management application. Therefore, the infiltration rate was measured in two different ways. The traditional infiltration rate test was carried out following the procedures of ASTM C1701 [27]. This test method was performed on the slab specimen at the age of
7-days (one week before cores extraction). A plastic infiltration ring (with a diameter of 300 mm and a height of 50 mm) was placed at the center of the slab to measure the water infiltration rate in the PC. The bottom edge of the ring was fixed in the PC slab sur-face with a plumber’s putty (Figure 3). Then, a prewetting test was evaluated using a total of 3.60 kg of water, which was placed into the ring and maintained between the two marked lines inside the ring (10 and 15 mm). The time recorded was equal to the time the water impacted the PC surface until free water is no longer present on the PC surface. As the elapsed time in the prewetting was less than 30 s, a total of 18 kg of water was used in the test. The test was then repeated three times to obtain an average time to deter-mine the infiltration rate.
For the cast cylindrical specimens, an infiltration test was performed using shrink-wrap to seal the sides of the speci-mens (Figure 4). Two lines of 10 and 15 mm was also marked above the PC surface, inside the shrink-wrap, to maintain the water head during the test. The quantity of water was adapted from the recommended by the ASTM C1701 [27] to the diam-eter of 100 mm corresponding to the specimen. The prewet-ting was also performed with 1.2 kg of water. As the elapsed time in the prewetting was less than 30 s, a total of 6 kg of water was used in the test. The test was then repeated three times to obtain an average time to determine the infiltration rate. After cored extraction, this same procedure used for the cast specimens was carried out and compared to the results obtained for the slab. This test was performed at the age of 27 days.
Figure 3
Infiltration test preparation on slab specimen
according to ASTM C1701
Figure 4
Infiltration test preparation on cylindrical specimen
using a shrink-wrap
Figure 5
In both cases (slab and cylindrical specimens), infiltration rate (I) was determined according to the following equation:
(2)
where M is the mass of infiltrated water in kg, D is the diameter of infiltration in mm, t is the recorded time related to the water infiltra-tion in s, and K is factor needed to convert the recorded data, with a value of 4583666000 in SI units.
2.3.4 Permeability
A falling-head method may also be used to measure permeability in PC [28]. For the test, a falling-head permeameter was designed in the laboratory as showed in Figure 5. The cast and cored speci-mens were wrapped with a flexible polyethylene foam membrane to impede water infiltration between the surface of the sample and the apparatus. The test was performed at the age of 27 days. Each specimen was carefully placed in the permeameter. The time for the water to flow through the samples was recorded at the initial (h1) and final (h2) levels marked in the permeameter. The coefficient of permeability (K) was calculated using Darcy’s law as given below:
(3)
where a is the cross-sectional area of standpipe in cm², L is the length of sample in cm, A is the cross-sectional area of the sample in cm², t is the recorded time from h1 to h2 in s, h1 is the initial water level equal to 27 cm, and h2 is the final water level equal to 5 cm.
2.3.5 Compressive strength
The compressive strength tests were performed according to ABNT NBR 5739 [29] at the age of 28 days. As the PC specimens have an irregular surface due to aggregate overhang, two proce-dures for the compressive strength test were considered. The first one was using neoprene-rubber pads at the specimen ends and the other one was capping the surfaces with a polymeric mortar. The objective is to evaluate the more effective method to the
distri-bution of the compression force. Three specimens from the casts and cores of the total six were used for each procedure.
3. Results and discussions
3.1 Fresh
vs.
hardened density for cast specimens
The fresh density was measured for the cast cylindrical specimens since it was not possible to evaluate the fresh density for the cored specimens, which were extracted from the slab once hardened. The fresh density was measured immediately after casting. The re-lation between fresh and hardened density for the cast specimens is shown in Figure 6. It can be observed that the fresh density was slightly higher than the hardened density as expected. This fact is attributed to the water loss by the hydration products. In the graph, the following regression equation was obtained:
(4)
where Dh and Df are the hardened and fresh density for PC cast cylindrical specimens, respectively. Since R² is close to 1.0, the average decrease in the hardened density is 0.43%. The designed (theoretical) density was 1950 kg/m³ and the average fresh density obtained was 1975 kg/m³, which represents an average difference of only 1.21%. This fact demonstrates that the design method and compaction method were efficient in obtaining the desired density for the mix design analyzed.
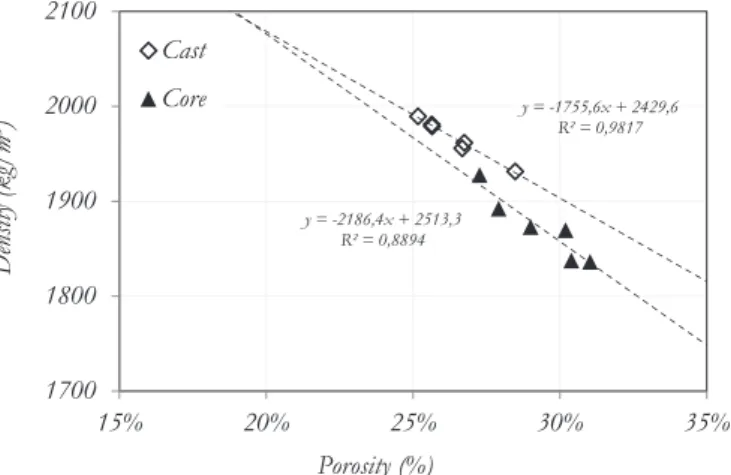
3.2 Hardened density vs. porosity
Figure 7 shows hardened density over porosity for the cast and cored specimens. It can be observed that the relation between the hardened density and porosity was affected by the compaction method. The linear curves had a different slope. The cast speci-mens showed a hardened density and porosity near to the desired. On the other hand, the cores specimens showed lower densities and, consequently, higher porosities. Further verification analyses with ANOVA confirmed that the cast and cored specimens are not similar in relation to density and porosity considering this method
Figure 6
Fresh density
vs.
hardened density of cast
cylindrical specimens
R² = 0,9811
1800 1850 1900 1950 2000 2050 2100
1800 1850 1900 1950 2000 2050 2100
Fr
esh
dens
ity
(kg/m
³)
Hardened density (kg/m³)
Figure 7
Hardened density vs. porosity of cast
and cored specimens
y = -1755,6x + 2429,6 R² = 0,9817
y = -2186,4x + 2513,3 R² = 0,8894
1700 1800 1900 2000 2100
15% 20% 25% 30% 35%
Density (kg
/m³)
Porosity (%) Cast
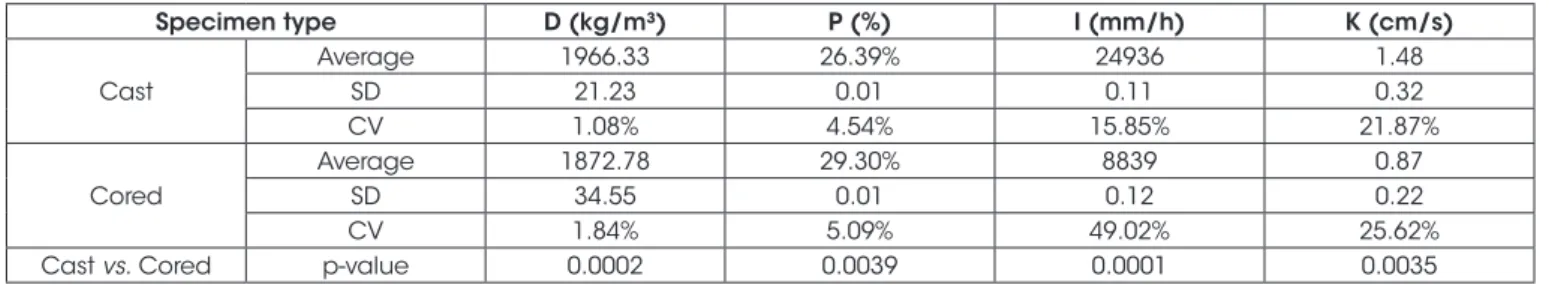
of compaction. The summary statistical results obtained for each cast and cored specimens are shown in Table 2.
3.3 Infiltration rate vs. porosity
The infiltration rate was measured in the slab before cored extrac-tion. The average value between the three readings performed was 0.35 cm/s. Figure 8 shows the infiltration rate versus porosity for cast and cored specimens that was measured using the shrink-wrap. The dotted line in the graph represents the slab infiltration rate. It can be seen that the difference in the infiltration rate between the cast and cores specimens is quite evident, even when the porosity is in the same range. There is more variability in the results obtained for cores than cast specimens. The increase in porosity may not result in an increase in the infiltration rate for the cores. This fact can be attributed to the compaction method. The roller leads to a more com-pacted surface, which can restrict the passage of water on the top surface, reducing the infiltration rate. Figure 9 shows the effect of the compaction method on the specimen appearance. It is possible to note that the compaction method has a direct influence on the pore connectivity and tortuosity (mainly on the top). In previous studies, cores that were compacted in one single lift, the porosity increased along the depth [30]. This fact can justify the lower infiltration rate but with an increase in the porosity.
The statistical results of infiltration rate obtained for each cast and cored specimen are listed in Table 2. The higher coefficient of
vari-ation (CV) obtained for cores confirms the variability in the results. The R² obtained on the graph demonstrate that only 52% of the dependent variable can be explained by the linear regression in the model. This may be attributed to the contact area of the roller. During the initial pass of the roller, the contact area is large and decreases for subsequent passes, which produces low compac-tion pressure during the initial pass and increase for later passes [31]. The differences in the pressure caused by the roller passing may be the reason for the differences in infiltration rate obtained between the cores. This means that in some parts of the slab, a more compacted surface can be obtained than other parts, which makes some cores with less infiltration on the surface.
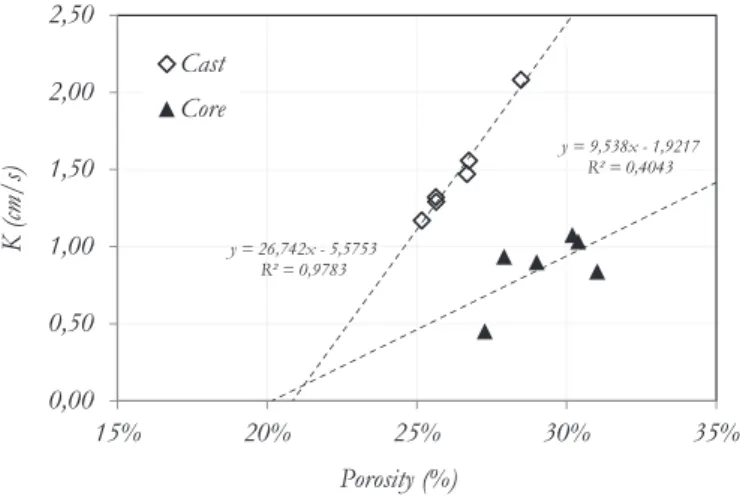
3.4 Permeability vs. porosity
Figure 10 shows the permeability versus porosity for cast and cored specimens. The model for permeability vs. porosity is also represented by a linear relationship. The difference in the perme-ability between the cast and cored specimens is also evident, even
Table 2
Statistical results for cast and cored specimens (physical and hydraulic properties)
Specimen type D (kg/m³) P (%) I (mm/h) K (cm/s)
Cast
Average 1966.33 26.39% 24936 1.48
SD 21.23 0.01 0.11 0.32
CV 1.08% 4.54% 15.85% 21.87%
Cored
Average 1872.78 29.30% 8839 0.87
SD 34.55 0.01 0.12 0.22
CV 1.84% 5.09% 49.02% 25.62%
Cast vs. Cored p-value 0.0002 0.0039 0.0001 0.0035
Figure 8
Infiltration rate
vs.
porosity of cast
and cored specimens
y = 295475x - 53035 R² = 0,8021
y = 210045x - 52696 R² = 0,5211
0 5000 10000 15000 20000 25000 30000 35000 40000
15% 20% 25% 30% 35%
I (mm/h)
Porosity (%) Cast
Core Slab
Figure 9
when the porosity is in the same range. Like observed in infiltra-tion rate, there is more variability in the results obtained for cores than cast specimens. The same reason that justifies the infiltration rate results can explain the results obtained for the permeability test. The permeability in the cores decreases due to the use of the roller, which increases the compaction on the slab top surface. The cored top surface is less permeable even though the porosity is higher, which is conferred by the bottom part of the specimen. The cast and cores specimens showed a permeability range of 1.17 to 2.08 cm/s and 0.84 to 1.08 cm/s, respectively. Both ranges are in accordance to the ones observed by other authors in the literature using the falling-head apparatus. Schaefer et al. [32]
ob-tained a measured hydraulic conductivity ranged between about 0.01 cm/s and 1.5 cm/s. Montes and Haselbach [33] obtained a range between 0.014 cm/s and 1.19 cm/s. Table 2 shows the sta-tistical results of permeability obtained for each cast and cored specimens. For both, the CV obtained was over 20%. However, by the graph, the R² for cast specimens is 0.97, which indicates that the relationship between the permeability and porosity for the cast specimens is well-represented by the linear model. On the other hand, the model is not representative for the cores, since only 40% of the dependent variable can be explained by the linear regres-sion. The differences in the pressure caused by the roller passing can also be the reason for the results variability.
3.5 Compressive strength vs. porosity
and the effect of capping method
Figure 11 shows the compressive strength over porosity for cast and cores considering both mortar capping and the use of neo-prene-rubber. Of the total six, three specimens were used for each technique to the compressive test. It can be observed that regard-less the method used, the compressive strength of cast specimens is higher than cores. This fact can possibly be attributed to the decrease in the vertical porosity by the compaction method using the Proctor hammer.
The technique used for the compressive test is also another factor that directly influences the compressive strength. It must be con-sidered that due to the non-regularization surface of the pervious concrete specimen the results are very affected. In some cases, this might cause a stress concentration point during the compressive test and, consequently, change the fracture behavior of the sample. This fact is highlighted for the cores. When extracted, the bottom surface may be damaged by the hole saw because of its higher porosity. The results showed in Figure 11 confirms the influence of mortar capping and the use of neoprene-rubber. Table 3 shows the statistical results for compressive strength considering both tech-niques. The p-value obtained with ANOVA shows that the use of
Figure 10
Infiltration rate
vs.
porosity of cast and cored
specimens
y = 26,742x - 5,5753 R² = 0,9783
y = 9,538x - 1,9217 R² = 0,4043
0,00 0,50 1,00 1,50 2,00 2,50
15% 20% 25% 30% 35%
K (cm/s)
Porosity (%) Cast
Core
Figure 11
Compressive strength
vs.
porosity of cast and
cored specimens by capping method
0 2 4 6 8 10 12 14
15% 20% 25% 30% 35%
Compr
essi
ve
str
eng
th
(MP
a)
Porosity (%)
Cast-Neoprene Cast-Mortar Core-Neoprene Core-Mortar
Table 3
Statistical results for compressive strength of cast and cored specimens
Specimen type Mortar capping Neoprene-rubber
Cast
Average 10.06 11.63
SD 1.07 0.57
CV 10.60% 4.91%
Mortar vs. Neoprene p-value 0.0884
Cored
Average 3.31 7.54
SD 0.36 0.54
CV 10.87% 7.16%
mortar capping and neoprene-rubber are not similar in relation to the compressive strength for cores, but can be considered not sig-nificative for the cast specimens (p-value > 0,05). Thus, there is no significative influence on the technique applied to cast specimens on the compressive strength. Figure 12 shows an example of the speci-men rupture by the technique applied. When the specispeci-mens are not capped with mortar, the use of neoprene-rubber is not enough to distribute the compression force, causing a local rupture.
4. Conclusions
The present paper was conducted to evaluate the influence of laboratory methods used in order to obtain desired properties of PC and to compare two types of compaction methods in cast and cored specimens. This study contributes to the understanding of the variability in the results in studies on pervious concrete speci-mens based on several different laboratory methods used. Thus, the following conclusions may be drawn:
n The design method studied with strict control of density was
ef-ficient in order to obtain the porosity mainly for cast specimens. The average porosity obtained for the cast and cores was 26.39% (only 1.39% higher than desired value), and 29.30%, respectively. The desired value of porosity is more difficult to obtain for the cores due to the horizontal variability in the slab and also due to not being able to as effectively control density as in a cast specimen. Care must be taken during the speci-mens casting (i.e. controlling their masses) in order to obtain the density, and consequently, the desired porosity;
n The roller leads to a more compacted top surface compared to
the Proctor hammer, which decreases the infiltration rate and permeability of the specimens. Besides, using only
single-lift-compacted specimen results in differences in vertical porosity. This fact is important to in situ situations to facilitate the perco-lation of water between the PC pavement and the base layer but can cause more variability data for laboratory analysis. This compaction method also generates differences in the pressure caused by the roller passing, which also causes variations in the results between cores. In real life applications, the differences in vertical porosity of the pervious concrete pavement are impor-tant when it comes to maintenance in service life. When it gets clogged, the top surface is easier to get clean while the interfa-cial area between the pavement and the base layer is not pos-sible to access. Thus, a higher porosity on the bottom facilitates the percolation of water and sedimentation particles;
n Proctor-hammer-compacted cylinders presented more consis-tent results due to a more uniform vertical porosity. This meth-od was well-represented by the linear mmeth-odels utilized on all graphs, which facilitates properties estimation;
n The use of neoprene-rubber to distribute the compressive
stresses in the specimens is not recommended for cores. The technique of using mortar capping leads to a more regular sur-face and enables the uniform distribution of compressive stress-es in the specimens. However, both techniqustress-es can be used for cast specimens due to the more regular surface obtained with the compaction method, facilitating laboratory procedures. In sum, the compaction method using the roller is more representa-tive of the in situ procedures. However, by using Proctor-hammer-compacted cylinders, it is possible to reduce the variation coefficient and enable the comparison of other variables – such as the incor-poration of fibers, admixtures and supplementary cementitious ma-terials. Besides, it is easier to produce in the laboratory than cored extraction. Finally, it is important to emphasize that the results pre-sented in this paper are valid only for the mix analyzed and cannot be extrapolated to other mixes unless studied previously.
5. Acknowledgements
The authors would like to thank the Laboratory of Test and Struc-tural Models (LEME) of the Federal University of Rio Grande do Sul (UFRGS) where the experimental tests and analyses were conducted. The authors also would like to acknowledge the support of FAPERGS through PRONEX program, which financed the creation and operation of NEXCES, UFRGS´s Excellence Center for Special Concretes.
6. References
[1] TENNIS, P.D.; LEMING, M.L.; AKERS, D.J. Pervious Con-crete Pavements. EB302. Portland Cement Association, Skokie, Illinois, 2004. 36 p.
[2] ACI 522R-10. Report on pervious concrete. American Con-crete Institute, 2010.
[3] NEITHALATH, N.; SUMANASOORIYA, M. S.; DEO, O. Characterizing pore volume, sizes, and connectivity in pervi-ous concretes for permeability prediction. Materials Charac-terization, v.61, 2010, p.802–813.
[4] YAHIA, A.; KABAGIRE, D. New approach to proportion per-vious concrete, Construction and Building Materials, v.62, 2014, p.38–46.
Figure 12
The influence of technique applied
to compressive test
(a) Not capped (neoprene-rubber)
[5] YANG, J.; JIANG, G. Experimental study on properties of pervious concrete pavement materials. Cement and Con-crete Research, v.33, 2003, p.381-386.
[6] LORENZI, A.; HASELBACH, L.; SILVA FILHO, L. C. Field data for heat island mitigation by pervious concrete in Porto Alegre. In: Proceedings of the 3rd International Conference
on Best Practices for Concrete Pavements, 2015, p. 1-11. [7] IBRAHIM, A.; MAHMOUD, E.; YAMIN, M.; PATIBANDLA,
V. C. Experimental study on Portland cement pervious con-crete mechanical and hydrological properties. Construction and Building Materials, v.50, 2014, p.524-529.
[8] CROUCH, L. K.; CATES, M. A.; DOTSON. V. J.; HONEYC-UTT, K. R.; BADOE, D. Measuring the effective air void con-tent of Portland cement pervious pavements. Cement and Concrete Aggregates, v.25, n.1, 2003, p.16–20.
[9] CHANDRAPPA, A. K.; BILIGIRI, K. P. Pervious concrete as a sustainable pavement material – Research findings and future prospects: A state-of-the-art review. Construction and Building Materials, v.111, 2016, p.262-274.
[10] ZOUAGHI, A. Technological problems of multi-performance porous concrete. In: Proceedings of the 1st fib congress,
2002, p. 233–42.
[11] ZHENG, M.; CHEN ,S.; WANG, B. Mix design method for permeable base of porous concrete. International Journal of Pavement Research Technology, v.5, 2012, p.102-7. [12] NGUYEN, D. H.; SEBAIBI, N.; BOUTOUIL, M.; LELEYTER,
L.; BARAUD, F. A modified method for the design of pervi-ous concrete mix. Construction and Building Materials, v.73, 2014, p.271-282.
[13] JOSHAGHANI, A.; RAMEZANIANPOUR, A. A.; ATAEI, O.; GOLROO, A. Optimizing pervious concrete pavement mix-ture design by using the Taguchi method. Construction and Building Materials, v.101, 2015, p.317-325.
[14] HELENE, P.R.L.; TERZIAN, P. Manual de Dosagem e Con-trole do Concreto. São Paulo: PINI, 349p., 1992.
[15] DEO, O.; NEITHALATH, N. Compressive behavior of pervi-ous concretes and a quantification of the influence of ran-dom pore structure features. Material Science & Engineer-ing, v.528, n.1, 2010, p.402–12.
[16] Haselbach, L.; Freeman, R. Vertical Porosity Distributions in Pervious Concrete Pavement. ACI Materials Journal, v.103, n.6, 2006, p.452-458.
[17] GAEDICKE, C.; MARINES, A.; MIANKODILA, F. A method for comparing cores and cast cylinders in virgin and recycled aggregate pervious concrete. Construction and Building Ma-terials, v.52, 2014, p.494-503.
[18] RIZVI, R.; TIGHE, S. L.; HENDERSON, V.; NORRIS, J. Laboratory sample preparation techniques for pervious con-crete. In: Procedures of 88th annual meeting transportation
research board, 2009, 16 pp.
[19] SUMANASOORIYA, M. S.; NEITHALATH, N. Pore structure features of pervious concrete proportioned for desired po-rosities and their performance prediction. Cement & Con-crete Composites, v.33, 2011, p. 778-787.
[20] PUTMAN, B. J.; NEPTUNE, A. I. Comparison of test specimen preparation techniques for pervious concrete pavements. Con-struction and Building Materials, v. 25, n.8, 2011, pp. 3480-3485.
[21] DEO, O.; NEITHALATH, N. Compressive response of pervi-ous concretes proportioned for desired porosities. Construc-tion and Building Materials, v.25, n.11, pp. 4181-4189. [22] TORRES, A.; HU, J.; RAMOS, A. The effect of the
cementi-tious paste thickness on the performance of pervious con-crete. Construction and Building Materials, v.95, n.1, 2015, pp. 850-859.
[23] HASELBACH, L.; DUTRA, V. P.; SCHWETZ, P.; SILVA FIL-HO, L. C. P. A pervious concrete mix design based on clog-ging performance in Rio Grande do Sul. In: 3rd International
Conference on Best Practices for Concrete Pavements, Bo-nito, 2015, Anais, 2015.
[24] AMERICAN SOCIETY FOR TESTING AND MATERIALS. ASTM C494 / C494M-17, Standard Specification for Chemi-cal Admixtures for Concrete, ASTM International, West Con-shohocken, PA, 2017.
[25] AMERICAN SOCIETY FOR TESTING AND MATERIALS. ASTM C1688 / C1688M-14a, Standard Test Method for Den-sity and Void Content of Freshly Mixed Pervious Concrete, ASTM International, West Conshohocken, PA, 2014. [26] AMERICAN SOCIETY FOR TESTING AND MATERIALS.
ASTM C1754 / C1754M-12, Standard Test Method for Density and Void Content of Hardened Pervious Concrete, ASTM International, West Conshohocken, PA, 2012. [27] AMERICAN SOCIETY FOR TESTING AND MATERIALS.
ASTM C1701 / C1701M-17a, Standard Test Method for In-filtration Rate of In Place Pervious Concrete, ASTM Interna-tional, West Conshohocken, PA, 2017.
[28] KEVERN, J. T.; SCHAEFER, V. R.; WANG, K.; SULEIMAN, M. T. Pervious concrete mixture proportions for improved freeze-thaw durability. Journal of ASTM International, v.5, n.2, 2008, 12 pp.
[29] ASSOCIAÇÃO BRASILEIRA DE NORMAS TÉCNICAS. NBR 5739, Concreto – Ensaio de compressão de corpos de prova cilíndricos, Rio de Janeiro, 2007.
[30] MARTIN III, W. D.; KAYE, N. B.; PUTMAN, B. J. Impact of vertical porosity distribution on the permeability of pervious concrete. Construction and Building Materials, v.59, 2014, p.78– 84.
[31] KEVERN, J. T.; SCHAEFER, V. R.; WANG, K. Evaluation of pervious concrete workability using gyratory compaction. Journal of Materials in Civil Engineering, vol.21, n.12, 2009, 19 pp.
[32] MONTES, F.; HASELBACH, L. Measuring hydraulic conduc-tivity in pervious concrete. Environmental Engineering Sci-ence, v.23, n.6, 2006, p.960-969.