Printed in Brazil - ©2007 Sociedade Brasileira de Química 0103 - 5053 $6.00+0.00
ArticleArticleArticleArticleArticle
*e-mail: [email protected]
Corrosion Study of Electrodeposited Zn and Zn-Co Coatings in Chloride Medium
Pedro De Lima-Neto,* Adriana N. Correia, Regilany P. Colares and Walney S. Araujo
Departamento de Química Analítica e Físico-Química, Universidade Federal do Ceará, Campus do Pici, Bloco 940, 60455-970 Fortaleza-CE, Brazil
A corrosão de eletrodepósitos de Zn e Zn-Co em solução aquosa de NaCl 0.1 mol dm-3 foi
investigada usando as técnicas de microscopia eletrônica de varredura (SEM), energia dispersiva de raios-X (EDX), dissolução anódica sob controle galvanostático (GES), impedância eletroquímica (EIS) e medidas de potencial de circuito aberto (Eoc). Todos os eletrodepósitos foram feitos sobre aço carbono. Fases intermetálicas foram identificadas nas camadas de Zn-Co com teor de Zn-Co superior a 1 at.%. Os resultados de GES, SEM e EDX mostraram que o mecanismo de corrosão das camadas de Zn-Co com mais alto teor de Co está relacionado ao surgimento de trincas devido à dissolução de fases intermetálicas ricas em Zn, enquanto que a corrosão das camadas de Zn e Zn-1Co foi caracterizada pela dissolução destas. Os produtos de corrosão identificados foram os mesmos em todas as camadas testadas, os quais atuaram como barreira, mas não foram capazes de prevenir o processo corrosivo. A melhor resistência à corrosão das camadas de Zn-Co obtidas a partir do banho não aditivado, em comparação à camada de Zn-1Co obtida do banho aditivado, é devido ao elevado teor de Co que promove um enobrecimento da camada. Todas as camadas de Zn-Co apresentaram resistência à corrosão superior às camadas de Zn. A camada Zn-18Co apresentou o melhor desempenho anticorrosivo com uma durabilidade 3 vezes superior a camada de Zn.
The corrosion behavior of electrodeposited Zn and Zn-Co coatings in 0.1 mol dm-3 NaCl
aqueous solutions was investigated using scanning electron microscopy (SEM), energy dispersive X-ray (EDAX), galvanostatic electrochemical stripping (GES), electrochemical impedance spectroscopy (EIS) techniques and open circuit measurements (Eoc). All coatings were electrodeposited on mild steel. Using GES it was possible to identify Zn-Co intermetallic phases in the coatings with Co content higher than 1 at.%. The GES, SEM and EDX results revealed that the corrosion mechanism of the Zn-Co layers with high Co content is related to the appearance of cracks due to the dissolution of the γ rich phases, while the corrosion of the Zn and Zn-1Co layers was characterized by dissolution of the coatings. The Zn and Zn-Co coatings were found to contain the same insoluble corrosion products, which act as a corrosion barrier that delays but does not prevent corrosion. The better corrosion resistance of the Zn-Co coatings obtained in the bath without additive, in comparison with Zn-1Co obtained in the bath containing additive is due to the high Co content which leads to an ennoblement of the coating. All Zn-Co electrodeposits showed greater corrosion resistance than the Zn electrodeposits. The Zn-18Co layer showed the best corrosion resistance, with a lifetime about three times longer than that of the Zn layer.
Keywords:Zn, Zn-Co, electrodeposition, corrosion, electrochemical techniques
Introduction
There is growing interest in zinc coatings combined with elements of the iron-group metals (Fe, Ni and Co) on steel substrate thanks to results reported in the literature. These results show that the corrosion performance of these electrodeposits is superior to that of plain Zn coatings.1-12
Electrodeposited Zn-Co alloys are of practical interest because coatings even with low Co content (1% wt.%, Zn-Co) are more corrosion resistant than an electrodeposited Zn coating.16 On the other hand, the literature offers little data about the understanding of the corrosion mechanism of Zn-Co coatings, stating only that the Co content in the layer is about 1% (wt.%) and that corrosion tests so far have been based only on short term laboratory aging tests such as salt spray and potentiodynamic electrochemical polarization.2-7,9-13 However, these kinds of laboratory tests can lead to different corrosion mechanisms of the Zn-alloy coatings when compared with the corrosion mechanism of the coatings exposed to the natural atmosphere, as reported in the literature for electrodeposited Zn-Ni alloys.8 A previous study showed that the corrosion mechanism of Zn-Fe coatings presented a good correlation between a long-term total immersion laboratory test in NaCl solution and a natural exposing test in marine atmosphere for 3 years.1
In the industrial plating process, the low Co content in the electrodeposited Zn-Co layer (≅ 1% / wt.%) is associated to the presence of commercial additives in the plating solutions, such as levelers or brighteners, because the use of additives makes it possible to obtain layers with a decorative appearance. Industrial additives contain complexing agents that form stable complexes with cobalt ions that hinder the cobalt deposition. On the other hand, Zn-Co coatings with Co content higher than 1% (wt.%) have been obtained from laboratory plating solutions free of additives and the appearance of the coatings was influenced by the operational parameters of the electrodeposition process and are different from the Zn-1Co coatings obtained from a plating solution containing additives.12
Thus, the aim of this study is to investigate the corrosion behavior of electrodeposited Zn-Co alloys undergoing a long-term immersion test in aerated NaCl aqueous solutions in order to improve the understanding of the corrosion mechanism of these layers in an aqueous medium. Additionally, the experimental correlation between the operational electrodeposition parameters of Zn-Co alloys, such as deposition current density and plating solution composition, on the coating morphology, on the coating composition and on the corrosion resistance properties were evaluated. In the present work, two plating solutions were used: one free of additives to obtain coatings with 7 7Co), 10 (Zn-10Co) and 18 at.% (Zn-18Co) of Co content and other containing commercial additive to obtain Zn-1Co coatings. Corrosion was investigated using an
experimental methodology well established in our group to study the corrosion of the metallic coatings submitted to total immersion tests in aqueous solutions1 in order to shed light on the corrosion mechanism of Zn-Co coating in aqueous solutions. Zinc coatings were also studied under the same conditions for comparative purposes.
Experimental
Electrodeposition
The water used in the preparation of the electro-deposition and corrosion testing solutions were purified by a Milli-Q plus system and analytical grade chemicals were used. The Zn-Co alloys, with Co content higher than 1%, were electrodeposited on a mild steel surface using an additive-free plating solution (bath 1) containing 1 mol dm-3 ZnCl
2, 0.1 mol dm -3 CoCl
2, 0.5 mol dm -3
H3BO3 and 2.6 mol dm-3 KCl, preheated to 60 °C. Electrodeposited Zn-1Co coating was obtained at room temperature from a bath that was prepared by just adding 10 mL of STARZINC® to 1 L of the bath 1 (bath 2) and was carried out at room temperature. The pH of both plating solutions was 5.0. All the electrodepositions were performed in a rectangular glass cell keeping a parallel plane between the mild steel sheet cathode and the two Zn sheet anodes. The steel cathode was centrally positioned whereas the two zinc anodes were symmetrically positioned in respect to the cathode. The steel cathode and the Zn anodes had an exposure face of 20 cm2. All coatings were electrodeposited on both sides of the cathode under galvanostatic control. In the case of the Zn-Co coating from bath 1, a current density ranging from 10 to 30 mA cm-2 was used, while for the bath 2 coating a current density of 10 mA cm-2 was used. The Zn plating solutions were prepared by simply removing CoCl2 from the Zn-Co baths and the Zn electrodeposits were obtained at room temperature with a current density of 10 mA cm-2. Prior to the plating, the steel surface was polished with 240, 400 and 600 SiC emery paper, degreased in hot NaOH solution, rinsed in distilled water, etched in 15% HCl solution and finally rinsed with distilled water. All coatings were electrodeposited using constant charges of 2000 coulombs.
Characterization
microscopy (SEM) using a Philips XL-30 microscope. Samples for the SEM cross section analysis were previously embedded in epoxy resin, polished with emery paper up to 600 grit, then refined with alumina (φ = 0.3 µm) and finally subjected to chemical etching using a solution of 5% HNO3 in ethanol. The chemical composition of the Zn-Co electrodeposits was deter-mined using an EDAX NEW XL30 X-ray dispersive energy analyzer attached to the SEM apparatus. The corrosion products upon conclusion of the immersion tests were identified by X-ray diffraction technique (XRD) using a Phillips X’PERT PRO MPD with a Cu Kα at 40 kV and 40 mA and an incident angle of 2 degrees. The main peaks observed in the diffractograms were compared with XRD data from the JCPDS (Joint Committee of Powder Diffraction Standards). The characterization of the as-tested samples was carried out after the end of the immersion test which was defined when surfaces were covered with white corrosion products and an isolated red spot (life time).
Electrochemical measurements
The electrochemical tests involved the following techniques: galvanostatic electrochemical stripping (GES) and electrochemical impedance spectroscopy (EIS) at open circuit potential (Eoc), which also enabled monitoring of the evolution of the Eoc over time during the immersion tests. The electrochemical behavior of the immersed samples was monitored for 20 days.
The GES experiments were galvanostatically controlled at 2 mA cm-2, using a solution containing NaCl (3.4 mol dm-3) and ZnSO
4 (0.6 mol dm
-3). The EIS
experiments were performed in a 0.1 mol dm-3 NaCl solution with a frequency range of 4 mHz to 10 kHz and a sinusoidal amplitude perturbation of 5 mV rms signal. All the electrochemical experiments were conducted with at least duplicate samples and at room temperature (≅
27 °C). The electrochemical cell consisted of a PVC tube glued to the surface with an exposed area of 5.72 cm2. The auxiliary and reference electrodes were Pt foil and
saturated calomel (SCE), respectively. All the potentials reported here are presented on the standard hydrogen scale (SHE). An AUTOLAB PGSTAT30, connected to a PC microcomputer and controlled by GPES4 and FRA software, was used for the acquisition and analysis of the electrochemical data.
Results and Discussion
Coating appearance and EDAX analyses
Visually, all the electrodeposited Zn and Zn-Co coatings were coherent and homogeneous. Those obtained in the bath without the additive (bath 1) were grey and slightly bright, while those obtained from plating solution containing the additive (bath 2) were very bright and presented a very nice decorative appearance.
Table 1 shows the influence of the deposition current density on the alloy composition and on the cathodic current efficiency for the Zn-Co coatings electro-deposited in bath 1. It can be seen that the Co content in the layer varied from 7 at.% to 18 at.%, decreasing with deposition current density. Additionally, the electro-deposits obtained at 10 mA cm-2 and at 20 mA cm-2 presented a lower Zn/Co ratio in the layer than the Zn2+/ Co2+ ratio in the plating solution. Under these operational conditions, according to Brenner,17the electrodeposition can be classified as normal since Co, the nobler metal, is deposited preferentially. However, the layer obtained at 30 mA cm-2 presented a higher Zn/Co ratio in the layer than the Zn2+/Co2+ in the plating solution, which corresponds to anomalous electrodeposition.17 These results indicate that the transition current density (value corresponding to the transition of electrodeposition from normal to anomalous) is localized between 20 mA cm-2 and 30 mA cm-2. This table also shows that the cathodic current efficiency was lower than 100%, which was due to the simultaneous evolution of hydrogen under all the conditions studied here. Lastly, these results are congruent with those reported in the literature by Kirilova et al.,18 who reported on a study of the electrodeposition of Zn-Co from sulfate-chloride plating solutions.
Table 1. Influence of the deposition current density on the chemical composition and on the cathodic current efficiency of the Zn-Co coatings
electrode-posited from bath 1
Zn+2/Co+2 i / (mA cm-2) Zn / at.% Co / at.% Zn/Co in Cathodic Current
in the plating in the layer in the layer the layer Efficiency / %
solution
10/1 10 82 18 4.5/1 90
20 90 10 9.0/1 96
Additionally, the cathodic efficiency of the electro-deposited Zn-1Co coating was about 100%.
Morphological characterization
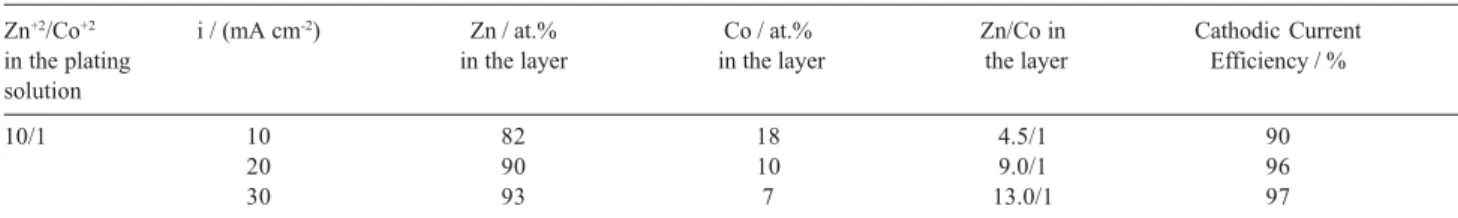
Figure 1 shows the SEM images of the surface and cross section morphologies of the as-electrodeposited Zn coatings. The Zn layer electrodeposited from
additive-free plating solution (Figure 1a) is rather porous presenting hexagonal crystals, typical for such layers obtained from chloride plating solutions without additives.19,20 The cross section SEM images reveal homogeneous layers devoid of cracks for Zn coatings electrodeposited from both plating solutions (Figures 1b and 1c).
Typical SEM images of electrodeposited Zn-Co coatings obtained from bath 1 and bath 2 are shown in Figure 2. These SEM images reveal that the Zn-Co coating obtained from bath 1 is made up of two layers, an inner cracked layer and an outer layer, which is characterized by the presence of polyhedral crystals (Figure 2a). Cracked morphology observed in the inner layer was also observed for electrodeposited Zn-Ni coatings.8 These two layers are also visible in the cross section SEM image (Figure 2b). Additionally, localized EDAX analysis carried out on the coating cross sections indicated that there is no significant difference in the chemical composition of either layer, 17 at.% Co for the inner layer and 18% at.% Co for the outer layer.
The surface SEM image is congruent with those presented by Arun Prasad et al.,21who studied the electrodeposition of Zn-Co alloys from sulfate plating solutions containing different Zn2+/Co2+ ratios. The authors observed, for some cases, the growth of secondary nuclei on top of the nuclei that were formed in the primary nucleation phase. Based on this work, the formation of the outer layer can be explained as a consequence of the formation of Zn-Co nuclei on the inner Zn-Co layer and the resulting morphology of the outer layer is probably due to a higher growth rate of these nuclei on the primary layer in comparison with the nucleation rate of the inner layer on steel substrate. Finally, these SEM images also suggest that the polyhedral crystals are formed by several nuclei. The cross section SEM images of the Zn-1Co coating (Figure 2c) show a homogeneous layer devoid of cracks, similar to that presented in Figure 1c for the Zn coating electrodeposited in the bath containing additive.
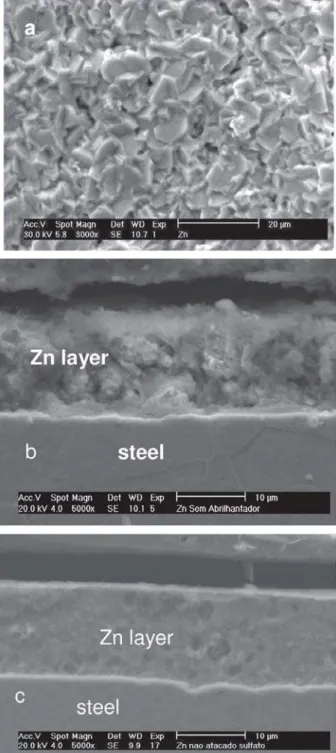
Figure 3 depicts typical SEM images of the Zn electrodeposits after the immersion test, revealing a surface covered with corrosion products on the whole surface, indicating that generalized corrosion occurs (Figure 3a). The cross-section SEM image of the tested Zn layer (Figure 3b) at the point where an isolated red spot was visually observed shows the dissolution of the layer at that site.
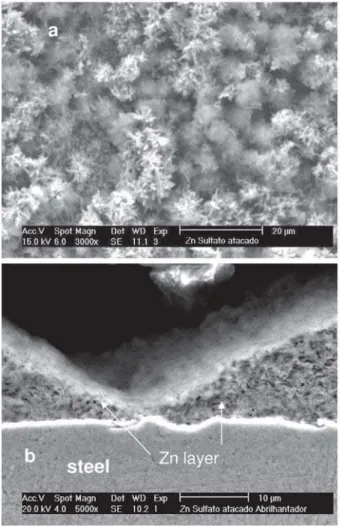
Corrosion products were also observed by SEM on the surface of all tested Zn-Co electrodeposits, as shown in Figure 4a. However, the cross section morphology of the Zn-Co coatings obtained in bath 1 (Figure 4b)
Figure 1. SEM images showing the surface morphology of the Zn
displayed cracks from the surface down to the substrate. These SEM analyses are in agreement with previous observations in our laboratory of the corrosion behavior of galvanized steel and galvannealed steel in aqueous NaCl solution and in a tropical marine environment, where the appearance of cracks was associated with
the dissolution of zinc-rich phases.1 Another report also shows a similar evolution of cracking of the Zn-Ni layer during the corrosion process.8 On the other hand, the cross section of the Zn-1Co (Figure 4c) indicates a generalized dissolution of the layer, similar to that observed for the Zn layer.
Finally, localized EDAX analyses were made of the layer and the cracked region of the tested Zn-Co layer, as indicated in Figure 4b. The Co content in the layer was about 36 at.%, while this content in the cracked region was about 60 at.%, suggesting that the Co enrichment in the layer was associated with the dissolution of residual Zn and Zn-rich phases.
Electrochemical characterization
The electrochemical stripping technique is known to be very useful to identify phase formation in the electrodeposition of alloys.22 Zn and Zn-Co coatings were subjected to GES and Figure 5 displays the typical
Figure 2. SEM images showing the surface morphology (a) and the cross
section morphologies (b) of the Zn-Co coatings electrodeposited from bath 1 and the cross section of the electrodeposited Zn-1Co coatings (c).
Figure 3. SEM micrographs showing the surface (a) and cross section
potential-time curves obtained for these coatings. In the case of coatings obtained in bath 1, Zn-Co alloys consistently showed more positive potential values than Zn due to their cobalt content, an element with a nobler thermodynamic standard electrochemical potential. The curve corresponding to the Zn layer shows a single and well defined plateau at about –0.76 V while the GES curve for the Zn-Co coating obtained in bath 1 does not present well defined plateaus. Figure 5 also shows the derivative of the GES curve to improve identification of the corresponding dissolution
potentials of the Zn-Co intermetallic phases. In this derivative curve, the plateaus correspond to phase dissolution and the peaks are related to the change in the slope of the GES curve indicating the end of the dissolution of a phase and the beginning of the dissolution of a new phase. Thus, from this derivative curve six phases are visible, which allows us to make the following association, according to Gómez and Vallés:23-25 plateau 1 relates to the dissolution of η Zn phase, plateaus 2, 3, and 4 represent the dissolution of
γ Zn-rich phases, plateau 5 is associated with the dissolution of the porous cobalt matrix; and finally, plateau 6 relates to the dissolution of the steel substrate. On the other hand, Zn-1Co coating presented similar GES behavior to Zn coatings with the GES curve presenting the same plateau at –0.76 V, indicating that there is no formation of intermetallic phases when just 1 at.% of Co is added to the Zn layer.
After interrupting the GES at different dissolution times, corresponding to peaks A and B in the derivative curve, the surface morphology was analyzed by SEM, as shown in Figure 6. The SEM image, corresponding to peak A, indicates that the secondary layer was completely dissolved, exposing the cracked primary layer. These cracks widened in response to longer dissolution times. EDAX analyses carried out on these surfaces showed a Co content of 38 at.% and 45 at.% for the surface corresponding to peak A and peak B in the derivative curve, respectively.
The SEM, EDAX and GES results indicate that the dissolution mechanism of Zn-Co coatings, with high Co content, is associated to the evolution of cracks in the Zn-Co layer attributed to the dissolution of zinc-rich phases. Similar results from our laboratory are reported in the literature, showing the evolution of cracking of galvannealed steel during the corrosion process.1
Figure 4. SEM micrographs showing the surface (a) and cross section
(b,c) morphologies of the Zn-18Co and Zn-1Co coatings after the end of immersion tests in 0.1 mol dm-3 NaCl aqueous solution.
Figure 5. Potential-time curves obtained from galvanostatic anodic
strip-ping of the Zn (dashed line) and Zn-18Co (solid line) coatings electrode-posited from bath 1 in 3.4 mol dm-3 NaCl and 0.6 mol dm-3 ZnSO
4 at 2
mA cm-2 and room temperature. Shown here is Zn-18Co.
0 2000 4000 6000 8000 10000 12000 -0.8
-0.7 -0.6 -0.5 -0.4 -0.3 -0.2
-2 0 2 4 6
E/
(V
vs.
SHE)
time / s
1 2 3
4 5 6
A
B
(d
E
/
d
t)
/
(1
0
Characterization of the corrosion products
To better understand the corrosion mechanism of studied electrodeposits in aerated NaCl solution, XRD was used to identify the corrosion products formed on the surface during the immersion test. Figure 7 shows a typical X-ray diffractogram of the corrosion products on the surface of the Zn and Zn-Co layers after the immersion tests, as well as the JCPDS diffraction patterns.
The XRD diffractograms of corrosion products on the Zn and Zn-Co electrodeposits show lines corresponding to zinc oxide (ZnO), zinc hydroxy-chloride (ZHCl) [Zn5(OH)8Cl2.H2O] and zinc hydroxy-carbonate (ZHCar) [Zn4(CO3)(OH)6.H2O]. Boshkov et al.2 used XRD to characterize the corrosion products of Zn-Co (1-5 wt.% of Co) in free aerated 5% NaCl solutions after immersion for 6 days. Their report identified ZHCl as the corrosion product of the Zn-Co layer but not as the corrosion product of the Zn coating. The authors attributed the superior corrosion resistance of Zn-Co coatings to the appearance of this corrosion product, which has a low solubility product, in the order
of 10-14. 26 ZHCar has also been identified as a corrosion product of zinc in environments containing CO2, such as pure water saturated with air and marine environments.27
The formation of these compounds as corrosion products on the surface of Zn and Zn-Co electrodeposits tested in an aerated chloride medium can be explained by a sequence of reactions. This process begins with the dissolution of Zn (anodic reaction) and the reduction of the oxygen dissolved in the solution (cathodic reaction), according to equations (1) and (2):
Zn (s) → Zn2+(aq) + 2e– E0 = –0.760 V (1)
O2 (g) + 2H2O (l) + 4e–→ 4OH–(aq) E0 = 0.401 V (2)
Zinc hydroxide is then formed by the reaction of Zn2+ (aq.) with OH– (aq.), according to reaction (3). Because the solubility product of Zn(OH)2 is very low,27 3 × 10-17, this compound precipitates on the surface and then transforms into zinc oxide.
Zn2+(aq) + 2OH– (aq) → Zn(OH)
2(s) (3)
Zn(OH)2(s)→ ZnO (s) + H2O (l) (4)
However, chloride ions can react with the passive film to form soluble hydroxy complexes (Zn2+-Cl–OH–),26 leading to breakdown of the film and dissolution of the zinc layer.
Figure 6. SEM micrograph of the surface morphology of the Zn-18Co
coating after partial galvanostatic anodic stripping, corresponding to peaks A (a) and B (b) in the derivative curve shown in Figure 5.
Figure 7. X-ray diffractograms of the corrosion products of Zn and
Zn-Co coatings tested in 0.1 mol dm-3 NaCl aqueous solution during 20 days.
0 15 30 45 60 75
2θ/ degree
Zn4CO3(OH)6.H2O Zn5(OH)8Cl2H2O
ZHCl is formed by the reaction of ions in solution, according to equation (5), followed by precipitation of this compound on the surface:28
5 Zn2+ (aq) + 8 OH– (aq) + 2 Cl– (aq) + H
2O (l) →
Zn5(OH)8Cl2.H2O (s) (5)
ZHCar is formed by the reaction of dissolved CO2 (g) with Zn2+ and water, according to the reaction (6): 29
4 Zn2+ (aq) + CO
2 (g) + 8 H2O (l) →
Zn4(OH)6CO3.H2O (s) + 8 H+ (aq) (6)
Finally, our XRD results indicate that the superior corrosion resistance of Zn-Co in aerated medium cannot be attributed solely to the presence of insoluble compounds on the surface, since both Zn and Zn-Co coatings showed the same corrosion products, which did not prevent corrosion.
Corrosion tests
The life times of the Zn and Zn-Co coatings tested in 0.1 mol dm-3 NaCl solution are listed in Table 2. The life times presented by the Zn-Co coatings rise with the Co content and are always higher than those of the Zn coatings. Additionally, it can be observed that the bright and compact Zn layer, obtained in the bath containing additive, presents higher life time than the porous Zn coating obtained in the bath without additive. On the other hand, the Zn-7Co, Zn-10Co and Zn-18Co coatings, which were obtained in bath 1, present higher life times than the bright and compact Zn-1Co coatings, obtained in bath 2. This result suggests that the better corrosion resistance of the Zn-Co coatings from bath 1 is due to higher Co content, which leads to an ennoblement of the coating.
Monitoring of the Eocproved to be a suitable measurement to assess the various stages of dissolution of a coating in long-term immersion tests. Figure 8 shows the evolution of the Eoc with immersion time for the electrodeposited Zn and Zn-Co coatings immersed in aerated 0.1 mol dm-3 NaCl at room temperature.
Note that Figure 8 confirms that the Eoc values obtained from the immersion tests are congruous with those obtained in the GES experiments and that Zn and Zn-1Co coatings have similar electrochemical behavior. During the first day of immersion, the Eoc values of all the samples decreased slightly. This behavior was related to the dissolution of Zn. For immersion time between day 1 and day 4, the Eoc of the Zn, Zn-1Co and Zn-7Co coatings increased and were very close. After 4 days of immersion and longer, the Zn-7Co samples presented higher Eoc than Zn and Zn-1Co layers, while the Eoc values of these coatings remained at about –0.8 V up to day 20 with the Eoc of Zn-1Co coating being slightly less negative that of the Zn coating. Zn-18Co presented lesser negative Eoc which gradually increased with the immersion times higher than 1 day, until it reached a plateau at about 0.5 V. The increase of the Eoc of the Zn-Co coatings was associated to the dissolution of the Zn-rich content, which gradually ennobled the alloy. The Zn-Co layers exhibited higher Eoc values than the Zn coating, but more negative than the Eoc of the steel substrate, which was –0.420 V after 2 h of immersion, indicating that the Zn-Co coating acts as a sacrificial anode protecting the steel substrate.
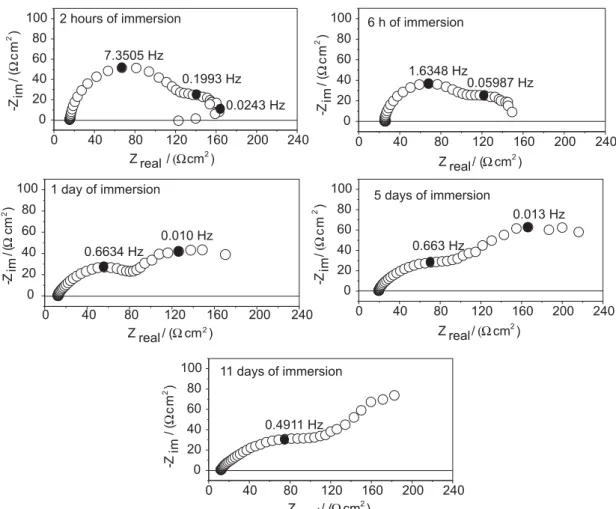
Figures 9-11 illustrate the evolution of the impedance diagrams for the electrodeposited Zn, Zn-1Co and Zn-18Co layers, respectively, as a function of the immersion time in 0.1 mol dm-3 NaCl aqueous solution, with the characteristic frequencies indicated in each Nyquist diagram.
The Nyquist diagram of the Zn layer immersed for 2 h shows three loops (Figure 9). The existence of three loops in the Nyquist diagrams obtained for Zn in sulfate
Table 2. Life time of the Zn and Zn-Co coatings tested in 0.1 mol dm-3
NaCl solution
Samples Life time / days
Zn (bath 1) 18
Zn (bath 2) 25
Zn-1Co (bath 2) 35
Zn-7Co (bath 1) 48
Zn-10Co (bath 1) 51
Zn-18Co (bath 1) 79
Figure 8. Evolution over time of the open circuit potential of samples
immersed in 0.1 mol dm-3 NaCl aqueous solution at room temperature.
0 2 4 8 12 16 20
-0.9 -0.8 -0.7 -0.6
-0.5 Zn-1CoZn
Zn-18Co Zn-7Co
E/
(V
vs.
SHE)
and chloride aerated media has been reported by other authors30-35 and are in close agreement with the results presented here. Zinc corrosion has been described as occurring in two consecutive monoelectron transfer reactions according to the following reaction mechanism:36,37
Zn (s) → Zn+ (ads) + e– (7)
Zn+ (ads) → Zn2+ (ads) + e– (8)
Zn2+ (ads) → Zn2+ (aq) (9)
Thus, the capacitive loop in the high frequency range is attributed to the first charge transfer resistance (Rct) in parallel with the double layer capacitance (Cdl) (equation 7), whose value is 208 µF cm-2. The second capacitive loop, which had a characteristic frequency of 0.1993 Hz, was related to intermediate charge transfer adsorption (equation 8), while the inductive loop, with a characteristic frequency of 0.0243 Hz, was associated with the coverage relaxation of adsorbed species such
as Zn+, Zn2+ and ZnOH
ads. With longer immersion times, the impedance diagrams evolved to two capacitive loops, showing a Warburg diffusion component on day 11 of immersion, which is related to the diffusion of O2 through the corrosion film.
The impedance diagrams of the electrodeposited Zn-1Co (Figure 10) and Zn-18 Co (Figure 11) coatings immersed for 2 hours showed one capacitive loop in the high frequency range corresponding to the electron transfer reaction at the metal/solution interface presenting a capacitive value of 140 µF cm-2 and 520 µF cm-2, respectively and a second loop in the low frequency range. For 1 day of immersion, t h e i m p e d a n c e d i a g r a m o f t h e Z n - 1 C o s a m p l e presented a partially resolved semicircle in the high frequency range, followed by a Warburg diffusion component in the low frequency range while for longer immersion times the impedance diagrams of t h i s s a m p l e e v o l v e d t o t w o p a r t i a l l y r e s o l v e d capacitive arcs. The impedance diagrams of the Zn-18Co sample immersed for more than 1 day also showed a partially resolved semicircle in the high
Figure 9. Evolution of the impedance diagrams with immersion time of Zn electrogalvanized samples immersed in 0.1 mol dm-3 NaCl aqueous solution at
room temperature.
0 40 80 120 160 200 240
0 20 40 60 80 100
-Z
im
/(
cm
2 )
Z real /( cm2) 2 hours of immersion
7.3505 Hz
0.1993 Hz
0.0243 Hz
0 40 80 120 160 200 240
0 20 40 60 80 100
-Z
im
/(
cm
2 )
Z real/ ( cm2) 1.6348 Hz
0.05987 Hz 6 h of immersion
0 40 80 120 160 200 240
0 20 40 60 80 100
0.010 Hz 0.6634 Hz
-Z
im
/(
cm
2)
Z real/ ( cm2) 1 day of immersion
0 40 80 120 160 200 240
0 20 40 60 80 100
-Z
im
/
(
cm
2 )
Z real/( cm2 ) 0.013 Hz
0.663 Hz 5 days of immersion
0 40 80 120 160 200 240
0 20 40 60 80 100
-Z
im
/(
cm
2 )
frequency range, followed by a Warburg diffusion component in the low frequency range. This feature is typical of a surface containing corrosion products that act as a barrier against corrosion,38 which was confirmed by the SEM analysis (Figure 4). However, the presence of these corrosion products on the surface did not prevent the evolution of the corrosion process of the Zn-Co coating.
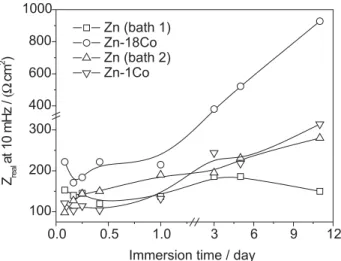
Magalhãeset al.39 pointed out that the value of the resistive component of impedance measured at a fixed frequency and in the range of the lower frequencies is very suitable for industrial routines and represents coating corrosion. Figure 12 shows the values of the real part of the impedance measured at 10 mHz as a function of the immersion time in 0.1 mol dm-3 NaCl solution.
This figure shows that the resistance of both the Zn electrodeposits and the Zn-1Co coatings rises with immersion time. In the case of the electrodeposited Zn-18Co alloy, an initial decrease occurred during the first four hours of immersion, followed by rising values up
to day 11. This decrease in the resistance values during the first hours of immersion was ascribed to the dissolution of Zn, while the increasing resistance was attributed to the presence of corrosion products on the surface, which improved the barrier properties. However, these improved barrier properties did not prevent the corrosion from continuing to occur in all studied coatings (see Figures 3-4). Another possible explanation for the increase in resistance with immersion time in the Zn-18Co coating is the preferential dissolution of zinc-rich phases. This assumption is in close agreement with the findings for Zn-Fe layers reported by Lee and Hiam,40 who showed that the dissolution of zinc-rich phases caused the polarization resistance to increase.
Conclusions
Electrodeposited Zn-Co alloys were successfully obtained with Co content varying from 1 at.% to 18 at.%.
Figure 10. Diagrams of the evolution of impedance with immersion time for Zn-1Co electrogalvanized samples immersed in 0.1 mol dm-3 NaCl aqueous
solution at room temperature.
Z real /( cm2)
Z real /( cm2
)
Z real /( cm2)
Z real /( cm2
)
Z real /( cm2)
-Z
im
/(
cm
2 )
-Z
im
/(
cm
2 )
-Zim
/(
cm
2 )
-Zim
/(
cm
2 )
-Z
im
/(
cm
2 )
0 40 80 120
0 20 40 60
. 2 hours of immersion
2.2082 Hz
0 40 80 120
0 20 40 60
. 6 hours of immersion
1.2103 Hz
0 40 80 120 160
0 20 40 60 80
.
1 day of immersion
0.8960 Hz
0 60 120 180 240
0 30 60 90 120
. 5 days of immersion
0.3636 Hz
0 100 200 300
0 50 100 150
. 11 days of immersion
GES made it possible to identify the Zn-Co intermetallic phases in the alloy coatings with Co content higher than 1 at.%. The SEM, GES and EDX techniques allowed to conclude that the corrosion mechanism of Zn-Co layers with Co content obtained in the bath without additive is
related to the appearance of cracks in response to the dissolution of γ Zn-rich phases. On the other hand, the corrosion of Zn and of the Zn-1Co electrodeposits was characterized by the dissolution of the coatings. The same insoluble corrosion products, which act as a barrier against corrosion but do not prevent it, were identified on Zn and on Zn-Co coatings. The better corrosion resistance of the Zn-Co coatings obtained in the bath without additive in comparison with Zn-1Co obtained in the bath containing additive is due to high Co content which leads to an ennoblement of the coating. All Zn-Co electrodeposits showed greater corrosion resistance than the Zn electrodeposits. The Zn-18Co layer showed the best corrosion resistance, with a lifetime about three times longer than that of the Zn layer.
Acknowledgments
The authors gratefully acknowledge the funding provided by CNPq, CAPES, FINEP and FUNCAP (Brazil), without which this work could not have been carried out.
Figure 11. Diagrams of the evolution of impedance with immersion time for Zn-18Co electrogalvanized samples immersed in 0.1 mol dm-3 NaCl aqueous
solution at room temperature.
0 60 120 180 240 300
0 30 60 90 120 150
0.19928 2.983 Hz
2 h of immersion
0 60 120 180 240 300
0 30 60 90 120 150
0.1475 Hz 6 h of immersion
0 60 120 180 240 300
0 30 60 90 120 150
0.10923
24.468 1 day of immersion
0 100 200 300 400 500
0 150 300 450
5.4418 Hz 5 days of immersion
0 200 400 600 800 1000
0 250 500 750 1000
2.9827 Hz 11 days of immersion
-Z
im
/(
cm
2 )
-Z
im
/(
cm
2 )
-Z
im
/(
cm
2 )
-Zim
/(
cm
2 )
-Z
im
/(
cm
2 )
Z real /( cm2
)
Z real /( cm2) Z real /( cm2)
Z real /( cm2)
Z real /( cm2)
Figure 12. Zreal at 10 mHz vs. immersion time in 0.1 mol dm-3 NaCl
aqueous solution at room temperature.
0.0 0.5 1.0 3 6 9 12
100 200 300 400 600 800 1000
Zreal
at
10
m
H
z
/
(
cm
2 )
Immersion time / day Zn (bath 1)
References
1. Da Silva, P. S. G.; Costa, A. N. C.; Mattos, O. R.; Correia, A.
N.; De Lima-Neto, P.; J. Appl. Electrochem.2006,36, 375,
and references cited therein.
2. Boshkov, N.; Petrov, K.; Kovacheva, D.; Vitikova, S.; Nemska, S.;Electrochim. Acta2005,51, 77.
3. Ramanauskas, R.; Juškénas, R.; Kalinièenko, A.;
Garfias-Mesias, L. F.; J. Solid State Electrochem. 2004,8, 416.
4. Boshkov, N.; Petrov, K.; Vitikova, S.; Nemska, S.; Raichevsky,
G.; Surf. Coat. Technol.2002,157, 171.
5. Boshkov, N.; Petrov, K.; Vitikova, S.; Met. Fin.2002,100, 8.
6. Boshkov, N.; Nemska, S.; Vitikova, S.; Met. Fin.2002,100, 14.
7. Boshkov, N.; Vitikova, S.; Petrov, K.; Met. Fin.2001,99, 56.
8. Fabri Miranda, F. J.; Margarit, I. C. P.; Mattos, O. R.; Barcia,
O. E.; Wiart, R.; Corrosion1999,55, 732, and references 15,
16 and 17 cited therein.
9. Ramanauskas, R.; Appl. Surf. Sci.1999,153, 53.
10. Ramanauskas, R.; Muleshkova, L.; Maldonado, L.;
Dobrovolskis, P.; Corros. Sci.1998,40, 401.
11. Ramanauskas, R.; Quintana, P.; Maldonado, L.; Pomés, R.;
Pech-Canul, M. A.; Surf. Coat. Technol.1997,92, 16.
12. Fratesi, R.; Roventi, G.; Branca, C.; Simoncini, S.; Surf. Coat. Technol.1994,63, 97.
13. Bajat, J. B.; Miškovic-Stankovi, V. B.; Maksimovi, M. D.;
Draži, D. M.; Electrochim. Acta2002,47, 4101.
14. Tomachuk, C. R.; Freire, C. M. de A.; Ballester, M.; Fratesi,
R.; Roventi, G.; Surf. Coat. Technol.1999,122, 6.
15. Pech-Canul, M. A.; Ramanauskas, R.; Maldonado, L.; Electrochim. Acta1997,42, 255.
16. Rashwan, S. M.; Mohamed, A. E.; Abdel-Wahaab, S. M.;
Kamel, M. M.; J. Appl. Electrochem.2003,33, 1035.
17. Brenner, A.; Electrodeposition of Alloys, Vol. 1, Academic Press:New York, 1963.
18. Kirilova, I.; Ivanov, I.; Rashkov, St.; J. Appl. Electrochem.1997,
27, 1380.
19. Barceló, G.; Sarret, M.; Müller, C.; Pregonas, J.; Electrochim. Acta1998,43, 13.
20. Wang, H. M.; Keefe, T. J. O´; J. Appl. Electrochem.1994,24,
900.
21. Arun Prasad, K.; Giridhar, P.; Ravindran, V.; Muralidharam, V. S.;J. Solid State Electrochem.2001,6, 63.
22. Swathirajan, S.; J. Electrochem. Soc.1986,133, 671.
23. Gómez, E.; Vallés, E.; J. Electroanal. Chem.1995,397, 177.
24. Gómez, E.; Vallés, E.; J. Electroanal. Chem.1997,421, 157.
25. Gómez, E.; Vallés, E.; J. Electroanal. Chem.2001,505, 54.
26. Peulon, S.; Lincot, D.; J. Electrochem. Soc. 1998,145, 864.
27. Falk, T.; Svensson, J. E.; Johansson, L. G.; J. Electrochem. Soc.1998,145, 39 and references 20, 28 and 29 cited therein.
28. Aramaki, K.; Corros. Sci.2001,43, 591 and reference 4 cited
therein.
29. Preis, W.; Gamsjäger, H., Monatsh. Chem. 2001,132, 1327.
30. Presuel-Moreno, F. J.; Jakab, M. A.; Scully, J. R.; J. Electrochem. Soc. 2005,152, B376.
31. Magaino, S.; Soga, M.; Sobue, K.; Kawaguchi, A.; Ishida, N.;
Imai, H.; Electrochim. Acta1999,44, 4307 and references cited
therein.
32. Cachet, C.; Wiart, R.; J. Electroanal. Chem.1980,111, 235.
33. Cachet, C.; Wiart, R.; J. Electroanal. Chem.1982,129, 103.
34. Deslouis, C.; Duprat, M.; Tulet Tournillon, C.; J. Electroanal. Chem.1984,181, 119.
35. Deslouis, C.; Duprat, M.; Tulet Tournillon, C.; Corros. Sci.
1989,29, 13.
36. Giménez-Romero, D.; García-Jareño, J. J.; Vicente, F.; Electrochem. Commun.2003,5 722.
37. Giménez-Romero, D.; García-Jareño, J. J.; Vicente, F.; Electrochem. Commun.2004,6, 148.
38. McDonald, J. R.; Impedance Spectroscopy Emphasizing Solid Materials and Systems, John Wlley & Sons: New York, USA,1987.
39. Magalhães, A. A. O.; Margarit, I. C. P.; Mattos, O. R.; Electrochim. Acta1999,44, 4281.
40. Lee, H. H.; Hiam, D.; Corrosion1989,45, 852.