Carlos Alberto da Silva Ribeiro de Melo
The additive effects in Matrix Dispersed Liquid Crystals
Departamento de Química
The additive effects in
Matrix Dispersed Liquid Crystals
By
Carlos Alberto da Silva Ribeiro de Melo
Dissertation presented at Faculdade de Ciências e Tecnologia
from Universidade Nova de Lisboa to obtain the degree of
Master in Chemical and Biochemical Engineering
Supervised by
João Carlos da Silva Barbosa Sotomayor
Lisboa
“Science without Religion is lame.
Religion without Science is blind.”
Acknowledgements
First of all, I would like to thank Prof. João Sotomayor of FCT-UNL, regarding the thesis
coordination and support, since the first day that it started.
To all the elements associated with this project, in particular to Prof. João Figueirinhas
of IST-UTL, for all the help provided with the electro-optical results and his knowledge
in the area of the liquid crystals.
To Prof. Helena Godinho of FCT-UNL for all the provided equipment for the polarized
optical microscopy photos and dedication on the understanding of the diverse
structures of the samples, as well as João Canejo and Ana Ferreira.
To Prof. Madalena Dionísio, Prof. Natália Correia and Ana Brás of FCT-UNL for the
dielectric relaxation spectroscopy analysis and contribution of knowledge and
dedication.
To Carla Rodrigues of FCT-UNL for the differential scanning calorimetry analysis.
To Isabel Nogueira of IST-UTL, for the scanning electron microscopy photos.
To all the personnel in Laboratory 415 and to my master thesis partner, Alexandre
Maiau, who helped me along the work and made this journey as simple as fun.
To Krasimira Petrova, Ana Mouquinho and Mara Saavedra for diverse chemical
processes and analysis, as well as their estimated friendship.
Finally, to all the persons who contributed in some way to the elaboration of this
dissertation and to all of you, who are reading these words,
Abstract
Abstract
The main objective of this work was to optimize the structure of a matrix that will support a nematic mixture of liquid crystals, known as 𝐸𝐸7 from Merck, in order to produce a matrix dispersed liquid crystal device with good electro-optical responses. The composites are based on monomers, such as tri(ethylene glycol) dimethacrylate and poly(ethylene glycol) dimethacrylate with typical molecular weight of
875 𝑔𝑔.𝑚𝑚𝑚𝑚𝑚𝑚−1 with two different types of polymerization, a thermal polymerization with initiation by α,α’-azoisobutyronitrile and a photochemical polymerization with
initiation by p-xylene N,N-diethyldithiocarbamate.
To do that, some additives have been used as a way to format the shape and the size
of the liquid crystal microdroplets and to avoid its coalescence and, therefore, optimizing the performance of the device as being able to electro-optical application. Octanoic acid, ethylene glycol, triton X-100, cetyl trimethyl ammonium bromide and sodium dodecyl sulfate have been used as additives to the systems.
Different aspects were investigated, such as the study of the dynamics of the transition ON/OFF state using a high-frequency alternate voltage and the attempt to minimize and maximize the liquid crystal anchorage breaking to the polymer matrix observed when tension is applied. The polymer morphology and the composites synthesized were analyzed by polarized optical microscopy and scanning electron microscopy and those results were related with the electro-optical response curves of the composites in study.
Resumo
The additive effects in Matrix Dispersed Liquid Crystals XII
Resumo
O objectivo principal deste trabalho foi o de optimizar a estrutura de uma matriz que irá suportar uma mistura nemática de cristais líquidos, conhecida como 𝐸𝐸7 da Merck, de modo a produzir um dispositivo de cristal líquido disperso em matriz com boas respostas electro-ópticas.
Os compósitos são baseados em monómeros, como tri(etilenoglicol) dimetacrilato e
poli(etilenoglicol) dimetacrilato com peso molecular típico de 875 𝑔𝑔.𝑚𝑚𝑚𝑚𝑚𝑚−1 com dois tipos de polimerização diferentes, uma polimerização térmica com iniciação por
α,α’-azoisobutironitrilo e uma polimerização fotoquímica com iniciação por p-xileno N,N-dietilditiocarbamato.
Para isso, alguns aditivos foram usados como um meio para moldar a forma e o tamanho das microgotas de cristal líquido e evitar a sua coalescência e, assim, optimizar o desempenho do dispositivo como sendo passível de aplicação electro-óptica. Ácido octanóico, etilenoglicol, triton X-100, brometo de cetil trimetil amónio e dodecil sulfato de sódio foram usados como aditivos aos sistemas.
Foram investigados diferentes aspectos, como o estudo da dinâmica de transição do estado ON/OFF usando uma corrente alterna de alta frequência e a tentativa de minimização e maximização da desancoragem do cristal líquido da matriz polimérica quando é aplicada tensão. A morfologia do polímero e dos compósitos sintetizados foi observada por microscopia de luz polarizada e por microscopia electrónica de varrimento e esses resultados foram relacionados com as curvas de resposta electro-óptica dos compósitos em estudo.
Table of Abbreviations
Table of Abbreviations
Text
Abbreviation
α,α’-Azoisobutyronitrile AIBN
Octanoic Acid with different addition order AO
Cetyl Trimethyl Ammonium Bromide CTAB
Dielectric Relaxation Spectroscopy DRS
Differential Scanning Calorimetry DSC
Ethylene Glycol EG
Hexadecanoic Acid HDA
Indium Tin Oxide ITO
Liquid Crystal LC
Nuclear Magnetic Resonance NMR
Octanoic Acid OA
Octanoic Acid in 1% of weight OA1
Octanoic Acid in 10% of weight OA10
Polarized Optical Microscopy POM
Poly(ethylene glycol) Dimethacrylate POLY875
Scanning Electron Microscopy SEM
Sodium Dodecyl Sulfate SDS
Tri(ethylene glycol) Dimethacrylate TRI
Triton X-100 TX100
Table of Contents
The additive effects in Matrix Dispersed Liquid Crystals XIV
Table of Contents
Abstract ... XI
Resumo ... XII
Table of Abbreviations ... XIII
Table of Contents ... XIV
Index of Figures ... XVIII
Index of Tables ... XXVI
Chapter One
1. Introduction ... 1
1.1. The Liquid Crystals ... 1
1.1.1. Types of Liquid Crystals ... 2
1.1.2. Liquid Crystal Phases ... 3
1.2. Basics of Liquid Crystals ... 5
1.2.1. Director and Degree of Order ... 5
1.2.2. Anisotropy ... 6
1.2.3. Liquid Crystals in Electric Fields ... 7
1.2.4. Surface Anchorage and Memory Effect ... 8
1.3. Polymer Liquid Crystals ... 10
1.3.1. Types of Polymer Liquid Crystals ... 10
1.4. Liquid Crystal Displays... 11
1.4.1. Applied Voltages ... 11
1.4.2. Types of Liquid Crystal Displays ... 14
1.4.3. Polymer Dispersed Liquid Crystal Displays ... 15
Table of Contents
1.5.1. Polymer Liquid Crystals applications ... 19
1.5.2. Polymer Dispersed Liquid Crystals applications ... 19
Chapter Two 2. Literature Review ... 21
2.1. Before the Discovery ... 21
2.2. The Discovery of Liquid Crystals ... 21
2.3. After the Discovery ... 22
2.4. Recent Developments ... 22
2.4.1. Polymer Dispersed Liquid Crystals ... 23
2.4.2. External Fields ... 25
2.4.3. Surface Anchorage ... 25
2.4.4. Additive Effects ... 27
2.4.5. Electro-Optical Studies ... 28
2.5. Problem Definition and Proposed Solution ... 29
2.5.1. General Aspects ... 30
2.5.2. Additive Effects ... 31
Chapter Three 3. Materials and Methods ... 33
3.1. Materials ... 33
3.1.1. Monomers ... 33
3.1.2. Polymerization Initiators ... 34
3.1.3. Liquid Crystal ... 37
3.1.4. Additives ... 39
3.1.5. Indium Tin Oxide Cells ... 41
Table of Contents
The additive effects in Matrix Dispersed Liquid Crystals XVI
3.2.1. Preparation of Solutions ... 43
3.2.2. Octanoic Acid Studies ... 44
3.2.3. Polymerization Induced Phase Separation ... 45
3.2.4. Indium Tin Oxide Cells ... 49
3.2.5. Polarized Optical Microscopy ... 49
3.2.6. Scanning Electron Microscopy ... 52
3.2.7. Electro-Optical Studies ... 54
3.2.8. Differential Scanning Calorimetry ... 55
3.2.9. Dielectric Relaxation Spectroscopy ... 56
Chapter Four 4. Experimental Results and Analysis ... 59
4.1. The Octanoic Acid ... 59
4.1.1. Addition Order ... 65
4.1.2. Quantity of Additive ... 70
4.1.3. Chain Length ... 76
4.2. The Ethylene Glycol ... 84
4.3. The Triton X-100 ... 90
4.4. The Cetyl Trimethyl Ammonium Bromide ... 96
4.5. The Sodium Dodecyl Sulfate ... 102
Chapter Five 5. Additional Analysis ... 113
5.1. Differential Scanning Calorimetry ... 113
5.1.1. Liquid Crystal ... 113
5.1.2. Surfactant ... 115
Table of Contents
5.2. Dielectric Relaxation Spectroscopy... 119
5.2.1. Liquid Crystal ... 119
5.2.2. Surfactant ... 122
5.2.3. Mixture of Liquid Crystal and Surfactant... 123
5.2.4. Liquid Crystal Composite ... 125
5.2.5. Mixture Composite ... 127
5.3. Scanning Temperature in Polarized Optical Microscopy ... 129
Chapter Six 6. Conclusion ... 131
Chapter Seven 7. Future Work ... 133
Chapter Eight 8. References ... 135
Appendix Section ... 141
A.1. Comparison between Monomers ... 143
A.2. Comparison between Polymerization Initiators ... 148
A.3. Comparison between Additives ... 153
A.4. Dielectric Relaxation Spectroscopy of the Liquid Crystal ... 155
A.5. Dielectric Relaxation Spectroscopy of the Surfactant ... 157
A.6. Dielectric Relaxation Spectroscopy of the Mixture ... 159
Index of Figures
The additive effects in Matrix Dispersed Liquid Crystals XVIII
Index of Figures
Chapter One
Figure 1.1 – Schematic illustration of the solid, liquid crystal and liquid phases. ... 1
Figure 1.2 – Examples of thermotropic liquid crystal molecules. ... 2
Figure 1.3 – Example of a lyotropic liquid crystal molecule. ... 3
Figure 1.4 – Schematic illustration of the nematic liquid crystal phase. ... 4
Figure 1.5 – Schematic illustration of the cholesteric liquid crystal phase. ... 4
Figure 1.6 – Schematic illustration of the smectic liquid crystal phase. ... 5
Figure 1.7 – Effects of an electric field in a liquid crystal molecule. ... 7
Figure 1.8 – Surface anchorage when external fields are applied. ... 8
Figure 1.9 – Surface anchorage and permanent memory effect. ... 9
Figure 1.10 – Types of polymers that can be formed with anisotropic units. ... 10
Figure 1.11 – Electro-optic response curve of a typical display. ... 12
Figure 1.12 – Turn-on and turn-off responses for a typical liquid crystal display. ... 13
Figure 1.13 – Polymer dispersed liquid crystal morphology. ... 16
Figure 1.14 – Possible orientations and configurations of liquid crystal droplets. ... 17
Figure 1.15 – Working principle of a polymer dispersed liquid crystal display. ... 17
Chapter Two Figure 2.1 – Polymer dispersed liquid crystal shutters in an office. ... 29
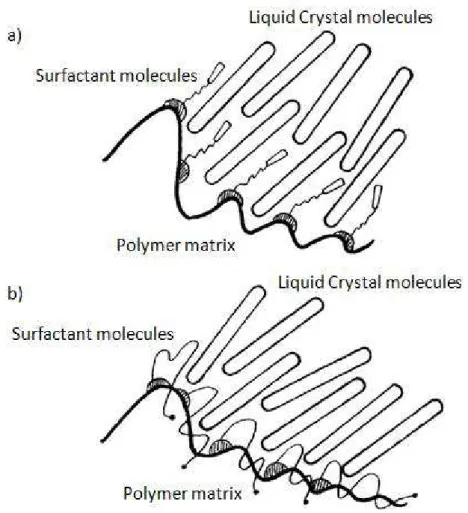
Figure 2.2 – Interaction and effect of surfactant on a polymer dispersed liquid crystal. ... 31
Figure 2.3 – Chemical structure of methacrylate. ... 32
Chapter Three Figure 3.1 – Chemical structure and molecular formula of tri(ethylene glycol) dimethacrylate... 33
Figure 3.2 – Chemical structure and molecular formula of poly(ethylene glycol) dimethacrylate... 34
Figure 3.3 – Chemical structure and molecular formula of AIBN. ... 34
Index of Figures
Figure 3.5 – Chemical structure and molecular formula of XDT. ... 35
Figure 3.6 – NMR spectrum of XDT. ... 36
Figure 3.7 – Chemical structure of the nematic mixture known as E7. ... 37
Figure 3.8 – Chemical structure and molecular formula of octanoic acid. ... 39
Figure 3.9 – Chemical structure and molecular formula of hexadecanoic acid. ... 40
Figure 3.10 – Chemical structure and molecular formula of ethylene glycol. ... 40
Figure 3.11 – Chemical structure and molecular formula of triton X-100. ... 40
Figure 3.12 – Chemical structure and molecular formula of cetyl trimethyl ammonium bromide. ... 41
Figure 3.13 – Chemical structure and molecular formula of sodium dodecyl sulfate. .. 41
Figure 3.14 – Schematic illustration of an ITO cell. ... 42
Figure 3.15 – ITO cell. ... 42
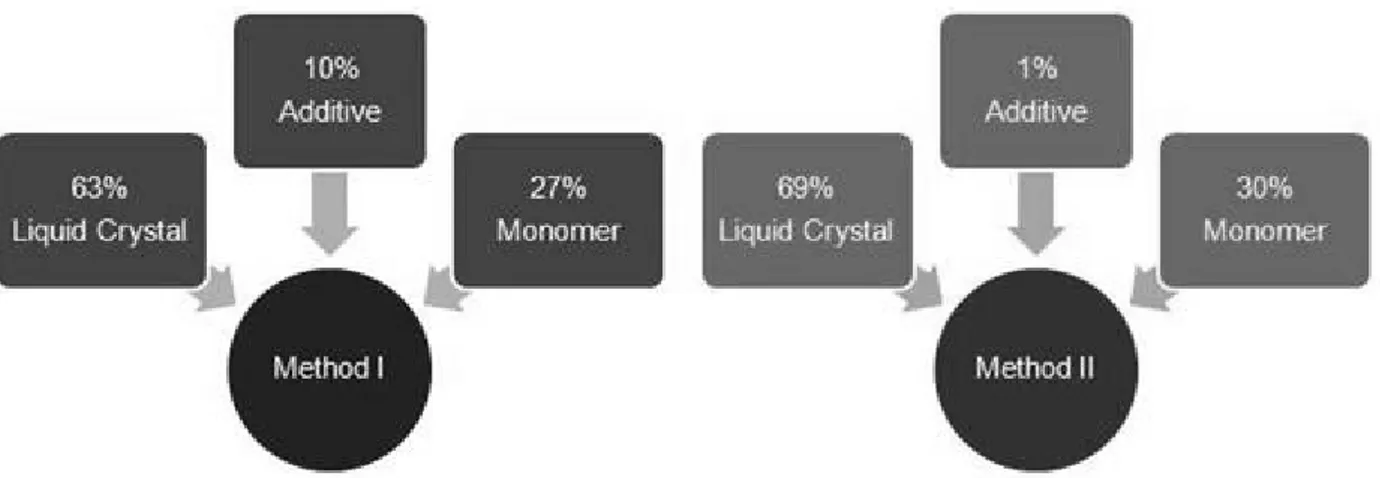
Figure 3.16 – Schematic illustration of method I and method II for the addition order. ... 44
Figure 3.17 – Schematic illustration of method I and method II for the quantity of additive. ... 45
Figure 3.18 – Schematic illustration of the chain length difference between octanoic and hexadecanoic acids. ... 45
Figure 3.19 – PhotoMax™ schematic monochromatic illuminator. ... 47
Figure 3.20 – Spectral ranges according to model. ... 49
Figure 3.21 – Construction of a typical transmitted light polarizing microscope. ... 50
Figure 3.22 – Schematic illustration of light transmittance according to the nicols alignment. ... 51
Figure 3.23 – Image observed under a polarized optical microscope according to the polarizers rotation. ... 51
Figure 3.24 – Construction of a typical scanning electron microscope. ... 52
Figure 3.25 – Schematic illustration of the electro-optic apparatus... 55
Figure 3.26 – Dielectric permittivity spectrum over a wide range of frequencies. ... 57
Index of Figures
The additive effects in Matrix Dispersed Liquid Crystals XX
Figure 4.2 – POM micrograph for (TRI/AIBN/E7/OA) ... 60
Index of Figures
Figure 4.25 – Electro-optic response of the system (POLY875/XDT/E7) with OA
changing the quantity of additive. ... 75
Figure 4.26 – POM micrograph for (POLY875/XDT/E7/OA1) ... 75
Figure 4.27 – Electro-optic response of the system (TRI/AIBN/E7) with HDA. ... 76
Figure 4.28 – POM micrograph for (TRI/AIBN/E7/HDA) ... 77
Figure 4.29 – SEM morphology for (TRI/AIBN/E7/HDA). ... 77
Figure 4.30 – Electro-optic response of the system (TRI/XDT/E7) with HDA. ... 78
Figure 4.31 – POM micrograph for (TRI/XDT/E7/HDA) ... 78
Figure 4.32 – Electro-optic response of the system (POLY875/AIBN/E7) with HDA. ... 79
Figure 4.33 – POM micrograph for (POLY875/AIBN/E7/HDA) ... 80
Figure 4.34 – SEM morphology for (POLY875/AIBN/E7/HDA). ... 80
Figure 4.35 – Electro-optic response of the system (POLY875/XDT/E7) with HDA. ... 81
Figure 4.36 – POM micrograph for (POLY875/XDT/E7/HDA) ... 81
Figure 4.37 – Electro-optic response of the system (TRI/AIBN/E7) with and without EG. ... 84
Figure 4.38 – POM micrograph for (TRI/AIBN/E7/EG) ... 85
Figure 4.39 – SEM morphology for (TRI/AIBN/E7/EG). ... 85
Figure 4.40 – Electro-optic response of the system (TRI/XDT/E7) with and without EG. ... 86
Figure 4.41 – POM micrograph for (TRI/XDT/E7/EG) ... 86
Figure 4.42 – Electro-optic response of the system (POLY875/AIBN/E7/EG). ... 87
Figure 4.43 – POM micrograph for (POLY875/AIBN/E7/EG) ... 88
Figure 4.44 – SEM morphology for (POLY875/AIBN/E7/EG). ... 88
Figure 4.45 – Electro-optic response of the system (POLY875/XDT/E7) with and without EG. ... 89
Figure 4.46 – POM micrograph for (POLY875/XDT/E7/EG)... 89
Figure 4.47 – Electro-optic response of the system (TRI/AIBN/E7) with and without TX100. ... 91
Figure 4.48 – POM micrograph for (TRI/AIBN/E7/TX100) ... 91
Figure 4.49 – SEM morphology for (TRI/AIBN/E7/TX100). ... 92
Index of Figures
The additive effects in Matrix Dispersed Liquid Crystals XXII
Figure 4.51 – POM micrograph for (TRI/XDT/E7/TX100) ... 93
Index of Figures
Figure 4.74 – SEM morphology for (POLY875/AIBN/E7/SDS). ... 107
Figure 4.75 – Electro-optic response of the system (POLY875/XDT/E7) with and without SDS. ... 107 Figure 4.76 – POM micrograph for (POLY875/XDT/E7/SDS) ... 108
Chapter Five
Figure 5.1 – DSC of E7 on heating stage. ... 114 Figure 5.2 – DSC of E7 on cooling stage. ... 114 Figure 5.3 – DSC of TX100 on heating stage. ... 115 Figure 5.4 – DSC of TX100 on cooling stage. ... 116 Figure 5.5 – DSC of the mixture (E7/TX100) on heating stage. ... 117 Figure 5.6 – DSC of the mixture (E7/TX100) on cooling stage. ... 118 Figure 5.7 – DRS of E7 for ε’. ... 120 Figure 5.8 – DRS of E7 for ε’’. ... 121 Figure 5.9 – DRS of TX100 on cooling and heating runs for ε’. ... 122 Figure 5.10 – DRS of the mixture (E7/TX100) for ε’. ... 123 Figure 5.11 – DRS of the mixture (E7/TX100) for ε’’. ... 125 Figure 5.12 – DRS of E7 in a polymer matrix for ε’. ... 126 Figure 5.13 – DRS of E7 in a polymer matrix for ε’’. ... 126 Figure 5.14 – DRS of the mixture (E7/TX100) in a polymer matrix for ε’. ... 127 Figure 5.15 – DRS of the mixture (E7/TX100) in a polymer matrix for ε’’. ... 128
Figure 5.16 – POM scanning temperature micrograph for (TRI/XDT/E7/TX100) on heating run. ... 130 Figure 5.17 – POM scanning temperature micrograph for (TRI/XDT/E7/TX100) on cooling run. ... 130
Appendix Section
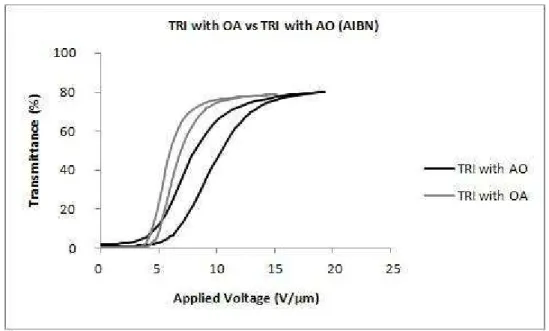
Figure A.1 - Electro-optic response of the systems based on (TRI/E7) with and without OA for a 20 μm cell gap. ... 143
Index of Figures
The additive effects in Matrix Dispersed Liquid Crystals XXIV
Figure A.3 – Electro-optic response of the systems based on (TRI/E7) with and without EG for a 20 μm cell gap. ... 144
Figure A.4 – Electro-optic response of the systems based on (POLY875/E7) with and without EG for a 20 μm cell gap. ... 144
Figure A.5 – Electro-optic response of the systems based on (TRI/E7) with and without TX100 for a 20 μm cell gap. ... 145
Figure A.6 – Electro-optic response of the systems based on (POLY875/E7) with and without TX100 for a 20 μm cell gap. ... 145
Figure A.7 – Electro-optic response of the systems based on (TRI/E7) with and without CTAB for a 20 μm cell gap. ... 146
Figure A.8 – Electro-optic response of the systems based on (POLY875/E7) with and without CTAB for a 20 μm cell gap. ... 146
Figure A.9 – Electro-optic response of the systems based on (TRI/E7) with and without SDS for a 20 μm cell gap. ... 147
Figure A.10 – Electro-optic response of the systems based on (POLY875/E7) with and without SDS for a 20 μm cell gap. ... 147
Figure A.11 - Electro-optic response of the systems based on (AIBN/E7) with and without OA for a 20 μm cell gap. ... 148
Figure A.12 – Electro-optic response of the systems based on (XDT/E7) with and without OA for a 20 μm cell gap. ... 148
Figure A.13 – Electro-optic response of the systems based on (AIBN/E7) with and without EG for a 20 μm cell gap. ... 149
Figure A.14 – Electro-optic response of the systems based on (XDT/E7) with and without EG for a 20 μm cell gap. ... 149
Figure A.15 – Electro-optic response of the systems based on (AIBN/E7) with and without TX100 for a 20 μm cell gap. ... 150
Figure A.16 – Electro-optic response of the systems based on (XDT/E7) with and without TX100 for a 20 μm cell gap. ... 150
Figure A.17 – Electro-optic response of the systems based on (AIBN/E7) with and without CTAB for a 20 μm cell gap. ... 151
Index of Figures
Figure A.19 – Electro-optic response of the systems based on (AIBN/E7) with and without SDS for a 20 μm cell gap. ... 152
Figure A.20 – Electro-optic response of the systems based on (XDT/E7) with and without SDS for a 20 μm cell gap. ... 152
Figure A.21 – Electro-optic response of the systems based on (TRI/AIBN/E7) for a 20 μm cell gap... 153 Figure A.22 – Electro-optic response of the systems based on (TRI/XDT/E7) for a 20 μm
cell gap. ... 153 Figure A.23 – Electro-optic response of the systems based on (POLY875/AIBN/E7) for a 20 μm cell gap. ... 154
Index of Tables
The additive effects in Matrix Dispersed Liquid Crystals XXVI
Index of Tables
Chapter Three
Table 3.1 – 1H NMR analysis of XDT. ... 37 Table 3.2 – Composition of E7. ... 38 Table 3.3 – Technical data sheet of E7. ... 38 Table 3.4 – Monomers and respective additives. ... 39
Chapter Four
Table 4.1 – Composition of the samples for the extra tests. ... 82 Table 4.2 – Electro-optical properties of the composites for the extra tests. ... 83 Table 4.3 – Composition of the samples. ... 109 Table 4.4 – Electro-optical properties of the composites. ... 110
Chapter Five
Table 5.1 – State transitions of E7 and TX100. ... 117 Table 5.2 – Nematic-isotropic and isotropic-nematic transitions of (E7/TX100). ... 129
Appendix Section
Chapter One
1.
Introduction
1.1.
The Liquid Crystals
The liquid crystals are a state of matter intermediate between the solid and the liquid phases. The difference between crystals and liquids is that the molecules in a crystal are ordered whereas in a liquid they are dispersed randomly (Collings & Hird, 2004). This intermediate state is known as mesophase which is the phase of a liquid crystalline compound between the crystalline and the isotropic liquid phases.
Figure 1.1 – Schematic illustration of the solid, liquid crystal and liquid phases.
Introduction
The additive effects in Matrix Dispersed Liquid Crystals 2
𝑇𝑇𝑚𝑚 represents a melting point where the molecules lose their positional degrees of
freedom and 𝑇𝑇𝑐𝑐 represents a clearing point where the molecules lose their orientational degrees of freedom.
This phase exhibits simultaneously optical properties and mechanical properties, characteristics of the crystals and the liquids, respectively, such as anisotropy in their optical, electrical and mechanical properties or high fluidity and coalescence of droplets.
Although liquid crystals combine the properties from a solid and an isotropic liquid, they exhibit a very specific electro-optical phenomenon that is not verified in a single crystal or in a single isotropic liquid (Senyuk, 2006).
1.1.1. Types of Liquid Crystals
A number of different types of molecules form liquid crystal phases and what they all have in common is that they are anisotropic (Collings & Hird, 2004). Liquid crystal phases can be divided into two classes, the thermotropic and the lyotropic.
The thermotropic liquid crystalline phase occurs among a certain temperature interval (Collings & Hird, 2004), which means that it is the temperature, that by decreasing or increasing, turns the substance into a crystal or into a liquid, respectively (Collings, 2002). These substances do not require the presence of a solvent to form liquid crystalline materials. Figure 1.2 a) (Senyuk, 2006), 4-cyano-4’-n-pentyl-1,1’-byphenyl,
represents a molecule whose format is rod shaped, characteristic of the calamitic thermotropic liquid crystals.
Introduction
There is another kind of thermotropic liquid crystals where molecules format is disc
shaped, as shown in Figure 1.2 b) (Senyuk, 2006), benzene-hexa-n-pentanoate. Therefore, these are called as discotic liquid crystals. Although calamitic and discotic liquid crystal structures are different, their appearance at the microscope is similar (Collings, 2002).
On the other hand, there are types of molecules that only form a liquid crystal phase when mixed with a solvent of some kind. In these cases, it is the concentration of the solution that determines whether a liquid crystal phase is stable, instead of the temperature (Collings, 2002). These substances are named lyotropic liquid crystals. Examples of this kind of molecules are soaps, illustrated in Figure 1.3 (Senyuk, 2006), sodium dodecyl sulfate, a molecule with a hydrophilic polar head and a hydrophobic non-polar tail.
Figure 1.3 – Example of a lyotropic liquid crystal molecule.
1.1.2. Liquid Crystal Phases
There are various kinds of liquid crystal structures, but the more common are the nematic, the cholesteric and the smectic phases.
Introduction
The additive effects in Matrix Dispersed Liquid Crystals 4
Figure 1.4 – Schematic illustration of the nematic liquid crystal phase.
Some deformation can occur in the nematics such as splay, twist and band types, being the twist type the deformation behind the most common liquid crystal displays.
Nematics are similar in their basic structure to other liquid crystal phase, the cholesterics, illustrated in Figure 1.5 (Senyuk, 2006). But the optical properties of the cholesterics are significantly different due to their strong twisting presented in a kind of helical axis where each layer is twisted.
Figure 1.5 – Schematic illustration of the cholesteric liquid crystal phase.
If the molecules that form the liquid crystal are chiral, then those chiral molecules are responsible for the helical phase of the cholesteric, causing a twist in the nematic structure as phases are replaced (Collings & Hird, 2004).
Introduction
Figure 1.6 – Schematic illustration of the smectic liquid crystal phase.
Figure 1.6 a) (Senyuk, 2006) shows the structure of the smectic A phase and Figure 1.6 b) (Senyuk, 2006) shows the structure of the smectic C phase. These two phases are the most common inside the smectic phases and differ one to another by the direction that the molecules are more likely to be aligned, according to the director vector, explained below.
1.2.
Basics of Liquid Crystals
In general, some terms are common to all kinds of liquid crystals described above and those definitions are important to understand how the liquid crystals work. These basics will be described below, as follow.
1.2.1. Director and Degree of Order
The distinguishing characteristic of the liquid crystalline state is the tendency of the molecules to point along a common axis, called the director vector, represented by 𝑛𝑛. The director gives the direction of the preferred orientation of the liquid crystal molecules, being directions, +𝑛𝑛 and −𝑛𝑛, equivalent. The important thing is the direction that the molecules are pointing, except for molecules with permanent dipole moments.
Introduction
The additive effects in Matrix Dispersed Liquid Crystals 6
the degree of order, defined by 𝑆𝑆, 0 < 𝑆𝑆< 1. In a perfectly oriented system, 𝑆𝑆= 1,
and in an isotropic liquid state, with no orientational order, 𝑆𝑆= 0.
In the mesophase, this value is among the two limits of the degree of order interval, being in the range of 𝑆𝑆= 0.3~0.9, as temperature decreases (Senyuk, 2006).
Almost all surfaces make the director to orient in a specific direction near that surface. Thus, three types of alignment can be considered, according to different orientations. This way, liquid crystals can have planar, tilted or homeotropic orientations.
1.2.2. Anisotropy
The property of liquid crystals that distinguishes them from liquids is the higher degree of order among the molecules.
All liquids and gases are isotropic, that is, any property measured along one direction of space has the same value when measured along any other direction. Obtaining the same result regardless of direction is called isotropy.
The order of the molecules, as they become liquid crystals or solids, destroys the isotropy of liquids and produces anisotropy. This means that any property measured along one direction of space would be different from any other direction, that is, the physical properties vary with the direction (Collings, 2002).
The orientational order of the anisotropic molecules depends on the optical, mechanical, electric and magnetic properties. This orientation of the liquid crystal molecules is, effectively, controlled by electric and magnetic fields. By changing the liquid crystal molecules orientation, it is possible to change the optical and mechanical properties of the system (Senyuk, 2006).
In liquid crystals there are two main types of anisotropies, the optic and the dielectric anisotropies. The optic anisotropy is related to the refractive indices of the compound, which are two different ones, the ordinary and the extraordinary indices, 𝑛𝑛𝑚𝑚 and 𝑛𝑛𝑒𝑒, respectively. The first one is measured perpendicularly to the optic axis while the second is measured parallel to the same axis.
Introduction
director, designated by 𝜀𝜀∥ and 𝜀𝜀⊥, respectively. For applications based on the variation
of an applied electric field it is wise that ∆𝜀𝜀 is reasonably high to achieve a fast orientation of the director with the applied field for low voltages (Almeida, 2003).
1.2.3. Liquid Crystals in Electric Fields
When electric fields are applied to molecules, different kinds of molecules experience different forces. If the molecule is charged, it experiences a force in the direction of the field if it is positively charged and in the direction opposite to the field if it is negatively charged. This force tends to move the molecule along one of these two directions.
Figure 1.7 illustrates a liquid crystal molecule in the presence of an electric field. If the dipole moment of the molecule is parallel to the director, Figure 1.7 a), adapted (Senyuk, 2006), the molecules tend to align according to the direction of the electric field and if the dipole moment of the molecule is normal to the director, Figure 1.7 b), adapted (Senyuk, 2006), the molecules tend to align perpendicularly to the direction of the electric field.
Introduction
The additive effects in Matrix Dispersed Liquid Crystals 8
The strength of the electric field necessary to orient the director of a liquid crystal is
relatively low since the director of a liquid crystal is usually free to orient in any direction.
1.2.4. Surface Anchorage and Memory Effect
The surface anchorage is a peculiarity of the liquid crystal molecules when they lose their orientational degrees of freedom. Figure 1.8 (Brás et al., 2008) shows a scheme on how anchorage and anchorage breaking works.
Figure 1.8 – Surface anchorage when external fields are applied.
Introduction
to the anchoring interaction with the polymer surface, this interfacial shell holds in its
interior anchored molecules that will influence the orientation of the adjacent ones through the elastic restoring forces arising in the deformed nematic. Before applying any field the inclusions are randomly distributed. Under the action of a determined electric field, the molecules in the bulk reorient along the field but the anchored molecules at the interface impair a full homeotropic alignment. Above that determined field, the anchoring of the molecules to the polymeric surface is broken and the molecules at the surface adopt an alignment towards the field direction that tends to persist after field removal. This alignment at the surface determines the orientation of the remaining liquid crystal giving rise to a higher transparency even in the off state, here defined as permanent memory effect. These anchorage links are easily broken by the increase of temperature. Figure 1.9 illustrates the difference between surface anchorage and permanent memory effect. The arrows represent liquid crystal molecules and their respective director.
Figure 1.9 – Surface anchorage and permanent memory effect.
In literature, the memory effect is understood as a hysteresis, this is, when the applied voltage is taken and the cell returns to the opaque state, it does not return at the exactly same voltage and transmittance coordinates that it took to turn into a transparent state when voltage was applied. The difference between those two paths is understood as the hysteresis of the sample, which is its memory effect.
Introduction
The additive effects in Matrix Dispersed Liquid Crystals 10
1.3.
Polymer Liquid Crystals
If combined with a polymer, thermotropic and lyotropic liquid crystals can originate a new type of liquid crystal, called polymer liquid crystals, and as in a single liquid crystal, in polymer liquid crystals there can be two classes, the thermotropic and the lyotropic. They might occur either by solving a polymer in a solvent or by heating a polymer above its glass or melting transition point.
The first class consists of monomers that are fairly rigid, anisotropic and highly polarizable. These monomers are either rod-shaped or disc-shaped. The second class of monomers causing liquid cristallinity in the polymer is the amphiphilic monomers (Collings, 2002).
1.3.1. Types of Polymer Liquid Crystals
The thermotropic polymer liquid crystals are formed when the polymeric material is heated to a point where the solid phase melts and lyotropic polymer liquid crystals consist of large molecules that form phases with orientational order when dissolved in ordinary solvents, becoming the polymer liquid crystal phase more dependent on concentration than on temperature.
The monomers can be attached together to form a polymer in two different ways, main chain polymers if the monomers form a long single chain by attaching to one another and side chain polymers if the monomers end up as branches extending away from the polymer chain. Figure 1.10, adapted (Gordon, 1997), illustrates the types of polymers that can be formed with anisotropic units.
Introduction
Each ellipse represents a mesogenic unit, the rigid part of the monomer, and the links
represent the spacers, the flexible parts of the monomer. The mesogens are the monomer sections that display orientational order in the liquid crystal phases. The functionality of the liquid crystal is similar to the previous mentioned, without the polymer extensions.
Other factors influencing the mesomorphic behavior of polymers include the presence of long flexible spacers, a low molecular weight, and regular alternation of rigid and flexible units along the main chain (Gordon, 1997).
1.4.
Liquid Crystal Displays
Nowadays we live in the age of information. Liquid crystal displays have played an important role of development in this era and are meant to keep playing it in the future.
Information displays use the ability to control light in order to operate by controlling what parts of a display are bright and what parts are dark. That way, active and passive displays are considered, light-emitting diode and liquid crystal displays, respectively. Both active and passive displays that are illuminated from behind or beside must use electrical power to generate light. Passive displays that utilize ambient light do not consume electrical power in order to generate light and, therefore, require much less power to operate. This is the largest advantage of liquid crystal displays that rely on ambient light for their operation (Collings, 2002). The amount of power needed to operate these displays is much less than for other displays, making liquid crystal displays ideal for battery-operated equipments.
1.4.1. Applied Voltages
Introduction
The additive effects in Matrix Dispersed Liquid Crystals 12
Figure 1.11 – Electro-optic response curve of a typical display.
Voltage is important in three characteristics of the response. The change in the brightness, called threshold voltage, 𝑉𝑉𝑡𝑡ℎ in Figure 1.11 (Collings, 2002), and the need to increase voltage so the brightness also increases. A third characteristic is related with the quickness of the device response as the voltage is either applied or removed (Collings, 2002).
In most liquid crystal displays, this characteristic differs because the device turns on by responding to the application of a voltage, but simply relaxes back to its initial state when the voltage is removed. This can be seen in Figure 1.12 a) and b) (Collings, 2002), respectively, where 𝑇𝑇𝑚𝑚𝑛𝑛 and 𝑇𝑇𝑚𝑚𝑜𝑜𝑜𝑜 represent the times between application of the
voltage and a 90% change in brightness. 𝑇𝑇𝑚𝑚𝑛𝑛 is also symbolized as 𝑉𝑉90 and 𝑇𝑇𝑚𝑚𝑜𝑜𝑜𝑜 is also symbolized as 𝑉𝑉10 (Collings, 2002).
Introduction
Figure 1.12 – Turn-on and turn-off responses for a typical liquid crystal display.
The characterization of the composites in this work is made through the following parameters, like transmittance, contrast and applied voltages. 𝑇𝑇𝑚𝑚𝑚𝑚𝑚𝑚 represents the maximum transmittance obtained with the respective sample, 𝑇𝑇𝑚𝑚𝑚𝑚𝑛𝑛 represents the minimum transmittance obtained with the respective sample and 𝑇𝑇ℎ𝑚𝑚𝑚𝑚𝑜𝑜 is calculated by
Equation 1 and represents the average transmittance to switch the cell from its opaque to transparent state.
𝑇𝑇ℎ𝑚𝑚𝑚𝑚𝑜𝑜 =𝑇𝑇𝑚𝑚𝑚𝑚𝑚𝑚 − 𝑇𝑇2 𝑚𝑚𝑚𝑚𝑛𝑛 (1)
The switching voltage, 𝑆𝑆𝑉𝑉, that characterizes the composite is the applied voltage in which transmittance is 𝑇𝑇ℎ𝑚𝑚𝑚𝑚𝑜𝑜.
The contrast ratio is an important factor to the functionality of a polymer dispersed liquid crystal display. A high contrast ratio is the desired aspect of any display, but there are various methods of measuring it. The general formula to calculate the contrast ratio is given by Equation 2. Meanwhile, some of the samples prepared have a minimum transmittance of zero, meaning that mathematically it is impossible to define a contrast ratio number to be comparable with the other samples. Therefore, the values presented for the contrast of the samples were calculated by Equation 3.
𝐶𝐶𝑚𝑚𝑛𝑛𝑡𝑡𝐶𝐶𝑚𝑚𝐶𝐶𝑡𝑡𝑅𝑅𝑚𝑚𝑡𝑡𝑚𝑚𝑚𝑚= 𝑇𝑇𝑚𝑚𝑚𝑚𝑚𝑚 𝑇𝑇𝑚𝑚𝑚𝑚𝑛𝑛
Introduction
The additive effects in Matrix Dispersed Liquid Crystals 14
𝐶𝐶𝑚𝑚𝑛𝑛𝑡𝑡𝐶𝐶𝑚𝑚𝐶𝐶𝑡𝑡= 𝑇𝑇𝑚𝑚𝑚𝑚𝑚𝑚 − 𝑇𝑇𝑚𝑚𝑚𝑚𝑛𝑛 100
(3)
The 𝑇𝑇 𝑉𝑉⁄ Ratio represents the transmission-to-voltage ratio, Equation 4. This is a measure of performance of the device as a whole, with the switching transmittance divided by the switching voltage, to give an idea of the device is need on voltages to state transitions. When this ratio is higher, the better, meaning that the system needs only a few applied voltage to reach its half transmittance point, while low ratios mean that the system require high voltages to reach its half transmittance point or even might the voltages be low, but the transmittance is not good enough.
T V⁄ 𝑅𝑅𝑚𝑚𝑡𝑡𝑚𝑚𝑚𝑚 = 𝑇𝑇ℎ𝑚𝑚𝑚𝑚𝑜𝑜
𝑆𝑆𝑆𝑆𝑚𝑚𝑡𝑡𝑐𝑐ℎ𝑚𝑚𝑛𝑛𝑔𝑔𝑉𝑉𝑚𝑚𝑚𝑚𝑡𝑡𝑚𝑚𝑔𝑔𝑒𝑒 (𝑉𝑉)
(4)
1.4.2. Types of Liquid Crystal Displays
There are many types of liquid crystal displays, such as the dynamic scattering mode that consists in two glass plates involving transparent electrodes and it works with low voltages in a range of approximately 10~20 𝑉𝑉, but the liquid crystal must possess some charged impurities, which can be achieved by adding impurities to the liquid crystal. The disadvantage of this display is that the contrast ratio is not very high (Collings, 2002).
Introduction
are crossed on either side of it. In the absence of an electric field, the surface induces a
twist of the director, which rotates the polarization axis of the light, thus allowing it to pass through the second polarizer. The presence of an electric field removes this rotation, therefore allowing no light to pass through the second polarizer.
The main advantage of the twisted nematic liquid crystal display is its higher contrast ratio and the threshold voltage being low, on the order of a few volts. But it also has disadvantages such as different areas of the cell would twist in opposite directions when no voltage was applied or the brightness versus voltage curves is not great (Collings, 2002).
Liquid crystal displays can use dyes, which absorb light of a certain wavelength, causing the light reflected from or transmitted through the dye to appear colored.
Other displays use birefringent liquid crystals using the birefringence effect to operate. This effect can be explained when the phase angle between light polarized along one direction and light polarized along a perpendicular direction changes continuously as the light propagates through a liquid crystal.
As nematics and cholesterics can be used to make liquid crystal displays, also the smectics can. The smectic liquid crystal displays usually do not respond to applied electric and magnetic fields as easily as nematics do. For this reason, simple application of an electric field rarely produces enough change in the optical properties of a smectic liquid crystal to be useful for display purposes.
These last three types are still in development but recently, development in liquid crystal displays utilizes polymers either to contain the liquid crystal material or to promote a specific texture. These displays are easily fabricated and offer some significant advantages over other types of liquid crystal displays.
1.4.3. Polymer Dispersed Liquid Crystal Displays
Introduction
The additive effects in Matrix Dispersed Liquid Crystals 16
Three methods of polymer dispersed liquid crystal films preparation are described in
the literature. The first one consists in filling the polymer micropores with a liquid crystal, the second one involves the formation of polymer dispersed liquid crystal films from an aqueous emulsion and the third one, and used in this work, is the polymerization induced phase separation (Torgova et al., 2004). Usually, there are two types of morphologies in a polymer dispersed liquid crystal. One is a kind of swiss cheese, Figure 1.13 a), adapted (Han, 2006), and the other is based on polymer balls, Figure 1.13 b), adapted (Han, 2006). The last case is the scenario verified in this work, which promotes the appearance of permanent memory effects.
Although the morphologies are very different, the theory behind its operation is, practically, the same. In the systems studied, the morphology is of polymer balls, this is, instead of droplets, the liquid crystal runs through channels within the polymer formed when phase separation occurs.
Figure 1.13 – Polymer dispersed liquid crystal morphology.
By changing the orientation of the liquid crystal molecules with an electric field, it is possible to vary the intensity of transmitted light. The configuration of the liquid crystal droplets in a polymer matrix is the focus of much current research. Many different configurations have been observed and they depend on factors such as droplet size and shape, surface anchoring and applied fields (Collings & Hird, 2004). In a polymer dispersed liquid crystal display there are many droplets with different configurations and orientations. Figure 1.14 (Gordon, 1997) shows those orientations. The radial configuration occurs when the liquid crystal molecules are anchored with
Introduction
droplet wall, but only when there is weak surface anchoring. Finally, the bipolar
configuration is obtained by tangential anchoring of the liquid crystal molecules that creates two point defects at the poles of the droplet (Gordon, 1997).
Figure 1.14 – Possible orientations and configurations of liquid crystal droplets.
In a typical polymer dispersed liquid crystal sample, there are many droplets with different configurations and orientations. A thin polymer dispersed liquid crystal film is deposited between clear glass covers that are coated with a very thin layer of a conducting material known as indium tin oxide.
Figure 1.15 – Working principle of a polymer dispersed liquid crystal display.
When an electric field is applied, however, the molecules within the droplets align along the field and have corresponding optical properties, as can be seen in Figure 1.15, adapted (Martins, 2004). When voltage is not applied, the light enters the cell and, following the orientation of the liquid crystal molecules, takes different directions, meaning that the cell keeps its opacity and the image is not transmitted. When voltage is applied, the light enters the cell and, once the liquid crystal molecules are completely aligned, follows the orientation of those molecules allowing the image to be transmitted, meaning that the cell is clear.
Introduction
The additive effects in Matrix Dispersed Liquid Crystals 18
question. In the absence of an external electric field, the director orientation of the
liquid crystal varies randomly from droplet to droplet. In this case, the liquid crystal refractive indices are different from the polymer refractive index and produce a strong light scattering that makes the sample opaque. While in the presence of an external electric field of sufficient intensity, the liquid crystal droplets align towards the direction of applied electric field and sample appears transparent, due to the matching of refractive indices of liquid crystal droplets and polymer (Malik & Raina, 2004).
1.5.
Applications of Liquid Crystals
Liquid crystal technology has had a major effect in many areas of science and engineering, as well as device technology. Applications for this special kind of material are still being discovered and continue to provide effective solutions to many different problems (Collings, 2002).
The most common application of liquid crystal technology is liquid crystal displays, such as digital watches, calculators, thermometers, personal laptops, among others. An application of liquid crystals that is only now being explored is optical imaging and recording. Liquid crystals have a massive amount of other uses. They are used for non destructive mechanical testing of materials under stress or used in medical applications. Low molar mass liquid crystals have applications including erasable optical disks, full color electronic slides for computer-aided drawing and light modulators for color electronic imaging (Collings & Hird, 2004).
Introduction
1.5.1. Polymer Liquid Crystals applications
Polymer liquid crystals will most certainly become more important as research into this field progresses. Applications for these materials range from the production of high-strength materials, such as resistant plastics to their use in optical devices.
An application of polymer liquid crystals that has been successfully developed for industry is the area of high strength fibers and applications calling for strong and light weight materials (Collings & Hird, 2004).
At this time, polymer liquid crystals demonstrate relatively slow response times when compared to polymer dispersed liquid crystals, giving rise to displays based on polymer dispersed liquid crystals.
1.5.2. Polymer Dispersed Liquid Crystals applications
Polymer dispersed liquid crystals hold potential for a variety of electro-optic applications ranging from displays to light shutters (Doane, 2006). These windows are based on the ability of the nematic director of the liquid crystal droplets to align under an electric field, case of study in this master thesis.
Chapter Two
2.
Literature Review
2.1.
Before the Discovery
Before the discovery of liquid crystals, a few European investigators observed some new and interesting phenomena but never fully realized exactly what was happening in their experiments.
In a time frame from 1850 to 1888, three different types of studies were carried out. The first one concerned the study of some biological specimens where effects on the polarization microscopy were observed. The second one involved the study of how substances crystallize where the transitions from liquid to solid state were not so direct, but change to an amorphous form of state, which then crystallized. Finally, an experience with stearin, reported that it possesses an unusual melting behavior, appearing as two melting points (Collings, 2002).
These phenomenons were the first notices published of strange materials, known today as liquid crystals.
2.2.
The Discovery of Liquid Crystals
Literature Review
The additive effects in Matrix Dispersed Liquid Crystals 22
However, the labeling liquid crystals is attributed to Lehmann, a German professor of
physics that described that substance as a combination of characteristics such as flow properties like a liquid and optical properties like a solid.
From this point, chemists, physicists, biologists, engineers and medical doctors are involved in liquid crystal researches (Collings, 2002).
2.3.
After the Discovery
After the discovery, scientists reported that many substances known as liquid crystals
behaved differently from ones to the others and by the turn of the 20𝑡𝑡ℎ century, Lehmann observed that a solid surface in contact with a liquid crystalline substance causes the liquid crystal to orient in a certain direction. This was of extreme importance when modern scientists began to experiment with liquid crystal displays. The liquid crystal phases were published by Friedel in 1922, where themes like the molecular ordering, orientations, structures and the presence of the electric fields were spoken for the first time. The action of the electric and magnetic fields on liquid crystals began to be understood, mainly due to experiments performed in Holland and in the former Soviet Union. The first empirical equation was the degree of order, described by the order parameter, which proved to be the closest to describe the actual order present in liquid crystals. This order parameter is the base of all the recent developments since 1940 (Collings, 2002).
2.4.
Recent Developments
Literature Review
By the year of 1968, two scientists demonstrated that a thin layer of liquid crystal was
capable of switching from cloudy to clear when an electrical voltage was applied. Although this was the first liquid crystal display, it required too high a voltage, consumed too much power and produced a display of poor quality. Within ten years liquid crystal displays that required extremely little power were being used by manufacturers of battery-operated equipments.
During the decade of 1980, the study of liquid crystals played an important role in understanding how molecules behave cooperatively and how molecular structure influences this behavior.
Since the beginning of the 21𝐶𝐶𝑡𝑡 century the field of liquid crystals is maturing, for instance, the study of the interactions between liquid crystals and surfaces has revealed a great deal of new information, opening the door to both improved and new applications. What has characterized the last ten years has been the increase in performance and reliability over earlier liquid crystal applications (Collings, 2002).
2.4.1. Polymer Dispersed Liquid Crystals
One of those areas that have been maturing since the last two decades is the polymer dispersed liquid crystals. Investigation of very kinds has been developed in the scope of the search for the optimum device.
The role of polymeric materials in the blends is very important. Polymer plays an auxiliary but very important role in achieving required effects related to the presence of a liquid crystal in various devices (Mucha, 2002).
To study the effect of the monomer functionality, Pogue et al. studied uniform illumination and non-uniform illumination using monomers with different number of acrylate groups, while keeping the liquid crystal concentration constant. The tendency is to form anisotropically-shaped domains for higher functional syrups. These domain anisotropy differences are correlated with the number of reactive double bonds per monomer (Pogue et al., 2000).
Literature Review
The additive effects in Matrix Dispersed Liquid Crystals 24
hydrophobicity of the liquid crystalline polymer changes the droplet size of the
polymer dispersed liquid crystal films and the anchoring energy between the polymer matrix and the liquid crystal droplets. As the hydrophobicity of the matrix increases, the droplet size of liquid crystal domain also increases, on the contrary, anchoring energy decreases, leading to the decrease of driving voltage (Park et al., 2000).
An important parameter to keep in mind is the effect of the temperature on the optical and electro-optical behaviors of these materials, once the liquid crystal used is a thermotropic liquid crystal. This temperature effect has influence in the electro-optical properties because for high liquid crystal concentrations it is observed that at room temperature the transmittance suffers a strong decrease due to the homogeneous distribution of phase-separated liquid crystal droplets that occupy a large part of the polymer matrix (Deshmukh & Malik, 2008).
The effect of lowering the viscosity and that of decreased degree of polymerization with increased temperature, leads to easier coalescence of liquid crystal droplets after phase separation (Ahn & Ha, 1999).
Yet another important aspect is the dependence of the electro-optic activity on the separation of the polymer and liquid crystal phases. Since the phase structure develops in a non-equilibrium system, the morphology of the liquid crystal domains depends on the details of the chemical and physical processes active during domain formation (Justice et al., 2005).
Optical devices based on polymer dispersed liquid crystal thin films derive their functional properties from the electric field induced reorientation of liquid crystal microdroplets. In these materials, the liquid crystal reorientation dynamics are strongly dependent on droplet size and shape, as well as interfacial interactions between polymer and liquid crystal (Higgins et al., 2005).
Literature Review
2.4.2. External Fields
The science behind the operation of a polymer dispersed liquid crystal involves the use of external fields, nominated, an electric field. Some studies have been conducted, exclusively, in this area.
The electrical properties of polymer dispersed liquid crystals are an important characteristic in their electro-optical performance. Doping a polymer dispersed liquid crystal with low percentages of a conducting polymer allows a fine adjustment of polymer matrix conductivity. This leads to a large reduction in the reorientational fields and relaxation times, making them optimal for the electro-optical studies (Cupelli et al., 2004).
Huang et al. studied the electrical field in a nematic droplet dispersed in a polymer matrix. The field within the droplet is uniform and its direction is different from that of the applied field (Huang et al.).
Meanwhile, Zhang et al. studied the effects of the electric field, through direct current on the phase separation of polymer dispersed liquid crystals. They verified that this phase separation process accelerates when the electric field is applied. This appliance during the phase separation process yields the polymer dispersed liquid crystal with small liquid crystal domains and fine morphologies (Zhang et al., 2003).
This way, the electric field is a very important step, not only to the operation of the devices, but also to the shapes and morphologies that the polymers will exhibit when submitted to the presence of an external field.
2.4.3. Surface Anchorage
The surface anchorage is, directly, connected to the surface tension of the liquid crystal molecules.
Literature Review
The additive effects in Matrix Dispersed Liquid Crystals 26
also changes the shape of the drops from spherical to, approximately, ellipsoidal, due
to a reduction in the interfacial tension (Kim et al., 2004).
Anisotropy is a very important characteristic of the liquid crystals and Tsvetkov et al. studied it on the liquid crystal surface tension. The lowest surface tension is observed for homeotropic orientation, the highest for planar orientation and average for the homeoplanar orientation (Tsvetkov et al., 1999).
Related to the surface anchorage are the memory effects. This means that the anchoring strength is dependent on the history of the sample. Once defined, the preferred orientation of the liquid crystals remains stable even under strong applied torque or repetitive nematic to isotropic transitions (Stoenescu et al., 1999). However, this memory effect is not present when the monomer molecules show a low solubility in liquid crystal droplets (Nicoletta et al., 2000). But some composites present a memory state, which means that higher transmittances are preserved without applying voltage. The memory state can be erased and changed to the scattering off-state by heating the film to the clearing temperature of the liquid crystal (Kalkar et al., 1999).
A fine study of the anchoring characteristics and interfacial interactions analyzed that anchoring energies calculated from the interfacial tensions indicated that the liquid crystal and polymer interfaces are strong. On addition of a surfactant, the anchoring energy at the interface of the liquid crystal and the surfactant becomes weaker. This decrease in anchoring strength may be one of the major factors responsible for a reduction in droplet sizes and also a lowering of critical fields for switching. Therefore, the surfactant, at a low concentration, helps reducing the surface tension (Patnaik & Pachter, 1998).
Literature Review
2.4.4. Additive Effects
The main theme of this thesis is the additive effects to the polymer dispersed liquid crystals. Other authors have already made some studies based on this theme, studying factors as the influence of surfactants, the surfactant effects on morphologies, the effects of surfactants on electro-optical properties, and so on.
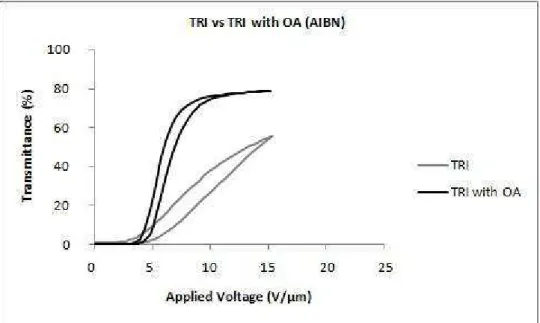
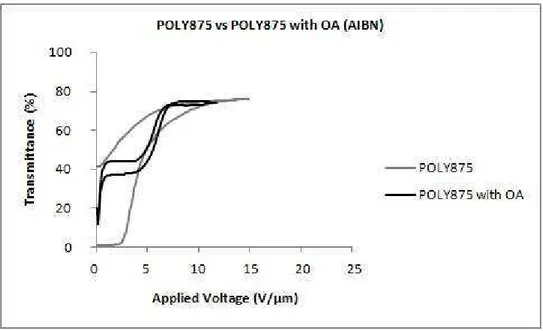
With the addition of a non-reactive surfactant-like molecule, a substantial lowering of the switching field is attributed to a modification of the anchoring properties of the liquid crystal molecules and the polymer host. These molecules act to contaminate the liquid crystal droplets, reducing the clearing temperature (Klosterman et al., 2004). In agreement with the previous article, other authors studied the effects of octanoic acid on the morphology and electro-optic properties of polymer dispersed liquid crystals and found that droplet sizes decrease with increasing octanoic acid content. An octanoic acid concentration in weight of, approximately, 6% was selected, for which a minimum switching voltage of 5 𝑉𝑉.𝜇𝜇𝑚𝑚−1 and maximum contrast ratio were obtained (Kim & Woo, 2007).
A very similar study shows that surfactants with greater spreading coefficient give smaller droplets, greater diffraction efficiency, driving voltage, contrast ratio and smaller response times (Shim et al., 2008).
All this thematic is linked with many aspects and yet another study was done on the electro-optical properties of holographic polymer dispersed liquid crystals proving that surfactants can effectively reduce the driving voltage, being the threshold voltage reduced from 13 𝑉𝑉.𝜇𝜇𝑚𝑚−1 to about 2.3 𝑉𝑉.𝜇𝜇𝑚𝑚−1 (Liu et al., 2004).
Surfactants can also be used to lower the hysteresis problems in these materials, correlating the hysteresis behavior of the polymer dispersed liquid crystal film with the interaction of the surfactants at the material interface (Chung et al., 1997).
Literature Review
The additive effects in Matrix Dispersed Liquid Crystals 28
2.4.5. Electro-Optical Studies
As described above, many are the studies on electro-optical properties of polymer dispersed liquid crystal films. Usually, they are prepared by the polymerization induced phase separation.
In an experiment, switching can be seen by naked eye. Threshold voltage is measured observing microscopically the polarization texture changes of the liquid crystal as it tends to switch. Transmittance of the film is measured with a visible spectrometer as a function of wavelength (Karapinar, 1998). The transmitted light is usually captured with a collimated beam of polarized 𝐻𝐻𝑒𝑒 − 𝑁𝑁𝑒𝑒 laser with wavelength at 632.8 𝑛𝑛𝑚𝑚 (Kalkar et al., 1999).
In electro-optic studies, the response curve is slightly different when the elaboration of the films is exposed to electron-beam or ultraviolet radiations. The main difference is that the electro-optical response of the electron-beam cured system shows no evidence of memory effects since the off state transmission remains unchanged, while ultraviolet cured films exhibit a large memory and the voltages 𝑉𝑉10 and 𝑉𝑉90 are relatively high (Maschke et al., 2002).
As every aspect of liquid crystal basics is explicit in every field of investigation in this area, so is the alignment of the liquid crystal droplets connected to the electro-optical responses. For a random distribution, the droplet orientation and the optical phase shift change more gradually with the applied field. These results demonstrate that polymer dispersed liquid crystals may be suitable for a wide range of electro-optic applications (Levy, 2000).
This matrix dispersed liquid crystal is very versatile and even ionic polymer matrix can be used. The electro-optical properties will depend on many parameters of materials, including the liquid crystal properties and the properties of the matrix. The effect of the ionic contents in the polymer matrix is that as the ionic content to liquid crystal ratio increases, more effective are the electro-optic properties of the systems (Choi et al., 1998).
Literature Review
and their relative model compounds with various alkyl chain lengths even got better
electro-optical effects (Liu & Wu, 2005).
Late improvements in the electro-optical properties of polymer dispersed liquid crystals showed that with the addition of cross-linkers, bonds that attach one polymer chain to another, the droplet size of liquid crystal becomes smaller when more cross-linker is added, affecting the properties of polymer dispersed liquid crystal devices, such as response time and driving voltage (Koo et al., 2008).
With cross-linked films, several trends are observed, for example, the cross-linking agent has strong influence on the cells contrast but not on the cell is maximum transmission or turn on voltages, while the film thickness shows preponderantly its influence on the cell is maximum transmission and turn on voltages (Almeida et al., 2002).
As we might see, there are innumerous experiments that can be made with liquid crystals and how their technology has developed so far, specifically in the area of the polymer dispersed liquid crystals.
2.5.
Problem Definition and Proposed Solution
In a polymer dispersed liquid crystal, the functionality depends on the applied voltages. To light shutters installed at homes and offices, voltages required for the shutters to operate can be high, using the alternating current available in those buildings, as Figure 2.1 shows (Xinology, 2008).
Figure 2.1 – Polymer dispersed liquid crystal shutters in an office.
Literature Review
The additive effects in Matrix Dispersed Liquid Crystals 30
For portable displays, such as memos, these voltages must be even lower, so that the
device uses an AA battery, 1.5 𝑉𝑉 or in the maximum, a 9 𝑉𝑉 battery, considering that these batteries when operated are connected to an inverter, so current is alternate.
2.5.1. General Aspects
The major challenge is the reduction of the applied voltages so the polymer dispersed liquid crystal application is a portable device.
To do so, many factors are present like the cell gap, the type of glass used, the monomers in use, among others.
When the spacer length is minimal, the voltages applied are also more reduced than if larger spacers were used. The driving voltage decreases with decreasing thickness, but when the thickness of the cell is below 10 𝜇𝜇𝑚𝑚 values start to become similar to the ones observed with the referred thickness, being that sometimes voltages are even superior, because droplets are either smaller or less spherically shaped (Atkins & West). Besides that, when the thickness of the cell becomes smaller, its opacity degree decreases due to the small amounts of liquid crystal present in the sample.
The type of glass used must be conducting glass so that the voltage applied covers the entire sample. This is required for the final application and to test the electro-optical response curves.
Other types of glass, as silica-gel glasses are used by sol-gel processes that trap organic molecules into inorganic oxides. Usually, single molecules are trapped into isolated gel-glass pores, but it is possible to induce larger cavities in the gel-gel-glass. These gel-gel-glass dispersed liquid crystals may provide a lamellar structure and alignment of nematic compounds at the surface (Levy et al., 1997).
The length of the molecular chain and the rigidity and flexibility of molecules influence the structure of the polymer network in the polymer dispersed liquid crystal films, thus affecting the electro-optical properties of the composites accordingly.