Ferrous Xylenol Gel Measurements for 6 and 10 MV Photons in Small Field Sizes
Lucas N. de Oliveiraa, Carmen S. Guzm´an Calcinaa,b, Marco A. Paradaa, Carlos E. de Almeidab, and Adelaide de Almeidaa aDepartamento de F´ısica e Matem´atica, Faculdade de Filosofia,
Ciˆencias e Letras de Ribeir˜ao Preto, Universidade de S˜ao Paulo, Av. Bandeirantes 3900, Monte Alegre, 14015-400, Ribeir ˜ao Preto, SP, Brazil
bLaborat´orio de Ciˆencias Radiol´ogicas, Universidade do Estado de Rio de Janeiro,
Rua S˜ao Francisco Xavier, 524, Rio de Janeiro, RJ, Brazil
Received on 13 June, 2007
The Fricke dosimeter is a ferrous sulfate aqueous solution that, when irradiated, oxidizes the Fe2+ions to Fe3+. This new concentration, generally determined through spectrophotometry, is directly proportional to the ionizing radiation absorbed energy. The Fricke Xylenol Gel dosimeter (FXG) was developed through the incorporation of swine skin gelatin and xylenol orange. These modifications provided better signal stability and sensitivity for lower absorbed dose measurements, such as those used in radiotherapy. In this work FXG samples were irradiated with absorbed doses of 2 Gy, from 6 MV and 10 MV photons, using small field sizes geometry for dosimetric parameters determination. All the FXG dosimeter readings were accomplished with our specially developed spectrophotometer, using a narrow light beam at the wavelength of 585 nm, where the highest absorbance sensitivity occurs. From our results, we can confirm not only that the FXG dosimetric system (FXG plus a high lateral spatial resolution spectrophotometer) can be used for general dosimetry, but as well for small field size dosimetry of interest in radiosurgery.
Keywords: Fricke Xylenol Gel dosimeter; Physical parameters; Linear accelerator
I. INTRODUCTION
Radiotherapy uses ionizing radiation to eliminate or neu-tralize cancer cells. It is important to previously determine the absorbed dose distribution in the target volume and in ad-jacent tissues to guarantee the prescribed treatment. For the treatment planning, the dosimetric parameters dependent on the beam energy, target composition and irradiation geome-try are necessary to calculate how the absorbed dose will be distributed in the patient target volume (tumor). The para-meters percentage depth dose, beam profile and output factor, once obtained, are used in the service routine for patient ab-sorbed dose calculations. In this way, they have to be con-firmed routinely by medical physicists for treatment Quality Assurance. The selected dosimetric system must be accu-rate, reproducible and linear with the absorbed dose. In the Fricke Xylenol Gel (FXG) chemical system the Fe3+- Xylenol complex concentration, measured spectrophotometrically, is directly proportional to the absorbed dose [1-4]. The FXG dosimeter characteristics make it suitable for radiotherapy as: broad linear dependence on the absorbed dose up to 30 Gy for60Co radiation [5,6], effective atomic number of 7.75 and density of 1.05 g/cm3 near to 7.64 and 1.04 g/cm3, respec-tively, for soft tissue. The first chemical dosimeter, prepared by Fricke in 1921 (ferrous sulfate, sulphuric acid and wa-ter), has been improved adding or substituting the originals components. The FXG is prepared by the addition of swine skin gelatin and xylenol orange to the original Fricke solu-tion. These dosimeters provide spatial resolution comparable to those of the film dosimeters and natural oxidation lower than that, from the original Fricke solution [5]. In this work, the FXG dosimeter was used to determine output factors, per-centage depth dose curves (PDD) and field profiles for 6 MV and 10 MV photons. The FXG results were compared with those determined with X-OMAT V film and 0.1 cm3and 0.125
cm3ionization chambers (IC). From the comparison of these data sets, obtained with our FXG dosimetric system with those from ion chambers and film, we show that our FXG system is an adequate, and in some important aspects, a superior dosi-metric system for small field size measurements in radiother-apy.
II. MATERIALS AND METHODS
1. General Description
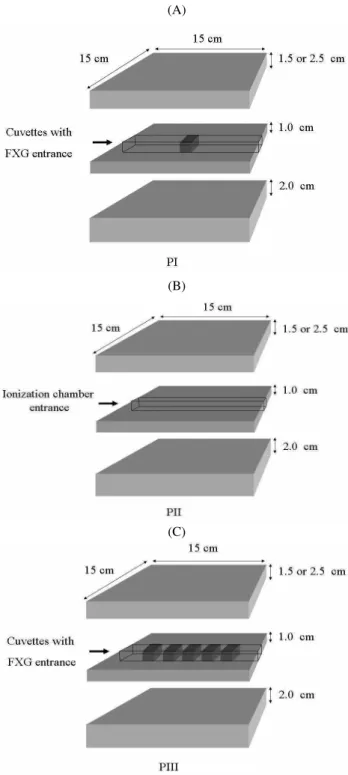
The small field size relative basic data sets were obtained with photons from a linear accelerator (Varian/ Clinac 2100) for photon energies of 6 MV and 10 MV. The FXG was con-tained in 1.0 x 1.0 x 3.0 cm3acrylic cuvettes (three for each measured value) inserted in the phantoms PI and PIII shown in Fig. 1 and the ionization chamber, was inserted in the phantom PII. Fig. 1 presents the acrylic phantoms in sandwich config-urations of 15 x 15 cm2PMMA plates, with 2 cm below and 1.5 cm or 2.5 cm above, with a PMMA plate for dosimeter insertion. The dosimeters were irradiated at a source surface distance (SSD) of 100 cm for square field sizes, defined by the Linac collimator. Absorbed doses of 1 Gy were used for output factors and field profiles measurements and of 2 Gy for PDD measurements.
2. FXG Dosimeter
(A)
(B)
(C)
FIG. 1: Acrylic phantoms for the percentage depth dose, calibration curve, output factor and profile measurements. a) PI with plate for cuvette insertion, b) PII with plate for IC insertion and c) PIII for cuvettes insertion.
and 1 cm of length through the dosimeter, optical path, with a portable spectrometer (Vary-Varian/Ultropec 2100/79500) at 585 nm.
3. Calibration Curve
The FXG dosimeter calibration curve was obtained, using a 60Co source (Siemens/Theratron 780C) and a 0.125 cm3 ionization chamber, connected to a (PTW-Freiburg/M31010) electrometer both from the secondary standards laboratory (Laborat´orio de Ciˆencias Radiol´ogicas-UERJ). The FXG dosimeters were placed in phantom PI shown in Fig. 1 at a SSD of 80 cm, 10 x 10 cm2field size with a build-up thick-ness of 0.5 cm PMMA. Five nominal absorbed dose values were selected in the interval from 0.5 Gy to 6.0 Gy. For each selected dose, three FXG dosimeters were irradiated and their optical transmission values averaged. The relative absorbance was calculated from the logarithm of the ratio of transmission values of each FXG dosimeter, before and after irradiation and the reproducibility was less than 2.5 %.
4. Output Factor
The output factor measurements [7] were obtained in the PMMA phantoms with FXG detectors and with the 0.125 cm3 IC for an absorbed dose of 1 Gy, SSD of 100 cm, a 1.5 cm build-up plate for 6 MV photons and a 2.5 cm build-up plate for 10 MV photons. Single FXG dosimeters were inserted in the phantom PI and centered in the square field sizes of 1 x 1 cm2; 2 x 2 cm2; 2.5 x 2.5 cm2; 4 x 4 cm2; 5 x 5 cm2; 7 x 7 cm2; 8 x 8 cm2and 10 x 10 cm2. Three of such FXG dosimeters were irradiated in the same conditions and their absorbed dose values averaged, for each field size and photon energy. The irradiation conditions with the ionization chamber were the same cited, but with the chamber positioned in the center of the phantom PII.
The relative output factor is expressed as the ratio of the absorbed dose at the center of a selected field size to that at the center of a larger reference field size (10 x 10 cm2), both measured at the maximum dose depth in the same medium.
R= D(r)
D(10) (1)
where: D(r) and D(10) are respectively the dosimeter re-sponse for the selected field size and the reference field size.
5. Percentage Depth Dose
An absorbed dose at a depthdcan be derived from the beam geometrical parameters, such as distance from the source and field size, as well the attenuation in the media. The depth dose can be represented through the following expression [8]:
Dd=Dm·
µ
SSD+dm SSD+d
¶2
·B·e−µd (2)
distance,dmis the build-up depth, d is a selected depth at the beam central axis (d>dm),Bis the scatter factor ande−µd is the attenuation factor related to the material media and depth selected.
The PDD were obtained for three square field sizes (1 x 1 cm2; 3 x 3 cm2 and 5 x 5 cm2)using PI and PII phan-toms, respectively for FXG and 0.125 cm3IC dosimeters. The dosimeters when positioned in build-up depth, were exposed to an absorbed dose of 2 Gy from 6 MV and 10 MV photons at a SSD of 100 cm. The dosimeters were irradiated at several depths by adding acrylic plates. For each depth, three FXG and IC exposures were performed. The PDD was obtained from the measurements, following the relation:
PDD=Dd
Dm
.100 (3)
The PDD measurements in acrylic were converted [9] for those in water through the Eq.(4) and were compared with the measurements from literature [10,11].
da=dw(µ¯)wa (4) where: dw andda are the equivalent depths, respectively in water and acrylic and(µ¯)wa is the mean linear absorption coef-ficient ratio (water/acrylic).
6. Field Profile
The field profiles were determined at 1.5 cm and 2.5 cm, the maximum dose depths, respectively for 6 MV and 10 MV photons, SSD of 100 cm for an absorbed dose of 2 Gy for 3 x 3 cm2and 5 x 5 cm2field sizes, using the FXG and film dosimeters. For the FXG profile irradiations, the phantom PIII was used and the FXG cuvettes were inserted in amounts of 9 and 11, to provide the expected field size lengths for the measurements. Three FXG dosimeters were used for each profile point, whose readings were averaged and normalized for the maximum absorbed dose value (in the center of the field). The same conditions were used for the film irradia-tions, but the films were inserted between the acrylic slices and irradiated with doses of 0.7 Gy for 6 MV and 10 MV photons. After development, they were read with a densito-meter (PTW-Freiburg/DensinXauto/79115) and the FXG and film data were normalized to their central values, obtained for each field size and energy.
III. RESULTS AND DISCUSSION
7. Calibration Curve
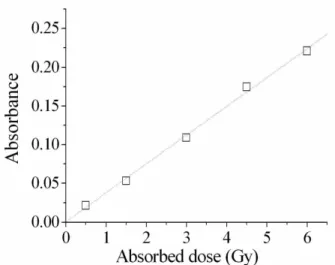
In Fig. 2 the FXG relative optical absorbance versus ab-sorbed dose is shown in the interval of 0.5 Gy – 6.0 Gy. This absorbed dose calibration curve is linear with a differential ab-sorbance sensitivity of 0.037 Gy−1. The linear interval tested
is consistent with the results cited in the literature [5,6,12,13] and is adequate for radiotherapy purposes. The basic data set that follows is relative to each dosimeter response at a given position and depth, and did not use the calibration curves.
FIG. 2: FXG calibration curve (absorbanceversusabsorbed dose) for60Co energy photons, 10 x 10 cm2, 80 cm SSD at the build-up depth (R2=0.996 and first standard deviation = 0.2 %)
8. Output Factor
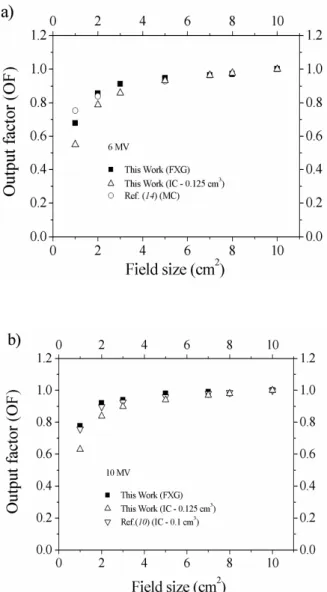
The output factors measured with our FXG dosimeter ap-pear in Fig.3 for 6 MV and 10 MV photons compared with ionization chamber measurements and with a Monte Carlo simulation.
The FXG dosimeter gives readings for small field sizes that are consistently higher than our 0.125 cm3IC readings. The discrepancies between the FXG output factors and those from the ionization chamber for field sizes lower that 5 x 5 cm2, cor-relate with the superior lateral spatial resolution of the FXG dosimeter.
Fig. 3a and 3b show that the Monte Carlo simulation and the measurements made with the small ionization chambers do not significantly disagree with our FXG measurements. According to IAEA protocol [7], the dimensions of the detec-tor should be less than 1/3 of the field size dimension. Large ionization chamber shows larger discrepancies, when measur-ing small fields.
9. Percentage Depth Dose
FIG. 3: Output factorversussquare field size for 6 and 10 MV pho-tons at 100 cm SSD and build-up depth. a) for 6 MV (¤), (△)and (O) are respectively for FXG, 0.125 cm3IC and MC (14)(first stan-dard deviation for FXG and 0.125 cm3IC = 0.7 %) and b) for 10 MV (¤), (△)and (▽)are respectively for FXG, 0.125 and 0.1 cm3
IC (10) (first standard deviation for FXG = 2 % and 0.125 cm3IC = 0.5 %).
Eq. 3), in order that the values could be better visualized. All results (6 MV and 10 MV sets) are displaced in accordance with the appropriate output factors, shown in Fig. 3, for the same reason.
In the two set of plots shown, one can see that the FXG dosimeter has enough resolution to show where the build-up depth occurs. Also, that all PDD values, obtained with the FXG, are more near to the values belonging to the smallest IC, than for 0.125 cm3. One can also see that the difference between the dosimeters results increases when the field size diminishes. The PDD maximum difference between the FXG and the 0.1 cm3IC [10] are 4.2 %, 3.8 % and 2.9 % for 1 x 1 cm2, 3 x 3 cm2and 5 x 5 cm2, respectively. These results
can be explained through the followings facts: a) for smaller field sizes the lateral electronic equilibrium does not exist [14-19], if the detector dimensions are less than 1/3 of the field size dimension; b) the dosimeter can lose resolution due to the dose gradient [17,20,21] and c) the photons energy spectra can be different of those used in standard laboratory for the IC calibration [15,17,22].
FIG. 4: PDDversusdepth in water (cm) for several square fields sizes (1 x 1, 3 x 3 and 5 x 5 cm2)at 6 and 10 MV photons, 100
cm SSD (average first standard deviation for FXG = 2.98 % and for 0.125 cm3IC = 0.65 %).
10. Field Profile
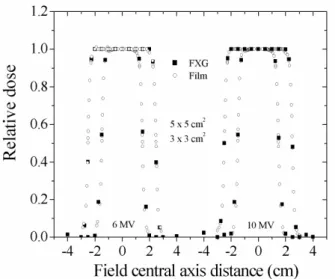
The FXG and film profile behaviors for 6 MV and 10 MV are presented in Fig. 5. In the high gradient regions, the FXG values are near to those of film, once it also has an adequate spatial resolution for 3 x 3 cm2and 5 x 5 cm2field sizes.
According to anterior protocols [23-25] the field profile evaluations can be done considering three parameters: homo-geneity, symmetry and penumbra.
The accepted tolerance for homogeneity is≤2 % of the difference between the lowest and the highest values. In our measurements a difference of the 1.00 % was inferred for the 3 x 3 cm2and 5 x 5 cm2, respectively for 6 MV and 10 MV.
The accepted tolerance for symmetry is≤2 % of the dif-ference between the left and the right values in 80 % of the size, related to value at the central axis. In our measurements a difference of 1.90 % was inferred for the 3 x 3 cm2and 5 x 5 cm2, respectively for 6 MV and 10 MV.
FIG. 5: Field size profiles from FXG (¤) and X-OMAT film (O) dosimeters with 100 cm SSD, 6 and 10 MV photons at their build-up depth. a) for 3 x 3 cm2and b) for 5 x 5 cm2(average first standard
deviation for FXG = 2 % for both fields sizes).
positions of the FXG and film obtained for 3 x 3 cm2and 5 x 5 cm2field sizes and for 6 and 10 MV photons.
The RW50 is the radiological width, expressed the differ-ence between the calculated and measured dose distribution at 50 % of the field gradient profile. In this study was observed a maximum deviation of 0.32 mm between the two RW50(for FXG and film). This discrepancy obtained for 3 x 3 cm2and 5 x 5 cm2field sizes and 6 MV and 10 MV, is within of the established tolerance (<2mm).
The beam fringe,δ50−90%, expresses the distance between points at the 50 % and the 90 % of the field gradient profile. In this study was observed a maximum deviation of the 2.00 mm between the two spatial positions of the FXG and film dosimeters. This discrepancy obtained for 3 x 3 cm2and 5 x 5 cm2field sizes and 6 MV and 10 MV, is near to the established tolerance (<2mm).
IV. CONCLUSION
The FXG, due to its atomic effective number and density near to those of the soft tissue, is expected to be an adequate dosimeter for radiotherapy, what can be confirmed through the dosimetric parameters of percentage depth dose, output factor and field profile. In this work, these parameters were obtained with the FXG and compared to the ionization chamber, film and Monte Carlo results.
In the small field sizes measurements, the FXG percentage depth dose and output factor results besides showing not sig-nificant differences with the others dosimeters and calculation method, permit one to infer respectively where the bild-up depth occurs and results more comparable to those from the smallest IC.
The FXG field profile results obtained, related to its homo-geneity, symmetry and penumbra shown differences of 1.00 %, 1.90 % and 0.92 mm, respectively lower than accepted protocol tolerances (≤2 %), for the two first ones and≤2 mm for the last one.
Considering the dosimetric parameters results obtained, one can consider the FXG as an adequate dosimeter for radio-therapy, not only for conventional field sizes measurements, but also for radiosurgerical ones. In this way, we can con-clude that this dosimeter can be used for general radiotherapy and radiosurgery control, through the dosimetric parameters measurements.
Acknowledgments
The present work was supported by grants from IAEA and CAPES (Brazil). The authors thank the Centro de Combate ao Cˆancer (CUCC-UERJ), the medical physicist Afranio Acker-man and technician Jos´e Luiz Aziani (DFM-FFCLRP-USP) for support.
[1] G. Gambarini, C. Birattari, M. Mariani, R. Marchesini, L. Pirola, P. Prestini, M. Sella, and S. Tomatis, Nucl. Instr. and Meth. in Phys. Res. B.213, 321 (2003).
[2] N. V. Klassen, K. R. Shortt, J. Seuntjens, and C. K. Ross, Phys. Med. Biol.44, 1609 (1999).
[3] W. I. D. Rae, C. A. Willemse, M. G. Lotter, J. S. Engelbrecht, and J. C. Swarts, Med. Phys. 23, 15 (1996).
[4] R. G. Kelly, K. J. Jordan, and J. J. Battista, Med. Phys.25, 1741 (1998).
[5] M. A. Bero, W. B. Gilboy, P. M. Glover, and J. L. Keddie, Nucl. Instr. and Meth. In Phys. Res. B.166, 820 (1999).
[6] R. T. Costa, Avaliando a viabilidade do uso do dos´ımetro Fricke modificado na radioterapia. [Master Thesis - Universidade de S˜ao Paulo, FFCLRP/DFM]. (2001).
[7] IAEA (Internacional Atomic Energy Agency) Absorved Dose Determination in External Beam Radiotherapy, Technical Re-ports series No.398, (2000).
[8] F. M. Khan, The Physics of Radiation Therapy, Williams & Wilkins, Baltimore (1997).
[9] AAPM A protocol for the determination of absorbed dose from high-energy photon and electron beams, Task Group 21, Med. Phys. 10, 741 (1983).
[10] P. V. Houdek, J. M. VanBuren, J. V. Fayos, Med. Phys. 10, 333 (1983).
[11] D. O. Findley, B. W. Forell, and P. S. Wong, Med. Phys. 14, 270 (1987).
[12] D. S. Felipe, Desenvolvimento, teste e aplicac¸˜ao de prot´otipo para dosimetria da soluc¸˜ao Fricke modificada. [Master Thesis -Universidade de S˜ao Paulo, FFCLRP/DFM] (2003).
[13] A. M. Caldeira Filho, An´alise da soluc¸˜ao Fricke modificada e irradiada atrav´es da espectroscopia fotoac´ustica. [Master Thesis - Universidade de S˜ao Paulo, FFCLRP/DFM] (2004).
[15] P. S. Nizin, Med. Phys.26, 1893 (1993).
[16] A. Wu, R. D. Zwicker, A. M. Kalend, and Z. Zheng, Med. Phys.
20, 777 (1993).
[17] M. Heydarian, P. W. Hoban, and A. H. Beddoe, Phys. Med. Biol.41, 93 (1996).
[18] I. A. Brezovich, P. N. Pareek, W. E. Plott, and R. L. S. Jennelle, Int. J. Radiation Oncology Biol. Phys.38, 883 (1997). [19] D. M. Duggan, C. W. Coffey, Med. Dosim.22, 127 (1997). [20] Y. W. Vahc, W. K. Chung, K. R. Park, J. Y. Lee, Y. H. Lee, O.
Kwon, and S. Kim, Med. Phys. 28, 303 (2001).
[21] A. Mack, S. G. Scheib, J. Major, S. Gianolini, G. Pazmandi, H. Feist, H. Czempiel, and H. J. Kreiner, Med. Phys.29, 2080 (2002).
[22] L. N´u˜nez, F. S´anches-Doblado,Small field dosimetry in
radio-surgery. Dynard, E.U. (1999).
[23] IAEA (Internacional Atomic Energy Agency), Commissioning and Quality Assurance of Computerized Planning Systems for Radiation Treatment of Cancer, Technical Reports series No.
430(2004).
[24] G. J. Kutcher, L. Coia, M. Gillin, W. F. Hanson, S. Leibel, R. J. Morton, J. R. Palta, J. A. Purdy, L. E. Reisntein, G. K. Svens-son, M. Weller, and L. Wingfield, Med. Phys.21, 581 (1994). [25] International Commission on Radiation Units and