Measurement of the Damping of Liquid Surface Wave by Diffraction Method
Jun Dong
Department of Electronics and Information Engineering,
Xi’an Institute of Posts and Telecommunications, Xi’an 710121, People’s Republic of China
Jianxia Qi
Department of Applied Mathematics & Applied Physics,
Xi’an Institute of Posts and Telecommunications, Xi’an 710121, People’s Republic of China
Runcai Miao
Institute of Physics and Information Technology, Shaanxi Normal University, Xi’an 710062, People’s Republic of China
Received on 12 April, 2007
A simple method for measuring the damping of the liquid surface wave (LSW) based on the diffraction method was proposed in this paper. In the experiment, the phenomenon was observed that the intensity dis-tribution of the diffraction patterns from the LSW varies with the position of the incident spot. By theoretical analysis of the relationship between the intensity distribution and the LSW amplitude, the damping constant was obtained. In addition, the viscosity of the liquid can be calculated with this method, too.
Keywords: Diffraction; Liquid surface wave; Damping constant
I. INTRODUCTION
In recent years, the study of liquid surfaces has attracted great interest both in labs and in industries [1-4]. Many tech-niques have been applied to investigate the characteristics of the liquid surface wave (LSW), which provide us a large amount of information about the liquid. Among these tech-niques, most are used to study the surface tension, the rela-tion of dispersion, the phase velocity of LSW and so on [5-8]. Besides, there are also a few researches focusing on the liquid surface wave damping [9,10]. For instance the laser-scanning slope technique is applied to study the LSW at a low frequency (a few hertz), because the LSW wavelength is much greater than the scanning laser diameter in the case [11-14]. The imaging analyzer is used to study LSW at a few tens hertz, and the image is formed by the light transmitted through the dyed liquid medium [15,16]. The Capacitive An-tenna method [17,18] is used to measure surface wave ampli-tude simultaneously at two radii from the wave drive point, but the needed equipments are complicated. Besides, the surface light scattering method is very effective to study the LSW [19-24]. However, the usefulness of light scattering is limited be-cause it is most suitable for studying LSW with wavelength in the sub micrometer range. In addition, the corresponding data from light scattering is greatly affected by the reduction of surface tension at the short wavelengths associated with ther-mally excited waves. Apart from the limitation of the tech-nique, the equipment for the surface light scattering method is also complex and expensive [25-28].
However, there are few experiments performed to study the transparent liquid surface wave damping at a few hundreds hertz [29,30]. In our former investigation [31], the diffrac-tion method was used to study the low-frequency liquid sur-face waves, and the disappearance of the zero-order diffrac-tion fringe was experimentally observed, which corresponds to 100% diffraction efficiency.
In this letter, not only the stationary diffraction patterns were obtained, but also the phenomenon that the intensity distribution of the diffraction patterns varies with the shift of the incident spot was observed experimentally. By theo-retical analyzing the influence of the amplitude of LSW on the intensity distribution of the diffraction patterns, the rela-tionship between the amplitude of LSW and the distance be-tween the exciter and the spot could be obtained. So based on the analysis of the intensity distribution resulting from LSW at different positions, a simple technique for measuring the damping constant of liquid surface wave at several hundreds hertz was proposed. Compared with the techniques aforemen-tioned, the diffraction method presented in this letter can be applied whether the liquid is transparent or not, because the transmission light can only carry the information of LSW in the dyed liquid, whereas the diffraction light does not has this limitation. In addition, the latter technique can be easily im-plemented and the experimental results can be well repeated.
II. EXPERIMENT SETUP AND DESCRIPTION
Ca m
era
computer
Signal
generator
Water
E
laser
Fpower monitor
beam splite r
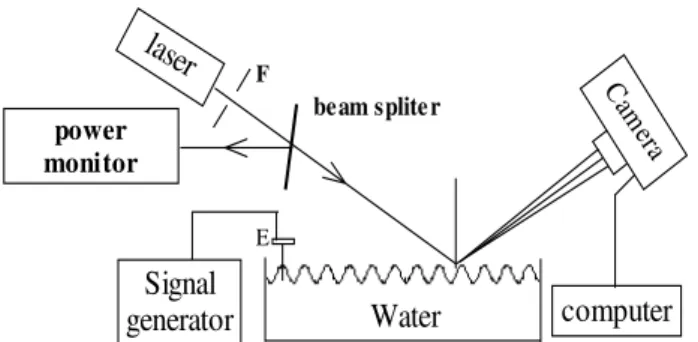
FIG. 1: Schematic diagram of experimental setup E: exciter, M: mir-ror, P: polarizer, F: filter.
(a) (b) (c) (d) (e) (f)
FIG. 2: Diffraction patterns from the LSW at 230HZ on a water-air surface with different distance between the exciter and the light spot (a) 5.0cm, (b) 5.5cm, (c) 6.0cm, (d) 6.5cm, (e) 7.0cm, (f) 7.5cm.
In our experiment, at some fixed frequency, we change the distance between the incident spot and the exciter by mov-ing the exciter, and then obtain the diffraction patterns. And Fig. 2 is obtained at a frequency of 230 Hz. When the dis-tance is about 5.0 cm, we get the diffraction pattern shown in Fig. 2(a). Then, with the shift of the exciter, we get the diffraction patterns at different positions, which are shown in Fig. 2 (b), (c), (d), (e), (f), and the distance is about 5.5cm,
approximated as a traveling sinusoidal disturbance [33], as shown in Fig. 3.
Λ
h θ
liquid
Incident beam
screen
FIG. 3: The LSW geometry.
With careful inspection of Fig. 3, one may readily deter-mine that the phase modulation impressed upon a laser beam upon reflection from the liquid surface can be written as [34]
φ(x) =2π
λ [(2hcosθ)sin(Ωt−kx)] (1) whereh is the LSW amplitude, θis the angle of incidence, λis the free-space wavelength of the illumination beam,Ωis the LSW frequency,xis a one-dimensioned position variable along the surface, k is the one-dimensioned acoustic-wave vector, andk=2π
Λ, whereΛis the LSW wavelength. Note
that the factor of 2 in the square bracketed term of Eq. 1 arises because the phase modulation is doubled upon reflection. In our experiment,θ=1.38rad,λ=473.0nm
In the experiment, the illuminated region is so small that the amplitudehcan be approximately assumed as a constant over the region of interest. The light field strength in the region of Fraunhofer diffraction is simply the Fourier transform of the object function, that is, in the case of oblique incidence, given by
exp ½
j2π
λ [2hcosθsin(Ωt−~K·~r/cosθ)] ¾
, (2)
x
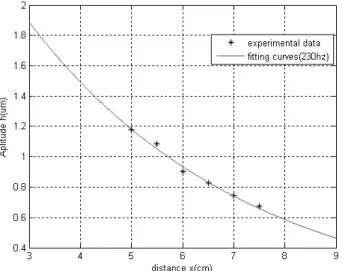
FIG. 4: The LSW amplitudehVS the distancexat 230Hz.I(x′) =
∑
n
Jn2(4πhcosθ/λ)δ(x′ λz−
n
Λcosθ) , (3)
whereJnis Bessel’s function of the first kind, ordern,δ
rep-resents the delta function, x′ is the position variable on the observation plane, andzis the observation distance from the liquid surface to the observation plane.
It can be seen from Eq.(3) that the introduction of LSW has deflected energy out of the zero-order component into a multitude of higher orders. The displacement of then th or-der from the center of the diffraction pattern is Λncosλzθ, while the peak intensity of thenth order is simply determined by Jn2(4πhcosθ
λ ), which is a function of LSW amplitude h. It is
known from Eq.(3) that the peak intensity will change with the LSW amplitudehfor the same order diffraction pattern. Thus, we can determine the LSW amplitude by studying the intensity of the diffraction patterns. With the comparison of the ratio of the intensity for any two or three orders in the-ory and in experiment, we can determine the LSW amplitude at a fixed position. Then the distance is changed by moving the exciter, and the amplitudes of LSW at different position are obtained with the same method. Therefore, based on the analysis of the intensity distribution of diffraction patterns, the damping of LSW can be studied.
IV. RESULTS AND DISCUSSION
With the diffraction method, the amplitudes of LSW at 230Hz in Fig. 2 are calculated. Fig. 4 shows the relationship of the amplitudeh and the distancex. In Fig. 4, the discrete dots are the experimental data. The solid curve represents the best fit obtained using the least fits method to the experimen-tal data. One may get the conclusion from Fig. 4 as follows, the amplitude h changes with the distancex, and whenxis
FIG. 5: The logarithm of the amplitude VS the distance at 230HZ.
smaller, i.e., the light spot is closer to the exciter, the ampli-tude is larger. With the increase of the distance, the ampliampli-tude of LSW decreases in the approximately exponential manner along the direction of the wave propagation. The relationship between the amplitudeh and the traveling distancexcan be written as
h=h0exp(−αx), (4) Whereh0is the amplitude of the acoustic source, andαis the damping constant. For the simplicity of calculation, the Eq.(4) can be rewritten as
lnh=lnh0−αx, (5)
the relationship between the lnhand the distancexis shown in Fig. 5. The fitted line is a straight line. The slope yields the spatial damping coefficientα=23.0m−1.
It should be noted that the surface wave attenuation depends upon the wave frequency. The spatial damping constant of the surface waveαis approximately given by the hydrodynamics theory as [36]
α=8 3
πνρf
σ , (6)
whereσis the surface tension,ρis the density of the sample liquid, andνthe kinetic viscosity, f is the LSW frequency. Here, the amplitude is assumed to be much smaller than the wavelength. For pure water at 25◦C,ν=0.897×10⁻⁶m2/s, ρ=997.1kg/m3, σ=7.26
×10−2N/m, and f =230Hz, it is calculated thatα=23.7m−1. Comparing the experimental results with the theoretical data, they are in good agreement.
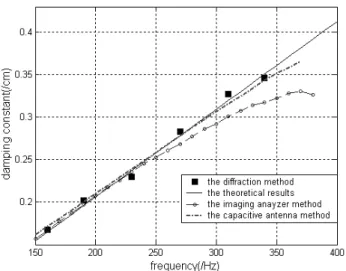
FIG. 6: The discrete dots¥are experimental data obtained by dif-fraction method and the solid black line shows the theoretical predic-tion of Eq. 6.
the damping constant is increasing with the frequency. Then, we give a comparison between the diffraction method and two other methods, i.e., the imaging analyzer method and the ca-pacitive antenna method. In Fig. 6, it can be seen that at the low frequency, all of them could obtain nearly the same re-sults as the theoretical prediction. However, at the higher fre-quency, the results of the imaging analyzer method become inaccurate, whereas, the diffraction method and the capacitive antenna method can still get the accurate results. Besides, it should be noticed that the apparatus of the capacitive antenna method is more complicated and expensive.
distribution, the relationship between the amplitude of LSW and the distance was studied. So a simple method for measur-ing the dampmeasur-ing constant of liquid surface wave is developed, which is based on the analysis of the intensity distribution of diffraction patterns. Besides, according to the Eq. (6), the vis-cosity of the liquid can also be obtained with this method. It should be noted that the output intensity of the laser beam should be kept steady strictly; otherwise, the inaccurate ex-perimental results may be produced in the experiment. So in our experiment, the laser beam is divided into two sub-beams with a beam splitter. One is used to monitor the laser output stability, and the other is directly incident upon the LSW.
Acknowledgements
This study was supported by Xi’an Institute of Posts and Telecommunications under Grant No. 101-0424.
[1] B. M. Ocko, X. Z. Wu, E. B. Sirota, S. K. Sinha, and M. Deutsch, Phys. Rev. Lett.72, 242 (1994).
[2] D. M. Mitrinovic, Z. Zhang, S. M. Williams, Z. Huang, and M. Schlossman, J. Phys. Chem. B103(11), 1779 (1999). [3] K. Sakai, H. Kikuchi, and K. Takagi, Rev. Sci. Instrum.63(11),
1192 (1991).
[4] J. Penfold and R. K. Thomas, J. Phys.: Condens. Matter2, 1369 (1990).
[5] L. T. Lee, D. Langevin, and B. Farnoux, Phys. Rev. Lett.67, 2678 (1991).
[6] G. Weisbuch, F. Garbay, Am. J. Phys.47, 355 (1979).
[7] S. Hard, Y. Hamnerius, and O. Nilsson, J. Appl. Phys.47(6), 2433 (1976).
[8] J. C. Earnshaw, R. C. McGivern, J. Phys. D: Appl. Phys.20, 82 (1987).
[9] Ka Yee Lee, Tom Chou, Doo Soo Chung et al., J. Phys. Chem.
97(49), 12876 (1993).
[10] M. van den Tempel, R. P. van de Riet, J. Chem. Phys.42(8), 2796 (1965).
[11] J. D. Barter, K. L. Beach, and P. H. Y. Lee, Rev. Sci. Instrum.
64(9), 2661 (1993).
[12] Q. X. Li, M. Zhao, S. Tang, S. C. Sun, and J. Wu, Appl. Opt.
32(24), 4590 (1993).
[13] J. Chang, R. Wagner, and H. Yuen, J. Fluid Mech.86, 401 (1978).
[14] P. H. Y. Lee, J. D. Barter, K. L. Beach, et al., SPIE Proc.1749, 234 (1992).
[15] J. D. Barter, P. H. Y. Lee, Appl. Phys. Lett.64(15), 1896 (1994). [16] J. D. Barter, P. H. Y. Lee. Appl. Opt.36(12), 2630 (1997). [17] J. D. Barter, Rev. Sci. Instrum.64, 556 (1993).
[18] J. D. Barter, Phys. Fluids6(8), 2606 (1994).
[19] R. H. Katyl and U. Ingard, Phys. Rev. Lett.19, 64 (1967). [20] J. S. Huang and W. W. Webb, Phys. Rev. Lett.23, 160 (1969). [21] K. Y. Lee, T. Chou, D. S. Chung, and E. Mazur, J. Phys. Chem.
97, 12876 (1993).
[22] C. Martel and E. Knobloch, Phys. Rev. E56, 5544 (1997). [23] P. Cicuta and I. Hopkinson, Phys. Rev. E65, 041404 (2002). [24] P. Cicuta and I. Hopkinson, Colloids Surf. A233, 97 (2004). [25] S. Hard, Y. Hamnerius, and O. Nilsson, J. Appl. Phys.47, 2433
(1976).
[27] B. J. A. Bjorkvik, D. Waaler, and T. Sikkeland, Meas. Sci. Tech-nol.6, 1572 (1995).
[28] P. Tin, J. A. Mann, W. V. Meyer, and T. W. Taylor, Appl. Opt.
36, 7601 (1997).
[29] J. Dong, R. C. Miao, and J. X. Qi, J. Appl. Phys.100, 033108 (2006).
[30] R. C. Miao, X. F. Zhao, and J. Shi, Opt. Comm. 259, 592 (2006).
[31] R. C. Miao, Zongli Yang, and Jingtao Zhu, Appl. Phys. Lett.
80(17), 3033 (2002).
[32] J. Lighthill,Waves in fluids, Cambridge University Press, Cam-bridge, 1978, p.228
[33] D. A. Larson, R. D. Black, M. Green, and R. G. Torti, J. Opt. Soc. Am. A7, 1745 (1990).
[34] B. D. Duncan, Appl. Opt.39(17), 2888 (2000).
[35] J. W. Goodman,Introduction to Fourier Optics(McGraw-Hill, San Francisco,1968), p.62