Characterization of the Main Frequency Shifts for the Brazilian
133
Cs Atomic
Beam Frequency Standard
A. Bebeachibuli, M. S. Santos, D. V. Magalh˜aes, S. T. M¨uller, and V.S. Bagnato Instituto de F´ısica de S˜ao Carlos – USP
Caixa Postal 369, CEP 13560-970, S˜ao Carlos/SP, Brazil
Received on 8 August, 2005
In order to evaluate an atomic clock, it is important to determine the main frequency shifts caused by external fields, device imperfections, etc. Scanning the frequency of the main oscillator, the Ramsey fringe is obtained and used to determine the main shifts. The gravitational shift (10−17), second order Doppler (1.65×10⁻¹³), Black-Body radiation shift (2.9×10⁻¹⁴), quadratic Zeeman effect (5×10⁻¹³), Rabi Pulling (1.3×10⁻¹³) and
cavity pulling (1.3×10⁻¹³) have been evaluated. The short term stability, (6.6±0,2)×10−13,was obtained.
I. INTRODUCTION
An atomic frequency standard is a device that generates an output signal which derives from an inherent property of an atom, like its constant resonant frequency in time. This prop-erty confers on the output signal several characteristics such as high accuracy, great stability and reproducibility with time [1,2]. In this approach, the principle of operation of an atomic frequency standard is the frequency stabilization with respect to a local oscillator, operating in a frequency corresponding to an atomic transition between two well known energy lev-els. In 1967, the SI second was defined as ”the duration of 9 192 631 770 periods of the radiation corresponding to the transition between the two hyperfine levels of the ground state of the caesium 133 atom”. The reference atomic transi-tion is, in spectroscopy notatransi-tion, 6S1/2|F=3,mF=0i ←→ 6S1/2|F=4,mF=0i. This definition refers to a caesium atom at rest at a temperature of 0K. This transition can be accessed in the following way: the Cs atoms are prepared in the state F=3 and interact with two microwave fields spacially separated by a region free of oscillatory radiation. This is known as the method of successive oscillatory fields, named as Ramsey interrogation method [3]. In the optimum con-dition of power and frequency of the microwave field inside the interrogation cavity, the transition probability between the state|F=3,mF=0i ←→ |F=4,mF=0iis maximized. Fi-nally, the atomic transition rate as a function of frequency is measured. The resonance peak is observed aroundν0(1+ε), whereεcorresponds to the frequency shift due to many exter-nal perturbations.
The aim of this paper is the description and the character-ization of the atomic standard fully constructed in Brazil [4]. We report the major shifts present in our atomic frequency standard, like the Quadratic Zeeman, Cavity Pulling and Rabi Pulling. The performance of the standard can be summarized in a global uncertainty table and the determined short-term stability.
II. DESCRIPTION OF THE FREQUENCY STANDARD DEVICE
The Brazilian133Cs atomic beam frequency standard has been well described elsewhere [4]. The vaccum system is en-closed in a cylindrical chamber made of stainless steel; it is 60 cm long and its diameter is 20 cm. The background pressure in the chamber is lower than 10−5Pa and it is maintained with a turbo molecular pump. An effusive oven heated to about 343K produces the133Cs atomic beam axial to the system. An array of stainless steel and graphite disks collimates the beam to less than 2 x 10⁻⁴sr. The produced C-field is perpendicu-lar to the atomic beam and his magnitude is about 20µT. Be-fore getting into the microwave cavity, the atoms are optically prepared in the 62S
1/2(F = 3) ground level with a laser beam resonant with the transition 62S1/2(F = 4)→62P3/2(F’= 4).
After passing through both microwave zones, the fluorescence of the atoms that interact with a laser beam resonant with the transition 62S1/2(F = 4)→ 62P3/2(F’= 5) is detected. The optical pumping and the detection beams are produced by a single mode diode laser (SDL 5410C - 852nm), stabilized in an extended cavity configuration. The linewidth of the laser is estimated to be less than 500 kHz. The saturated absorption spectroscopy technique is used to lock the laser in the 62S1/2 (F = 4)→62P3/2(F’= 5) transition. The optical pumping beam is generated by an acousto-optical modulator operating at 251 MHz.
The microwave cavity has a conventional U shape. It is made of copper and the distance between the interrogation zones is 10 cm. The quality factor (Q) of the cavity is about 500. The microwave synthesizer was built by F. Walls and co-workers at NIST (Boulder - USA) and it generates the 9.192631770 GHz from three quartz oscillators at 5 MHz, 100 MHz and 10.7 MHz. The modulation of the 9.192 GHz signal is injected in the 10.7 MHz oscillator by an external DDS (Stanford DS 345). A LabVIEWT Mcomputer interface program implemented by our group performs the control of the standard. The evaluation of the Caesium beam frequency standard performance has been made by comparison with a commercial standard (Agilent 5071-A).
eval-uation [4]. The optimum microwave power was determined to increase the output signal of the atomic frequency standard, assuring that the atoms suffer aπ/2 pulse in each interrogation cavity. The static magnetic field inhomogeneity, generated by the C-field, has been minimized improving its current supply. A new temperature control for the oven was also imple-mented. To heat it, two heatbelt are used, one in the colimation region and other on the Cs resevoir. Doing so, the operation temperature of the oven and consequently the velocity distri-bution of the beam could be reduced. The oven temperature was adjusted so that the signal obtained with the standard is high enough, without being saturated, and the signal to noise ratio was preserved.
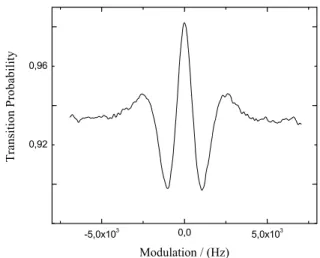
The Ramsey fringe, which is the characteristic signature of an atomic frequency standard, obtained in this new configura-tion is shown in Fig. 1, where a good symmetry and signal to noise ratio are observed.
FIG. 1: The clock transition, |3,0i ↔ |4,0i, measured with the Brazilian133Csatomic beam standard.
III. FREQUENCY SHIFTS
A. Gravitacional Frequency Shift
This shift is a relativistic correction due to the gravitational potential variation of the standard position at a given location. It is independent of the atomic velocity and just produces a translation at the Ramsey fringe. For standard on the Earth, or close to its surface, the effect of the gravitational potential is taken on the geoid surface [5]. The frequency of an atomic standard is shifted by an amount∆νG, when it is fixed in an altitudehabove the geoid by
∆νG ν0
=−g
c2h (1)
where g is the gravitational acceleration (according to the 3rd Conf´erence G´enerale des Poids et Mesures, CGPM, in
1901, its value is 980.655 cm/s2) and c is the light speed (299,792,498 km/s, defined in the 15thCGPM, in 1975). The S˜ao Carlos altitude where the atomic beam standard is located, ish= (850±50)m. This was measured with a GPS receiver (9390 - 6000 Datum). Following, the frequency shift due to the gravitational shift is∆νGν
0 =−1.0×10
−17.
B. Second-order Doppler shift
The second-order Doppler shift is related to the temporal dilatation predicted in special relativity. Each velocity com-ponent in the beam adds a shift given by
∆νG ν0
=−υ
2
2c2 (2)
wherecis the light speed andvis the atomic speed computed for a time of flightτ. We have used the method described in [6], which uses a mathematical procedure to extract from the Ramsey pattern some characteristic parameters without hav-ing to determine the time of flight distribution of the atoms. In the limit whereaτ∆≪1(ais the ratio betweenL,the lenght between the two interrogation zones of the microwave cavity, andl, the lenght of the interaction region), the correction in the resonance frequency is given by
νD=− ν0l2
2c2
R 1
τ2A(νm,b,τ)f(τ)dτ R
A(νm,b,τ)f(τ)dτ
(3)
In equation 3, the functionA(νm,b,τ)and f(τ)represent respectively the unperturbed transition probability, (function of the modulation amplitude,νm, the Rabi frequencybandτ) and the time of flight distribution given by the Maxwell speed distribution.
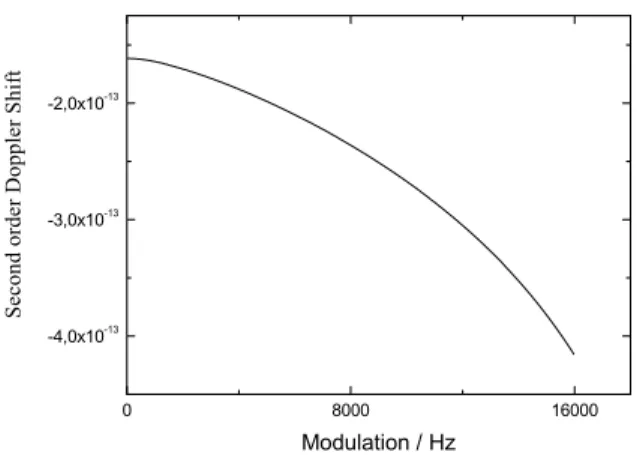
Figure 2 shows the dependence of the second-order Doppler shift as a function of the modulation amplitude on the mi-crowave signal for normal operation of the standard. For the given oven temperature(T =343K), the average atomic speed is(200±7)m/s. A typical modulation in the Ramsey fringe is 45 Hz, so that the resulted shift is νDν
0 =−1.65× 10⁻¹³.
C. Black Body radiation shift
FIG. 2: Dependence of the second-order Doppler shift as a function of the modulation amplitude for a temperature oven of 343 K and an average speed 200 m/s.
∆νT ν0
= −K”
µ
T 300
¶4" 1+ε
µ
T 300
¶2#
(4)
= −1.69×10⁻¹⁴ µ
T 300
¶4
(5)
where K” = 1.573(3)×10−14 Hz andε=1.4×10⁻²[9]. The operational temperature is measured with a calibrated ther-mistor and for the present reportT = (343±2)K, resulting in a black body radiation shift of ∆νTν
0 =−(2.887±0.04)× 10−14.
D. Quadratic Zeeman effect
In an atomic frequency standard, which is based on the tran-sition between two specific hyperfine sublevels, it becomes important to work with the presence of a dc magnetic field (C-field). This field lifts the degeneracy of the manyfold lev-els, and therefore the atomic transition line depends C-field amplitude.
We have minimized the field inhomogeneity and improved the C-field control. After these improvements, the second-order Zeeman shift was evaluated. For this, we have applied the method described by Makdissi et al [6], where a peri-odic measurement of the Zeeman frequency between a pair of transitions with the same absolute value of magnetic quan-tum number is performed. We have chosen the 62S
1/2(F = 3, mF= 1)→62S
1/2(F = 4,mF= 1) and 62S1/2(F = 3,mF= -1)
→62S
1/2(F = 4,mF= -1) transitions. The transition frequency between these two levels of the ground state with∆mF = 0 is given by:
νm=ν0 q
1+ (m/2)x+x2 (6)
wherex≈3.0496B0, B0is the magnitude of the C-field (20µT) andν0is the atomic resonant frequency in the absence of mag-netic field. The average value ofxis small for the usual values of B0so that it is possible to expand equation 6 in power series and the resonant frequency for the transitions in whichmF6=0 is given by:
νm=ν0[1+ (m/4)hxi+ (1/2)
¡
1−m2/16¢ x2® (7) wherehirepresents an average over the free of oscillating field region, of lenght L. In practice, we measurehxiinstead ofhB0i to avoid any uncertainty between the constant that relates the two variables. The value ofhxiis obtained from the resonant frequency ofν1andν−1, resulting in
hxi= (4/ν0) [(ν1−ν−1)/2] =4fz/ν0 (8) where the quantity fz is the Zeeman frequency. Because the field has almost constant amplitude B0along the atoms trajec-tory, we can make the approximationx2®=hxi2, so that we can express the second order Zeeman shift as:
νZ=8fz2/ν0 (9)
In our atomic frequency standard we havefz= 92 kHz and the second order Zeeman shift is about 7.3 Hz.
FIG. 3: Time variation of the quadratic Zeeman shift.
A periodic measurement of theν−1andν+1Zeeman fre-quency is necessary to observe its temporal dependence. We have measured it for ten days, five times per day, to study the way it changes in normal operating condition in the labo-ratory. Fig. 3 shows the obtained variations of the quadratic Zeeman shift. The uncertainty in the measure of the frequency transitions, ν−1 and ν+1, is imposed by the stability of the atomic beam standard. Using the equation 9 it is possible to write
δνZ ν0
=2ννZ 0
δfZ f0
resulting in an uncertainty of 1.5×10⁻¹⁴forδfZ=0.8 Hz. From Fig. 3, it is possible to see that the daily variation of
νZis of about 5×10⁻³Hz. Therefore, the relative uncertainty in the temporal measurement of the quadratic Zeeman shift is
∆ν/ν0=5.43×10−13.
E. Inhomogeneity of the magnetic field along the microwave cavity
The resonant line shape of a thermal beam is a superposi-tion of a narrow spectral feature (Ramsey fringe) on a broader resonance (Rabi pedestal). In ideal conditions, the Ramsey fringe is centered within the Rabi pedestal. If there is any in-homogeneity in the magnetic field along the atom trajectory through the microwave cavity, a frequency shift in the reso-nant line is observed and the Ramsey fringe is not anymore centered in the Rabi pedestal [7].
The centers of the Rabi line and of the Ramsey line have been measured for each of the neighbour transitions (∆mF=0) and for the clock transition. The difference between them was computed and it can be written as [7]:
D(m) =νRam(m)−νRabi(m) =ν0(m/8) (ε1+ε2) (11) whereε1andε2are fluctuations of the mean static field in the first and second interaction regions respectively. The slope in the linear curve ofD(m) as a function ofm determines the value(ε1+ε2).
The modulation of the 9.192 GHz signal, introduced in the 10.7 MHz oscillator of the microwave synthesizer, has been driven by a computer program that makes possible to choose the modulation amplitude and lock the system to the center of the Ramsey line or to the center of the Rabi line for each neighbour transition and for the clock transition. We have compared the output signal of the 5 MHz oscillator with the 5 MHz output signal from the commercial Cs standard. A computer program collects these oscillation data during fifty minutes per line. Fig. 4 shows the measured shifts for all
∆mF=0 transitions.
The estimated linear slope from the experimental curve D(m)×mF is (11.35±0.05) resulting in (ε1+ε2) =
−(0.99±0.05)×10−8. For the operating condition of the standard, the frequency error on the clock transition due to the field inhomogeneity isνZ=(1.08±0.04)×10−5Hz.
The other Zeeman transitions are also shifted by the same effect and it is necessary to count them. As the velocity dis-tribution is the same for all transitions, we have used the same procedure to study the effect of the magnetic inhomogeneity for themF6=0 transition. The Zeeman frequency is shifted by an amount fz =0.77µHzand this is equivalent to a residual error of ∆νZν
0 ≤8.3×10
−15.
Finally, the total uncertainty is computed considering the uncertainty measured due the experimental determination of the Zeeman frequency ∆νZν
0 =5.43×10
−13 and the correc-tion due the field inhomogeneity, ∆νZν
0 =0.08×10
−13. The quadratic sum of this terms results in∆νZν
0 =5.5×10
−13,with an uncertainty of 0.15×10⁻¹³.
FIG. 4: Frequency differenceD(m)between the center of the Ram-sey fringe and the Rabi pedestal as a function of the Zeeman sub-levels numbermF. The points deviate from the straight line because
of the Rabi Pulling effect. The applied C-field isB0=20µT.
F. Rabi Pulling
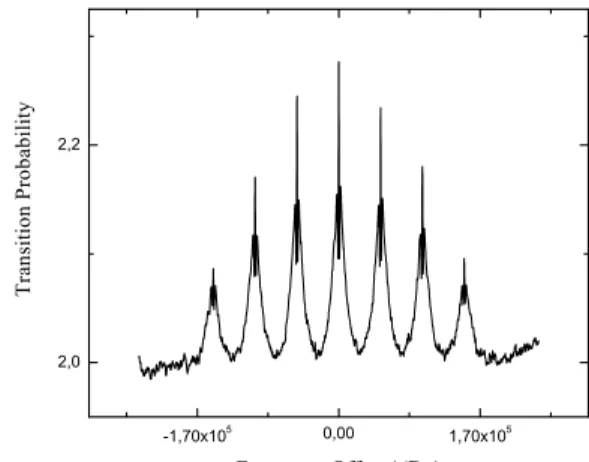
Besides the clock transition, there are other six transi-tions linearly dependent of the static magnetic field, ∆F =
±1,∆mF=0, as shown in Fig. 5.
FIG. 5: The Zeeman spectrum of the133Csatom obtained with the atomic beam frequency standard.
Their amplitudes are comparable to the clock transition and consequently they shift the defined frequency transition. The Rabi Pulling results from the overlapping wings of ad-jacent transitions in the Zeeman spectrum. The pedestals of the transitions (F=4,mF=1) ←→ (F=3,mF=1) and (F=4,mF=−1)←→ (F=3,mF=−1) overlap the pedestal of the clock transition (F=4,mF=0) ←→
line is not clear and a frequency shift is added to the detected atoms which are directly related to the transition.
The clock transition is shifted by the Rabi Pulling only if there is an asymmetry between the transitions mF =1 and mF=−1. From Fig. 5, we observe that there is an asymmetry of 1,3% in the peacks high of these transitions. If we assume that 1,3% is the worst asymmetry achieved with this value of C-field, it is possible to estimate the fractional Rabi Pulling as 4.4×10⁻¹¹. The corresponding pulling for the Ramsey fringe is smaller by a quantity of¡2lL¢,wherelis the interrogation cavity length, and its magnitude is 1.3×10⁻¹³. As observed, the Rabi pulling for the Rabi pedestal is larger than for the Ramsey fringe because the pedestal slope is smaller and the modulation amplitude is larger.
To determine the Rabi Pulling, a similar procedure to ob-tain the field inhomogeneity was used. The shift between the pedestal and its corresponding fringe for each transition was measured. The C-field has been adjusted for B0=20 µT andB0=30µT. The results are depicted in Figs. 4 and 6. It is possible to observe, for themF =±2 transitions, a shift between the Rabi pedestal and the Ramsey Fringe of about 33 Hz and 2.46 Hz forB0=20µT andB0=30µT, respectively. They correspond to a Rabi Pulling of about 1.67×10⁻¹¹ and 7.13×10⁻¹² for the Rabi pedestal when B0=20 µT andB0=30 µT. For the Ramsey fringes the pullings are 4.75×10⁻¹⁴and 2.07×10⁻¹⁴,on the same val-ues ofB0.
FIG. 6: Frequency differenceD(m)between the center of the Ram-sey fringe and the center of the Rabi pedestal as a function of the Zeeman sublevels numbermF, for a higher magnetic field compared
to Fig. 4. The applied C-field isB0=30µT. The points are much closer to the straight line because the Rabi Pulling is less important.
G. Cavity Pulling
The cavity pulling arises from the variation of the mi-crowave amplitude with the frequency when the cavity is mis-tunned. It is nearly independent of mF, but it has a strong
dependence on the microwave power and on the modulation amplitude. Consequently, the Cavity Pulling is larger for the Rabi pedestal than for the Ramsey fringe.
Our procedure to measure the cavity pulling has been simi-lar to that described by Shirley et al [8] and it is again the same used to measure the magnetic field inhomogeneity. Since the cavity pulling is nearly independent of mF and the Rabi pulling for the clock transition is small [8,10], the pedestal shift shown in Fig. 4 corresponds to the cavity pulling. The measured pedestal shift is(3.76±0.10)Hz for a measure-ment time of 1000 s and the induced effect on the Ramsey fringe for the cavity detunning is 1.27×10⁻¹³.
H. Global Accuracy Budget
The accuracy of an atomic frequency standard is defined as the capacity of the standard to produce a frequency that is in agreement with the definition of the second. It is ex-pressed like a relative uncertainty³∆νν
0
´
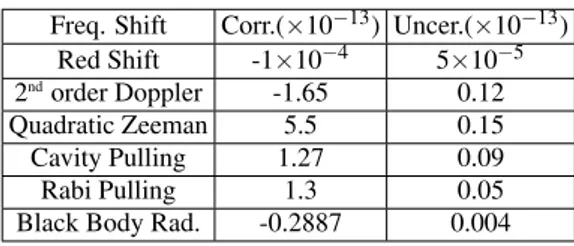
relative to the sec-ond definition. Applying the several corrections to our fre-quency standard, and their corresponding uncertainty, table I was constructed, with each uncertainty obtained earlier being described.
Freq. Shift Corr.(×10−13) Uncer.(×10−13) Red Shift -1×10⁻⁴ 5×10⁻⁵ 2ndorder Doppler -1.65 0.12
Quadratic Zeeman 5.5 0.15
Cavity Pulling 1.27 0.09
Rabi Pulling 1.3 0.05
Black Body Rad. -0.2887 0.004
TABLE I: Uncertainty table of the atomic beam clock
Finally, the global accuracy of the beam standard isσC = 6.13×10⁻¹³. This value means the precision in which our frequency standard measures the clock transition frequency around 9.192.631.770 Hz.
I. Stability
The stability of an atomic frequency standard caracterizes the capacity of a standard to reproduce the same average fre-quency along the time. It is determined by the square root of the Allan variance
σy(τ) = 1
π
1 Qat(S/N)
r
t
τ (12)
whereτis the sampling time, Qat is the quality factor of the atomic resonance, S/N is the signal to noise ratio for a sam-pling timeτandtis the cycle time.
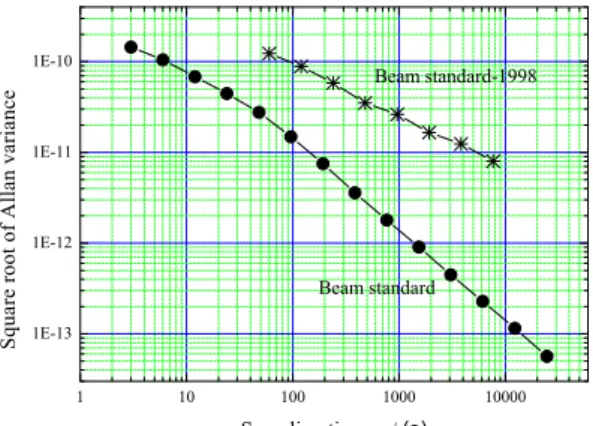
to perform a constant performance evaluation of the atomic beam standard. Fig. 7 shows the short-term stability ob-tained with our 133Cs beam frequency standard versus the sampling timeτ.For comparison we have include in Fig. 7 the stability of the same standard in 1998 (the first evalua-tion),σy(τ) = (1.2±0.7)×10−9τ−0,56±0.7.This poor stabil-ity was attributed to several factors, like mechanical and ther-mal noise in the clock room and a limited signal to noise ra-tio in the atomic detecra-tion. Several changes were performed, including the construction of a room free of mechanical vi-brations and thermally isolated. These changes increased the laser stability and, consequently, the signal to noise ra-tio. For the present evaluation, the short-term stability is
σy(τ) = (6,6±0.2)×10−10τ−0,50±0.1,showing an improve-ment of one order of magnitude
FIG. 7: Square root of the Allan deviation versus the sampling time.
IV. CONCLUSIONS
We presented a full evaluation of the operating Brazilian atomic standard. To evaluate some shifts and the Rabi fre-quency we have used a method well documented in the liter-ature [7,11]. The evaluation of the frequency shifts is made directly from the experimental data. We analyzed the Ramsey pattern of the frequency standard to obtain the optimal Rabi frequency and the shift due to second-order Doppler effect. The biggest source of error in the standard is the quadratic Zeeman effect, influenced by the laboratory surroundings and indicating the necessity of a better magnetic shielding. The cavity pulling due to the oscillating field was also evaluated when the injected power was 2.5dB lower than the optimal value. The obtained shift was 1.27×10⁻¹³. The Rabi pulling was also measured, and the obtained shift was 1.3×10⁻¹³Hz. We have varied the C-field magnitude in order to assure that some inhomogeneity on the Ramsey fringes were due to these pullings. We noted that in the normal operation conditions there was a certain asymmetry in the most external fringes (mF= +3→mF= +3 andmF=−3→mF=−3). We sup-pose that it was due to Rabi and Ramsey pulling. The overal evaluation revels a short term stability of 6×10⁻¹⁰τ−1/2,one order better than the beginning of our program.
We acknowledge the financial support obtained from FAPESP (CEPID/CEPOF), CAPES-COFECUB and Pro-grama TIB-CNPq. We also acknowledge the important col-laboration with BNM-SYRTE - Paris.
[1] Norman F. Ramsey, American Scientific,76, 42 (1988). [2] Harold Lyons, Scientific American,196, 71 (1957). [3] Norman F. Ramsey, Physics Today, p. 25, July 1980.
[4] F.Teles, D. V. Magalh˜aes, M. S. Santos, G. D. Rovera, and V. S. Bagnato, IEEE,47, 1111 (2000).
[5] J. Vanier and C. Audoin,” The Quantum Physics of Atomic Frequency Standard”,Adam Hilger imprint by IOP Publishing LTD, 1989.
[6] A. Makdissi and E. de Clerq, IEEE Trans. Inst. Meas.,46, 112 (1997).
[7] A Makdissi and E. de Clerq, Metrologia, 38, 409 (2001). [8] John H. Shirley, W. D. Lee, G. D. Rovera, and R. E. Drullinger,
IEEE Trans. on Inst. and Meas.,44, 136 (1995).
[9] E. Simon, P. Laurent, and A. Clairon, Phys. Rev. A, 57, 436 (1998).
[10] J. H. Shirley, W. D. Lee, and R. E. Drullinger, Metrologia,38, 427 (2001).