512 Cavalheiro et al. J. Braz. Chem. Soc.
Article
Possibilities of the Use of Fast Scan Voltammetry in Simultaneous Determination
of Purines at Carbon Fiber Ultramicroelectrodes
Éder T. G. Cavalheiroa,b*, Kholoud A. El-Noura,c and Anna Brajter-Totha
a
Department of Chemistry, University of Florida, Gainesville-FL, USA
b
Departamento de Química, Universidade Federal de São Carlos, Via Washington Luís, Km 235, 13565-905, São Carlos - SP, Brazil
c
Department of Chemistry, University of Suez-Canal, Ismailia, Egypt
Hipoxantina, xantina e ácido úrico são purinas encontradas em fluídos extracelulares, que podem ser utilizados como marcadores metabólicos, indicadores da idade de carnes e outras aplicações. Estudos voltamétricos foram desenvolvidos para investigar a possibilidade da determinação simultânea destes analitos em ultramicroeletrodos de fibra de carbono (diâmetro de 7 µm). Os estudos efetuados mostraram a possibilidade destas determinações com coeficientes médios de recuperação da ordem de 97,6%, ao nível de µmol L-1.
Hypoxanthine, xanthine and uric acid are purines present in extracellular fluids that can be used as metabolic markers, in evaluation of meat conservation and other applications. Voltammetric stud-ies were performed in order to investigate the possibility of simultaneous determination of these compounds using carbon fiber ultramicroelectrodes (7 µm diameter). The studies revealed the possibility for performing such determinations with mean recoveries of 97.6% in mixtures of the three compounds at µmol L-1 level.
Keywords: xanthine, hypoxanthine, uric acid, carbon electrodes, fast scan voltammetry
*e-mail: [email protected]
Presented at the XI Simpósio Brasileiro de Eletroquímica e Eletroana-lítica, Maragogi - AL, Brazil, April 5-9, 1999. Guest editor: Luis Alberto Avaca.
Introduction
Oxypurines xanthine (XA), hypoxanthine (HX) and uric
acid (UA) are products of metabolism of nucleotides1 and
can be found in extracellular fluids. Their determination is important since they can be related with the depletion of
adenosine triphosphate (ATP) in tissues2 and are the final
products of purine metabolism in humans. Overproduction
of UA can cause gout3,4.
Chromatographic methods for purine determination
are summarized in reviews5. Electrochemical methods
include stripping of Cu(II) complexes6-10, adsorptive
stripping of purines from Hg11. Immobilization of the
enzyme xanthine oxidase to electrodes has also been used12-15, as it catalyses the conversion of XA and HX to
UA. Recently we evaluated the performance of carbon electrodes and carbon fiber ultramicroelectrodes in
amperometric determination of XA and HX, in relation to
the surface activation in different techniques16.
In the present study the possibilities of simultaneous determination of XA, HX and UA are investigated at carbon fiber ultramicroelectrodes. The interference of uric acid generated in xanthine oxidation is evaluated using fast scan voltammetry in phosphate buffer at physiological pH, with the advantages of a miniaturized system.
Experimental
All the chemicals were of analytical grade and used without further purification. The experiments were
performed in 70 mmol L-1 phosphate buffer at pH 7.4.
The instrumental setup as well as the carbon fiber ultramicroelectrode (CF-UME) preparation have been
described earlier17. Briefly, a triangular waveform from a
function generator (Universal Programmer PAR-175 EG&G)
was applied to a two electrode cell (80 µL internal volume).
The current at the CF-UME was monitored using an oscilloscope (Le Croy – 9310) coupled to a home made
pre-amplifier18. A microcomputer was employed for data
J. Braz. Chem. Soc., Vol. 11, No. 5, 512-515, 2000. Printed in Brazil
Vol. 11 No. 5, 2000 Possibilities of the Use of Fast Scan Voltammetry at Carbon Fiber 513
acquisition. The reference in all measurements was a saturated calomel electrode (SCE).
The CF-UME was electrochemically pretreated by
successively cycling the electrode in 70 mmol L-1
phosphate buffer pH 7.4 between +1.5 and -1.0 V, for 30
minutes at 10 V s-117.
The voltammograms were measured between +1.5 and
–1.0 V, at 10 V s-1. Initially the mean of a fixed number of
background scans was recorded in one channel of the oscilloscope. The same number of scans was taken for the sample and the mean stored in a second channel of the oscilloscope, then subtracted from the previously stored mean background signal. The currents were measured at the potential of maximum signal around +1.2 (HX), +0.8 (XA), and +0,5 V (UA) relative to the SCE.
Results and Discussion
Simultaneous determination of XA e HX
Background subtracted voltammograms of 100 mmol L-1
of XA and HX in 70 mmol L-1 phosphate buffer, pH 7.4,
after 100 cycles (10 V s-1) at electrochemically pretreated
CF-UME are presented in Figure 1.
Attribution of the peaks was discussed by Hansen and
Dryhurst (XA)19 and by Conway and coworKers (HX)20.
Peaks I and II in the XA voltammogram were related to the UA (generated in the XA oxidation) reversible redox process, and presented no influence in the XA determination.
At lower scan rates (< 500 mV s-1) these peaks were not
observed21 and should not interfere in the UA current.
Typical results for simultaneous determination of XA and HX are shown in Figure 2, at pretreated CF-UME, after
100 cycles at 10 V s-1, under conditions that have been
established earlier22. The currents were measured at the
potential of maximum signal and the results presented in Table 1. From the data it is possible to conclude that XA and HX can be determined simultaneously. Data for individual XA and HX are also shown in Table 1.
b a
II
I
1.5 1.0 0.5 0.0 -0.5 -1.0
Current
1 n A
Potential / V
Figure 1. 100 µmol L-1 XA (a) and HX (b) voltammograms at
pretreated CF-UME in 70 mmol L-1 phosphate buffer, pH 7.4, after 100 cycles at 10 V s-1.
5 10 15 20 25 0.0
0.2 0.4 0.6 0.8 1.0
XA HX
Current
/
nA
XA and HX concentration / µmol
1.5 1.0 0.5 0.0 -0.5 -1.0 UA
X A
HX
0.4 nA
Potential / V
Figure 2. Analytical curves for simultaneous determination of XA
and HX, under the conditions described in Table 2. In the detail a voltammogram of a mixture of XA and HX both 17 µmol L-1.
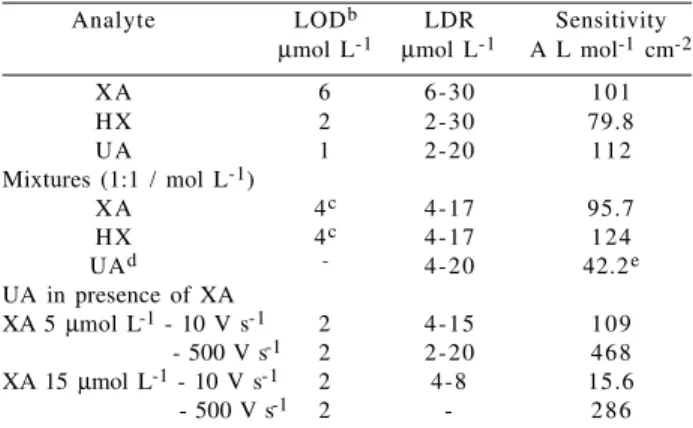
Table 1. Analytical results for individual purines and mixtures of
XA/HX and XA/UAa.
Analyte LODb LDR Sensitivity µmol L-1 µmol L-1 A L mol-1 cm-2
X A 6 6-30 1 0 1
H X 2 2-30 79.8
U A 1 2-20 1 1 2
Mixtures (1:1 / mol L-1)
X A 4c 4-17 95.7
H X 4c 4-17 1 2 4
UAd - 4-20 42.2e
UA in presence of XA
XA 5 µmol L-1 - 10 V s-1 2 4-15 1 0 9
XA 5 mM - 500 V s-1 2 2-20 4 6 8 XA 15 µmol L-1 - 10 V s-1 2 4-8 15.6
XA 5 mM - 500 V s-1 2 - 2 8 6
a. 70 mmol L-1 phosphate buffer, pH 7.4, UME radius 3.5x10⁻⁴ cm,
scan rate 10V s-1, 100 cycles; b. Limit of Detection = 3 x
peak-to-peak noise; c. estimated from 3 x the peak-to-peak-to-peak-to-peak noise; d. generated in xanthine oxidation; e. supposing 100% XA converted to UA.
Interference of XA on the UA signal
Since the UA generated by XA oxidation shows a significant signal under the scan rates used in the present
514 Cavalheiro et al. J. Braz. Chem. Soc.
work, it could interfere in the UA determination when both XA and UA are present in the same solution.
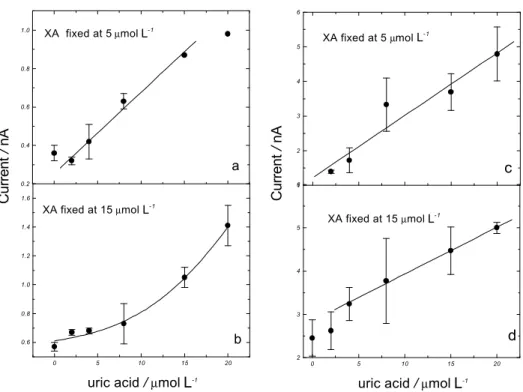
In order of evaluate the influence of the UA generated in XA oxidation on the signal of the UA present in the same sample and the possibility of reducing the interference by increasing the scan rate, mixtures of UA in different concentrations and fixed XA were prepared and their cyclic voltammograms were recorded at 10 and 500
V s-1. The results are shown in Figure 3.
At 10 V s-1 in the presence of 5 µmol L-1 XA, the UA
presented the same sensitivity as in the absence of XA, suggesting that under such conditions there is no influence
from XA in UA determination. When XA was fixed at 15 µmol
L-1, the LDR (linear dynamic range) for UA is shorter and the
sensitivity decreased significantly. The UA current increased
exponentially over 8 µmol L-1 UA, showing a significant
influence of XA on UA determination at this concentration level. It is interesting to note that the current measured for UA generated in XA oxidation is higher than the XA current in this case. The decrease of UA sensitivity may be caused by the adsorption of XA (or its oxidation products) on the electrode
surface. When the determination is performed at 500 V s-1, the
inter-ference of 5 µmol L-1 XA in UA current is lower, as the XA
signal is significantly reduced at such scan rate18. When
15 µmol L-1 XA is present the LDR for UA determination is
changed and the sensitivity is lowered (see Table 1).
The use of 10 V s-1 is a reasonable approach for the
determination of both analytes, as the XA peak presented
a lower resolution at higher scan rates22.
Simultaneous determination of XA, HX and UA
In these experiments mixtures of XA, HX and UA at the same concentration have been prepared and the currents
measured for each compound at 10 V s-1, after 100 cycles
in 70 mmol L-1 phosphate buffer, pH 7.4. The results are
summarized in Table 2. It was concluded that it is possible to determine the three compounds in the same sample without interference at this concentration level.
1 2 3 4 5 6
XA fixed at 5µmol
0 5 10 15 20
2 3 4 5 6
XA fixed at 15µmol l- 1
d c
Current
/
nA
uric acid / µmol
0 5 10 15 20
0.6 0.8 1.0 1.2 1.4 1.6
b a
uric acid / µmol
XA fixed at 15µmol
Current
/
nA
0.2 0.4 0.6 0.8
1.0 XA fixed at 5µmol
Figure 3. Influence of 5 (a,c) and 15 (b,d) µmol L-1 XA in UA analytical curves, at 10 (a,b) and 500 (c,d) V s-1. Other conditions as in Table 2.
Table 2. Analytical results for mixtures of XA, HX and UAa.
Sample LODb LDR Sensitivity µmol L-1 µmol L-1 A L mol-1 cm-2
Mixture (1:1:1 /µM)
X A 2 6-15 1 2 7
H X 2 6-15 2 0 0
U A 2 4-10 1 5 9
a. 70 mmol L-1 phosphate buffer pH 7.4, UME radius 3.5x10⁻⁴ cm,
scan rate 10 V s-1, 100 cycles. b Limit of detection = 3 x signal/noise.
Recovery tests were performed in mixtures 8:6:6 µmol L-1
of the analytes. These concentrations were chosen to be near the limit of detection and in the linear dynamic range for three purines. The results are presented in Table 3.
Table 3. Recovery tests for mixtures of XA, HX and UAa,b.
Mixture / µM Recovery / µmol L-1 (%)
H X X A U A H X X A U A
8 6 6 7.1(89) 6.7(111) 7.1(119) 6 6 8 7.1(118) 6.7(111) 8.7(108) 6 8 6 6.7(112) 7.3(91) 7.1(119) a. Conditions as in Table 2. b. Mean of three determinations.
L- 1
L- 1
L- 1
L- 1
L-1
Vol. 11 No. 5, 2000 Possibilities of the Use of Fast Scan Voltammetry at Carbon Fiber 515
The recoveries between 89-119% (mean recovery 97.6%), were considered satisfactory in view of the complexity of the mixtures and the concentration level determined. These data suggest a positive outlook for future applications in samples of this magnitude of concentration. The positive intercepts in all plots of Figure 3 are probably related to the presence of UA from XA oxidation. Lower detection limits have been observed in stripping
methods7-10, but with the inconvenience of using the
mercury electrode.
References
1. Murray, A. W. Ann. Rev. Biochem.1971, 40, 811.
2. Harkness, R. A. J. Chromatogr. 1988, 429, 255.
3. Caraway, W. T. Stand. Methods Clin. Chem.1963,
4, 239
4. Balis, M. E. Adv. Clin. Chem.1967, 10, 157.
5. Simpson, R. C.; Brown, P. R. J. Chromatogr. 1986,
379, 269.
6. Glodowiski, S.; Bilewicz, R.; Kublik, Z. Anal. Chim.
Acta. 1986, 186, 39.
7. Househam, B. C.; Van den Berg, C. M. G.; Riley, J. P.
Anal. Chim. Acta. 1987, 200, 291.
8. Shubietah, R.M.; Abu-Zuhri, A.Z.; Fogg, A.G.;
Electroanalysis 1995, 7, 975
9. Ibrahim, M. S.; Ahmed, M. E.; Kawade, A. M.; Temerk,
Y. M. Analusis1996, 24, 6.
10. Ibrahim, M. S.; Ahmed, M. E.; Temerk, Y. M.; Kawade,
A. M. Anal. Chim. Acta1996, 328, 47.
11. Palacek, E. Anal. Biochem.1980, 108, 129.
12. Ianiello, R. M.; Lindsay, T. J.; Yacynych, A. M. Anal.
Chem.1982, 54, 1980.
13. McKenna, K.; Brajter-Toth, A. Anal. Chem.1987,
59, 954.
14. Yao, T. Anal. Chim. Acta1993, 281, 323.
15. Arai, G.; Takahashi, S.; Iasumori, I. J. Electroanal.
Chem.1996, 410, 173.
16. Cavalheiro, E. T. G.; Brajter-Toth, A. J. Pharm.
Biomed. Anal.1999, 19, 217.
17. Hsueh, C.C.; Bravo, R.; Jaramillo, A.; Brajter-Toth, A.; Anal. Chim. Acta1997, 349, 67.
18. Hsueh, C. C.; Brajter-Toth, A. Anal. Chim. Acta1996,
321, 209.
19. Hansen, B. H.; Dryhurst, G. J. Electroanal. Chem.
1971, 30, 417.
20. Conway, A. C.; Goyal, R. N.; Dryhurst, G. J.
Electro-anal. Chem.1981, 123, 243.
21. Goyal, R. N.; Mittal, A.; Sharma, S. Electroanalysis
1994, 6, 609
22. Cavalheiro, E. T. G.; Bravo R.; Brajter-Toth, A. In Pittcon’99, New Orleans (USA), 1998, 1684P.
Received: May 31, 1999 Published on the web: August 31, 2000