www.atmos-chem-phys.net/13/8973/2013/ doi:10.5194/acp-13-8973-2013
© Author(s) 2013. CC Attribution 3.0 License.
Atmospheric
Chemistry
and Physics
Geoscientific
Geoscientific
Geoscientific
Geoscientific
Measuring and modeling the hygroscopic growth of two humic
substances in mixed aerosol particles of atmospheric relevance
I. R. Zamora1and M. Z. Jacobson2
1Department of Geophysics, Stanford University Yang and Yamazaki Environment and Energy Building, 473 Via Ortega,
Room M05, Stanford, California 94305, USA
2Department of Civil and Environmental Engineering, Stanford University Yang and Yamazaki Environment and Energy
Building, 473 Via Ortega, Room 397, Stanford, California 94305, USA
Correspondence to: I. R. Zamora ([email protected]) and M. Z. Jacobson ([email protected])
Received: 20 December 2012 – Published in Atmos. Chem. Phys. Discuss.: 9 January 2013 Revised: 10 July 2013 – Accepted: 18 July 2013 – Published: 9 September 2013
Abstract. The hygroscopic growth of atmospheric particles affects atmospheric chemistry and Earth’s climate. Water-soluble organic carbon (WSOC) constitutes a significant fraction of the dry submicron mass of atmospheric aerosols, thus affecting their water uptake properties. Although the WSOC fraction is comprised of many compounds, a set of model substances can be used to describe its behavior. For this study, mixtures of Nordic aquatic fulvic acid reference (NAFA) and Fluka humic acid (HA), with various combi-nations of inorganic salts (sodium chloride and ammonium sulfate) and other representative organic compounds (lev-oglucosan and succinic acid), were studied. We measured the equilibrium water vapor pressure over bulk solutions of these mixtures as a function of temperature and solute con-centration. New water activity (aw) parameterizations and
hygroscopic growth curves at 25◦C were calculated from these data for particles of equivalent composition. We ex-amined the effect of temperature on the water activity and found a maximum variation of 9 % in the 0–30◦C range, and 2 % in the 20–30◦C range. Five two-component mix-tures were studied to understand the effect of adding a humic substance (HS), such as NAFA and HA, to an inorganic salt or a saccharide. The deliquescence point at 25◦C for HS-inorganic mixtures did not change significantly from that of the pure inorganic species. However, the hygroscopic growth of HA / inorganic mixtures was lower than that exhibited by the pure salt, in proportion to the added mass of HA. The addition of NAFA to a highly soluble solute (ammonium sul-fate, sodium chloride or levoglucosan) in water had the same effect as the addition of HA to the inorganic species for most
of the water activity range studied. Yet, the water uptake of these NAFA mixtures transitioned to match the growth of the pure salt or saccharide at highawvalues. The remaining four
mixtures were based on chemical composition data for dif-ferent aerosol types. As expected, the two solutions repre-senting organic aerosols (40 % HS / 40 % succinic acid / 20 % levoglucosan) showed lower water uptake than the two solu-tions representing biomass burning aerosols (25 % HS / 27 % succinic acid / 18 % levoglucosan / 30 % ammonium sulfate). However, interactions in multicomponent solutions may be responsible for the large variation of the relative water uptake of identical mixtures containing different HSs above a water activity of 0.95. The ZSR (Zdanovskii, Stokes, and Robin-son) model was able to predict reasonably well the hygro-scopic growth of all the mixtures belowaw=0.95, but
pro-duced large deviations for some multicomponent mixtures at higher values.
1 Introduction
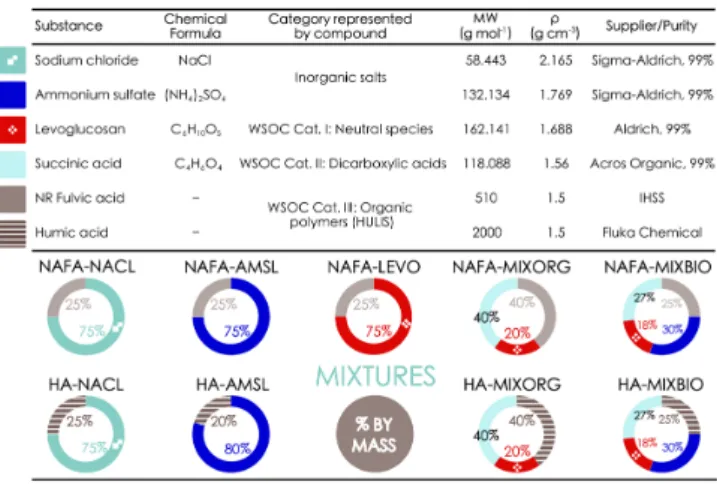
Fig. 1. Substances chosen as model compounds, their properties and mixtures of these substances studied in this work.
atmospheric aerosols – both their direct effect by radiation scattering and their indirect effects by modifying cloud prop-erties. These climate effects account for the largest cause of uncertainty in radiative forcing estimates (IPCC, 2007).
Atmospheric particles consist of a mixture of organic and inorganic components. The inorganic portion, previ-ously thought to dominate the water uptake of atmospheric aerosols, has been well characterized. Organic matter can be 20–50 % of the total fine aerosol mass (Saxena and Hildemann, 1996; Putaud et al., 2004), and as high as 90 % over biomass burning regions during burning season (Andreae and Crutzen, 1997; Talbot et al., 1988, 1990; Ar-taxo et al., 1988, 1990; Roberts et al., 2001; Bond et al., 2004). Between 45 and 75 % of this organic matter is water-soluble organic carbon (WSOC) and may therefore influence the hygroscopic growth behavior of atmospheric aerosols (Decesari et al., 2005; Saxena and Hildemann, 1996; Mader et al., 2004). This influence has been the subject of ongo-ing research durongo-ing the past decade, though our knowledge is still limited (Kanakidou et al., 2005; Zhang et al., 2007; Hallquist et al., 2009).
Challenges in studying the hygroscopic behavior of the or-ganic fraction are its complexity and the lack of information about its chemical composition (Jimenez et al., 2009). Fuzzi et al. (2001) proposed identifying a set of model compounds that can reproduce the behavior of the WSOC fraction of real aerosol particles with the help of chromatographic separation and proton nuclear magnetic resonance (HNMR) analysis. This analysis of WSOC from aerosol filter samples shows that it contains compounds in three categories: (i) neutral species, such as saccharides; (ii) mono/dicarboxylic acids; and (iii) water-soluble surfactants, including humic-like or-ganic polymers (Fuzzi et al., 2001; Mayol-Bracero et al., 2002; Decesari et al., 2005). Decesari et al. (2001) identi-fied up to 40 % of WSOC as polycarboxylic acids resem-bling the molecular structures of humic materials using the
same HNMR technique. The similarity of the polycarboxylic acid fraction to humic materials, observed in several studies (Mukai and Ambe, 1986; Havers et al., 1998; Facchini et al., 1999; Gelencs´er et al., 2000; Kriv´acsy et al., 2000; Duarte et al., 2005; Alfarra et al., 2006), has earned this fraction the name HUmic-LIke Substances (HULIS).
Following this approach, we have chosen model com-pounds to represent each WSOC category in order to study the water uptake of mixed atmospheric particles. Levoglu-cosan, a saccharide that is used as a tracer for biomass burn-ing (Simoneit et al., 1999), was selected to represent category I. Succinic acid, often identified as one of the most abundant dicarboxylic acids in atmospheric aerosol samples (Rogge et al., 1993; Chebbi and Carlier, 1996; Kerminen et al., 2000; Kawamura et al., 2001a, b; Narukawa et al., 2002, Jung et al., 2010; Hegde and Kawamura, 2012), was chosen to repre-sent category II. The humic substances Nordic aquatic fulvic acid reference (NAFA) and Fluka humic acid (HA), obtained from the International Humic Substance Society (IHSS), were chosen as model compounds for category III. To rep-resent the inorganic component that can contribute to water uptake, we use sodium chloride and ammonium sulfate, two inorganic salts ubiquitous in the atmosphere. Figure 1 lists these substances, along with their properties, and the nine different mixtures prepared for this work. Two-component mixtures were made in order to study the mixed particles of humic substances with inorganic salts (NAFA–NACL, NAFA–AMSL, HA–NACL, and HA–AMSL), and with a category I compound (NAFA–LEVO). The composition of the remaining mixtures (NAFA–MIXORG, HA–MIXORG, NAFA–MIXBIO, and HA–MIXBIO) was adopted from two mixtures studied by Svenningsson et al. (2006) with the hy-groscopic tandem differential mobility analyzer (HTDMA). MIXORG and MIXBIO contained a different fulvic acid, Suwannee River fulvic acid (SRFA), and were based on chemical analyses of different aerosol types. MIXORG rep-resents the organic portion of continental polluted aerosol, and MIXBIO represents biomass burning aerosols (Zappoli et al., 1999; Decesari et al., 2001; Artaxo et al., 2002; Mayol-Bracero et al., 2002).
The hygroscopic growth of NAFA has been studied in pure particles with a HTDMA (Gysel et al., 2004), and in a 50:50 mass ratio mixture with ammonium sulfate with an osmome-ter (Frosch et al., 2011). However, ours appears to be the only study to date to focus on NAFA in multicomponent mixtures and to study the water uptake of humic and fulvic acid mix-tures with a bulk solution method.
Bulk water activity measurements present a method to cor-roborate the hygroscopic growth data measured directly with the HTDMA or EDB due to the simplicity of the equipment setup and the measurement procedure. Our bulk method eliminates the problems of fully drying particles, the effects of the equipment setup and of the measurement procedure. While the dehydration branch of the hygroscopic growth curve cannot be examined, bulk measurements can be col-lected at higher water activity values than HTDMA or EDB measurements. Another advantage is that water activity can be directly measured and parameterized in terms of solu-tion concentrasolu-tion. A recent review article on the role of or-ganic aerosols in global climate modeling identified a critical need for parameterizations of water activity from available data and future studies (Kanakidou et al., 2005). One sim-ple way to model the water uptake of mixed particles is the Zdanovskii, Stokes, and Robinson (ZSR) method (Stokes and Robinson, 1966). The ZSR method predicts mixed particle hygroscopic growth by calculating the particle water content as the sum of the water content associated with the pure com-ponents comprising that particle at a specific relative humid-ity (RH). It is based on the assumption that individual compo-nents do not interact. Several studies on hygroscopic growth of mixed particles have compared their results with the ZSR method (Alshawa et al, 2009; Brooks et al., 2004; Choi and Chan, 2002a, b; Cruz and Pandis, 2000; Meyer et al., 2009; Moore et al., 2008; Prenni et al., 2003; Svenningsson et al., 2006; Sjogren et al., 2007; Wise et al., 2003; Wu et al., 2011). We have chosen to test the strength of this widely used method to predict the hygroscopic growth of our mixtures.
In this work, we study the hygroscopic growth of aerosol particles containing two humic substances, each mixed with organic and inorganic components. Model compounds based on the approach proposed by Fuzzi et al. (2001) were chosen to represent the organic component. Two inorganic salts of atmospheric relevance were chosen to represent the inorganic component. The mixtures studied, along with their chemical composition, are shown in Fig. 1. The hygroscopic growth of the particles was calculated from bulk water vapor pressure measurements over solutions of equivalent composition. The equilibrium water vapor pressure was measured as a func-tion of temperature and solufunc-tion concentrafunc-tion with a water activity apparatus. This study builds upon our previous work quantifying the hygroscopic growth of single organic solutes (Zamora et al., 2011).
This work aims to (1) generate water activity parameteri-zations for pure substances and mixtures at 25◦C in the form of concentration vs. water activity; (2) quantify the effect of
humic substances on the hygroscopic growth of inorganic salts and of a saccharide; (3) compare the hygroscopic behav-ior of two humic substances, of different molecular weight ranges, in the mixtures of atmospheric relevance; (4) explore the effect of temperature on the water activity of mixtures in the 0–30◦C range; and (5) assess the ability of the ZSR method to estimate the hygroscopic growth of the mixtures studied.
2 Material and methods
2.1 Materials and solution preparation
Solutions were prepared by weighing each solid component and water into a glass vessel, then stirring until the solution became as homogeneous as possible. It is worth noting that some suspended solid was visible on the solutions at higher concentrations, indicating that not all of the solid went into the solution. Figure 1 lists all chemicals used in the solutions along with their manufacturer, purity, and relevant proper-ties. All chemicals were used without further purification. Water employed in the preparation of solutions was filtered through a Millipore Synergy 185 system (EMD Millipore, Billerica, MA), with a resulting resistivity of 18.2 m. For mixed solutions containing NAFA, multiple dilutions pre-pared from a concentrated stock solution were used due to the limited quantities available of IHSS standards (IHSS, 2012, https://ihss.humicsubstances.org/).
2.2 Measuring water vapor pressure
Water vapor pressure measurements were conducted with a bulk method described in detail by Zamora et al. (2011). Briefly, the apparatus used consists of a removable glass sam-ple vessel, mechanically pumped glass lines wrapped with heating tape, a temperature-controlled bath, and a 100 torr Baratron capacitance manometer (Model 626A12TBE, MKS Instruments, Andover, MA). Approximately 3 g of the solu-tion of interest were transferred to the sample vessel, which contained a Teflon-coated magnetic stirring bar to ensure a homogenous composition for the solution. After the sample vessel was connected to the apparatus, several freeze–purge– thaw cycles were performed to evacuate the gas headspace above the solution.
Air leaks were infrequent and never exceeded 0.2 torr. To avoid directional bias, each data point reported in the water activity vs. temperature curves was averaged over duplicate measurements taken in both the increasing and decreasing temperature directions.
2.3 Quality assurance
For each temperature, a water vapor pressure measurement was calibrated by subtracting the difference between our value and that obtained from the Aerosol Inorganic Model (AIM) (Clegg et al., 1998) for pure water. Our method was validated with sodium chloride and ammonium sulfate. Wa-ter vapor pressure measurements over aqueous solutions of these inorganic salts at 25.0◦C matched the values predicted by AIM. The deliquescence relative humidity (DRH) and hy-groscopic growth factor values calculated from these data were in good agreement with values from published TDMA, EDB and bulk studies. The uncertainty associated with the water activity at 25◦C of pure solutes was reported to be be-tween 0.007 and 0.018 in our previous work. This uncertainty range was found over a relative humidity range of 70–99.9 %. Full details of our method calibration, validation and quality control experiments can be found in Zamora et al., 2011.
This study employed a thermocouple with higher accu-racy; thus the measurement uncertainty for the mixtures is lower than for the pure substances. This uncertainty was based on the accuracy of the thermocouple, and on the precision obtained experimentally for the vapor pressure measurements. The uncertainty range for the water vapor pressure measurements collected in the 0–30◦C range was found to be 0.3–1.4 %, with the highest uncertainty occur-ring at the lowest temperature. At the temperature where most of the measurements were made, 25◦C, the uncer-tainty range is reported to be Pv±0.5 % for the water
va-por pressure measurements and aw±0.005 (RH±0.5 %)
for the water activity.
2.4 Comparison to particle measurement techniques
In the literature, water activity measurements have been re-ported to have accuracies of ±0.003–0.5 (or ±0.3–5 % in terms of RH), though most recent studies are in the±0.3– 3 % range (Zhang et al., 1993a, b; Peng et al., 2001a; Wise et al., 2003; Marcolli et al., 2004). The uncertainty range for the relative humidity in our study was within this range (±0.5 % at 25◦C). Reported measurement uncertainties as-sociated with the EDB typically range from±1–5 % (Cruz and Pandis, 2000; Peng et al., 2001a; Chan et al., 2005), while those associated with the HTDMA approximately vary from±0.3 to 5 % (Cruz and Pandis, 2000; Gysel et al., 2002; Brooks et al., 2004; Dinar et al., 2007). Our bulk method seems to have similar associated uncertainty to the particle-based methods but has the ability to study higher relative hu-midities.
3 Calculation
Several parameters were obtained for the mixed particles de-scribed in Fig. 1, calculated from measurements of bulk solu-tions made with equivalent composisolu-tions. The water activity (aw)was calculated from the ratio of the water vapor pressure
over the solution (Pv)to the saturation water vapor pressure
(Pv,s)at the same temperature,
aw=
RH 100 %=
Pv(T )
Pv,s(T )
. (1)
Because the Kelvin effect was not considered in this study, the calculations in this section apply to particles>0.10µm in diameter for the inorganic salts, levoglucosan and succinic acid, and for particles>0.20 µm in diameter for the humic substances and their mixtures. Our measured surface tension data show a Kelvin correction smaller than the associated un-certainty of water activity above these diameter values.
The mass fraction of solid in a solution was calculated as mfsolid=
gsolid
gsolid+gwater
. (2)
wheregsolidis the total mass of dissolved solid from all
so-lutes andgwater is the mass of water in solution. The mass
fraction of solid can also be expressed in percentage form, mass %mix= (mfsolid)×100. For each solution, the mass
per-centage was plotted as a function of water activity and fitted with a polynomial to obtain mass %mix=f (aw).
The hygroscopic growth factor of the mixed particles as a function of water activity was directly computed using
Gf,mix(aw)=
mf
solid, dryρmix,dry
mfsolid,wetρmix,wet
13
. (3)
where mfsolid, dryis the mass fraction of solid in the dry
par-ticle (=1), mfsolid, wetis the mass fraction of solid in the wet
particle (=mass %mix/100), andρmix, dryandρmix, wetare the
dry and wet mixed particle densities, respectively. These den-sities were estimated assuming that the volumes are additive when two or more compounds are mixed,
1
ρmix
=X
c
mfc
ρc
. (4)
where mfc andρc are the mass fraction and density of each
component in solution including water forρmix, wet.
For the pure solutes with known molar weight, an equation equivalent to Eq. (3) but in terms of molality was used to calculate the hygroscopic growth factor:
Gf(aw)=
ρ
dry
ρwet
1+ C
Mdrymowet
13
. (5)
whereρdryandρwetrefer to the dry and wet particle density;
Mdryis the molar mass of the solute in g mol−1;Cis a
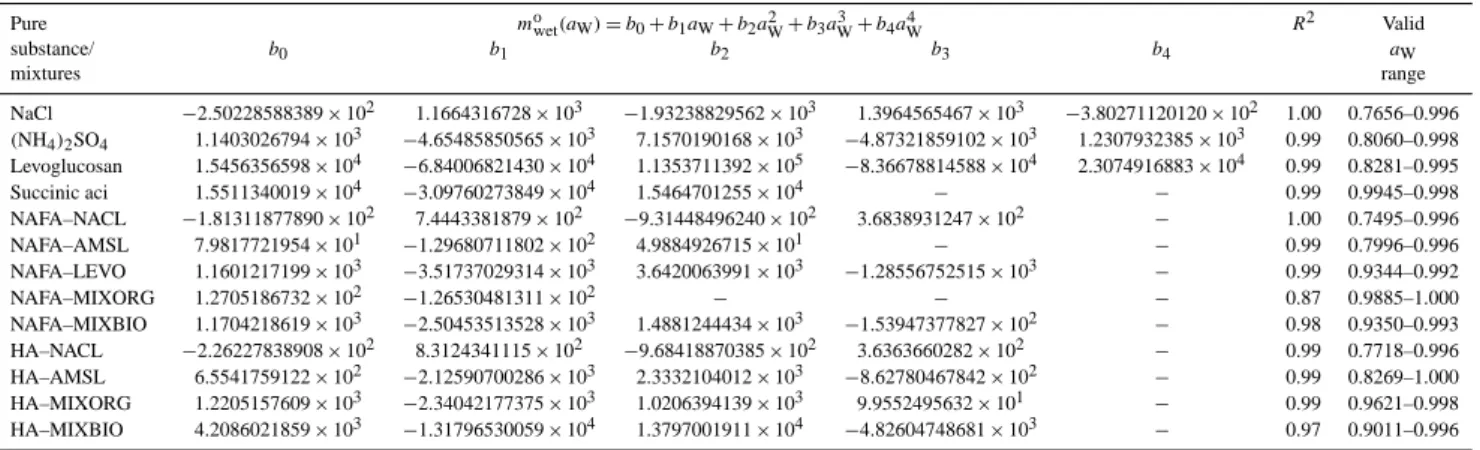
Table 1. Water activity parameterization of data at 25◦C, presented as molality (mowet) versus water activity (aW). Every coefficient (bi) reported in the parameterization, along with all its decimals, should be used in calculations. Note that molar weight estimates for the humic substances (Fig. 1) were used to calculate the molality of their mixtures.
Pure mowet(aW)=b0+b1aW+b2a2W+b3aW3 +b4aW4 R2 Valid
substance/ b0 b1 b2 b3 b4 aW
mixtures range
NaCl −2.50228588389×10² 1.1664316728×10³ −1.93238829562×10³ 1.3964565467×10³ −3.80271120120×10² 1.00 0.7656–0.996 (NH4)2SO4 1.1403026794×10³ −4.65485850565×10³ 7.1570190168×10³ −4.87321859102×10³ 1.2307932385×10³ 0.99 0.8060–0.998
Levoglucosan 1.5456356598×10⁴ −6.84006821430×10⁴ 1.1353711392×10⁵ −8.36678814588×10⁴ 2.3074916883×10⁴ 0.99 0.8281–0.995
Succinic aci 1.5511340019×10⁴ −3.09760273849×10⁴ 1.5464701255×10⁴ − − 0.99 0.9945–0.998 NAFA–NACL −1.81311877890×10² 7.4443381879×10² −9.31448496240×10² 3.6838931247×10² − 1.00 0.7495–0.996 NAFA–AMSL 7.9817721954×101 −1.29680711802×10² 4.9884926715×101 − − 0.99 0.7996–0.996 NAFA–LEVO 1.1601217199×10³ −3.51737029314×10³ 3.6420063991×10³ −1.28556752515×10³ − 0.99 0.9344–0.992
NAFA–MIXORG 1.2705186732×10² −1.26530481311×10² − − − 0.87 0.9885–1.000
NAFA–MIXBIO 1.1704218619×10³ −2.50453513528×10³ 1.4881244434×10³ −1.53947377827×10² − 0.98 0.9350–0.993
HA–NACL −2.26227838908×10² 8.3124341115×10² −9.68418870385×10² 3.6363660282×10² − 0.99 0.7718–0.996 HA–AMSL 6.5541759122×10² −2.12590700286×10³ 2.3332104012×10³ −8.62780467842×10² − 0.99 0.8269–1.000 HA–MIXORG 1.2205157609×10³ −2.34042177375×10³ 1.0206394139×10³ 9.9552495632×101 − 0.99 0.9621–0.998 HA–MIXBIO 4.2086021859×10³ −1.31796530059×10⁴ 1.3797001911×10⁴ −4.82604748681×10³ − 0.97 0.9011–0.996
is the molality of the wet particle in mol kg−1of water, which depends on its water activity (aw).
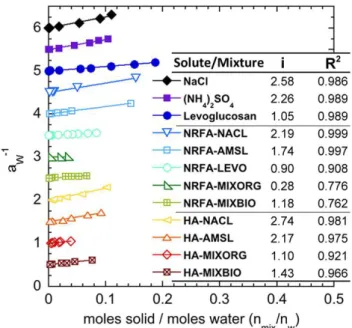
Since our solutions are far from ideal due to large solute concentrations and electrolyte content, deviations from ide-ality are needed to estimate water activity as a function of composition. The van’t Hoff factor (i), used as a measure of solution non-ideality (Pruppacher and Klett, 1980), is defined through
aw−1=1+i
n
mix
nw
. (6)
wherenmix is the sum of the dissolved moles from all the
solutes in solution andnw is the moles of water in solution.
Note that molar weight estimates, listed in Fig. 1, were used to calculate the number of moles for humic substances.
The ZSR method models mixed particle hygroscopic growth by assuming the particle water content is the sum of the water content associated with the pure components com-prising that particle at a specific relative humidity. The fol-lowing ZSR equation (Stokes and Robison, 1966; Gysel et al., 2004, Wise et al., 2003) can be used to estimate mixture growth factors using measured growth factors for the pure components
Gf,mix(aw)=
( X
i
εiG3f,i(aw)
)13
. (7)
whereεi is the volume fraction of soluteiin the dry particle
andGf, i(aw)is the hygroscopic growth factor of the pure
soluteias a function ofaw.
4 Results and discussion
4.1 Pure substances
Previously, we obtained the hygroscopic growth factor as a function of RH for several pure substances in the 0–30◦C temperature range. These solutes included those chosen for the present work: sodium chloride, ammonium sulfate, lev-oglucosan, succinic acid, NA fulvic acid and Fluka humic acid (HA). The Gf values for the inorganic salts,
levoglu-cosan, and succinic acid were in excellent agreement with published TDMA, EDB, and bulk data. However, our data for NAFA and Fluka HA indicated no hygroscopic growth up to a RH of 99.9 %, disagreeing with previous findings from particle methods. The few published TDMA (Brooks et al., 2004; Gysel et al., 2004) and EDB (Chan and Chan, 2003) studies on these solutes reported 14–66 % particle growth. Data analysis and a full discussion of these results can be found in Zamora et al. (2011).
In this work, we used the relevant data on pure solutes from our previous study to provide a reference for com-parison to the mixtures. Additional data on pure substances were only collected for levoglucosan in order to extend its hygroscopic growth curve at 25◦C to a higher RH. Using data at 25◦C, we obtained water activity parameterizations for sodium chloride, ammonium sulfate, levoglucosan, and succinic acid by fitting the molality vs. water activity data sets with fourth-degree polynomials (Fig. 3a). The resulting R-squared values, 0.999, 0.998, 0.998, and 0.991, indicate good fits of the data. Fit parameters and their associated R-squared values are reported in Table 1. Based on the rela-tion expressed in Eq. (6), we extracted the slope of the lin-ear fit of the inverse water activity (a−w1)versus the ratio of moles of dissolved solute to moles of water (nmix/nw)for
each solution. The resulting van’t Hoff factors (i)and asso-ciated R-squared values are shown in Fig. 4. The calculated
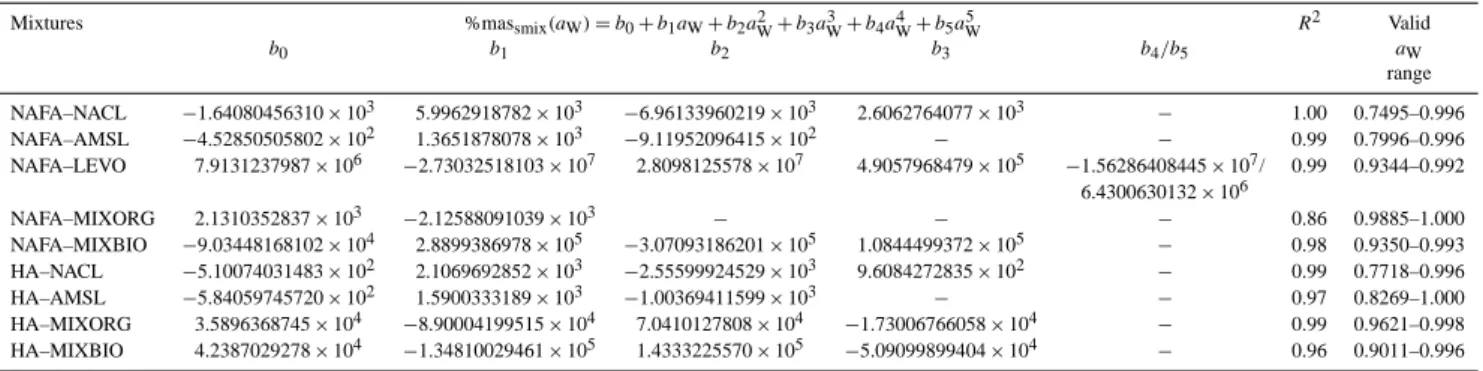
Table 2. Water activity parameterization of data at 25◦C, presented as mass percent (%massmix) versus water activity (aW). Every coefficient (bi) reported in the parameterization, aong with all its decimals, should be used in calculations.
Mixtures %massmix(aW)=b0+b1aW+b2a2W+b3a3W+b4aW4 +b5a5W R2 Valid
b0 b1 b2 b3 b4/b5 aW
range
NAFA–NACL −1.64080456310×10³ 5.9962918782×10³ −6.96133960219×10³ 2.6062764077×10³ − 1.00 0.7495–0.996 NAFA–AMSL −4.52850505802×10² 1.3651878078×10³ −9.11952096415×10² − − 0.99 0.7996–0.996
NAFA–LEVO 7.9131237987×10⁶ −2.73032518103×10⁷ 2.8098125578×10⁷ 4.9057968479×10⁵ −1.56286408445×10⁷/ 0.99 0.9344–0.992 6.4300630132×10⁶
NAFA–MIXORG 2.1310352837×10³ −2.12588091039×10³ − − − 0.86 0.9885–1.000
NAFA–MIXBIO −9.03448168102×10⁴ 2.8899386978×10⁵ −3.07093186201×10⁵ 1.0844499372×10⁵ − 0.98 0.9350–0.993 HA–NACL −5.10074031483×10² 2.1069692852×10³ −2.55599924529×10³ 9.6084272835×10² − 0.99 0.7718–0.996 HA–AMSL −5.84059745720×10² 1.5900333189×10³ −1.00369411599×10³ − − 0.97 0.8269–1.000
HA–MIXORG 3.5896368745×10⁴ −8.90004199515×10⁴ 7.0410127808×10⁴ −1.73006766058×10⁴ − 0.99 0.9621–0.998 HA–MIXBIO 4.2387029278×10⁴ −1.34810029461×10⁵ 1.4333225570×10⁵ −5.09099899404×10⁴ − 0.96 0.9011–0.996
respectively, are in good agreement with van’t Hoff factors reported in the literature of 1.93, 1.87–2.93, and 2 for NaCl, and 2, 2.31, 2.31–2.33, and 2.47 for (NH4)2SO4(Low, 1969;
Gerber et al., 1977; Rogers and Yau, 1989; Wise et al., 2003). The van’t Hoff factor obtained for levoglucosan was 1.06, as expected from the theory and in agreement with that found by Svenningsson et al. (2006) of unity or just below. We have not included the van’t Hoff factor for succinic acid in Fig. 4 since its limited solubility in water prevented the study of a wide range ofnmix/nwvalues.
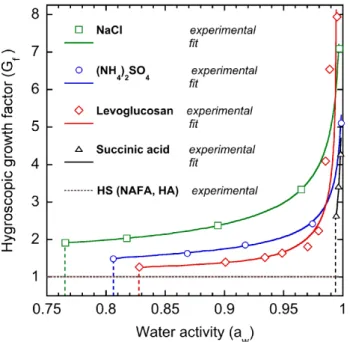
Figure 5 shows the hygroscopic growth factor as a func-tion of water activity for these pure solutes. Each of theseGf
curves was obtained by introducing the molality versus water activity expression into Eq. (5). As mentioned in the quality assurance section, the hygroscopic growth curves for sodium chloride and ammonium sulfate were in good agreement with values from published studies (Tang and Malkewitz, 1993; Cruz and Pandis, 2000). For levoglucosan, we matched hy-groscopic growth factor values from published TDMA, EDB and bulk values (Mochida and Kawamura, 2004; Chan et al., 2005; Svenningsson et al., 2006) up to aw=0.980, above
which we could not find available data in the literature. Note that the hygroscopic growth curve for succinic acid starts at
aw=0.995, where full deliquescence was observed at 25◦C.
A high deliquescence value was expected due to its lim-ited solubility, and was in agreement with published values (Peng et al., 2001b; Wise et al., 2003; Marcolli et al., 2004; Svenningsson et al., 2006), within uncertainty. Hygroscopic growth curves are not shown for NAFA and HA since our method did not detect water uptake up to aw=0.999, and
thereforeGf=1 below thisawvalue.
4.2 Mixtures
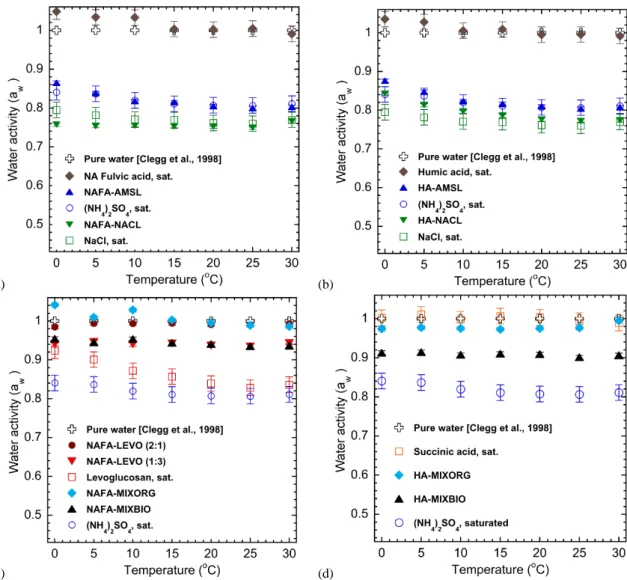
All the data reported for the mixtures were obtained during this study. First, we measured the equilibrium water vapor pressure in the 0–30◦C temperature range over the most con-centrated solution we were able to prepare for each mixture. Figure 2a–d show water activity as a function of temperature from 0 to 30◦C for the all mixtures studied, and for saturated
solutions of their individual components as reference. Equi-librium water activities were measured at 25◦C over all sub-sequent dilutions of the mixtures. The water activity parame-terization, van’t Hoff factors and hygroscopic growth factors were calculated by inputting all the data collected at 25◦C into the equations detailed in Sect. 3. Molality versus wa-ter activity data and their corresponding polynomial fits are shown in Fig. 3a, b, and c for pure substances, NAFA mix-tures, and HA mixtures. Table 1 lists coefficients, R-squared values and valid ranges for water activity parameterization based on these fits. Table 2 includes mass-based water ac-tivity parameterizations, which excludes any molar weight assumptions for the HSs. Figure 4 shows the resulting van’t Hoff factors when the slope was extracted from the linear fit of theaw−1versusnmix/nwdata for each solution. The
hygro-scopic growth factor curves as a function of water activity, along with the corresponding ZSR predictions, are shown in Figs. 5–9.
4.2.1 Humic substances with inorganic salts
tem-(a) (b)
(c) (d)
Fig. 2. Measured water activity as a function of temperature in the 0–30◦C range for the most concentrated solutions made of (a) NAFA and its mixtures with inorganic salts, (b) HA and its mixtures with inorganic salts, (c) NRFA in two mixtures with levoglucosan and in mixtures MIXORG and MIXBIO, and (d) HA in mixtures MIXORG and MIXBIO. See Fig. 1 for mixture compositions. Open symbols show the curves for pure substances at saturated concentrations measured with the same method by Zamora et al. (2011).
peratures studied, indicates that the water activity of mix-tures saturated in both components was governed by the in-organic compound. For 25◦C, we looked at these water ac-tivity data to find the deliquescence point for each mixture. Adding NAFA or HA to ammonium sulfate (NAFA–AMSL, HA–AMSL) did not change its deliquescenceaw value
ap-preciably, changing from 0.806 to 0.800 and to 0.803, re-spectively. For mixtures of NAFA and HA with sodium chlo-ride, the change in deliquescenceaw value was larger (from
0.766 to 0.750 and to 0.772) but still within the uncertainty range of the data for the pure salt from our previous study (aw±0.018). Similarly, Chan and Chan (2003) found that
the deliquescence of 1:1 NAFA / inorganic mixtures was dominated by the inorganic species. We found the maximum variation of the water activity with temperature to be 2.2 %
for NAFA–NACL, 7.8 % for NAFA–AMSL, 8.9 % for HA– NACL and 8.6 % for HA–AMSL, within the range studied.
(a)
(b)
(c)
Fig. 3. Water uptake data plotted as molality versus water activ-ity for the (a) pure substances, (b) the NAFA mixtures, and (c) the HA mixtures chosen for this study. Water activity parameterizations were obtained by fitting each data set with a polynomial (lines). Fit coefficients for all solutions are reported in Table 1. Note that the molality was calculated as the ratio of total dissolved moles for all solutes to kilograms of water added to the solution, and that molar weight estimates were used to convert mass of NAFA and HA into moles.
behavior, and van’t Hoff factors, are unknown. Svenningsson et al. (2006) derived a van’t Hoff factor smaller than 1 for
Fig. 4. Water uptake data plotted as the inverse of the water activity (aw−1)versus the ratio of moles of total dissolved solute to moles of water (nmix/nw)for all solutions. A linear fit was applied to each data set. The slope of the line yields the van’t Hoff factor (i), which is listed along with the R-squared value for the fit. Each data set was plotted with ana−w1offset of 0.5 from the previous one for clarity.
SRFA, but noted that it was based on assumptions regard-ing average molar weight and density used to calculate the molality of SRFA.
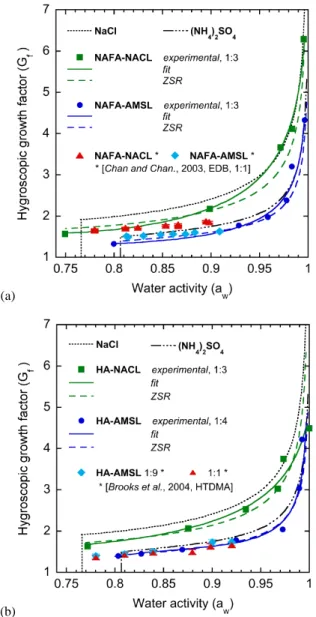
The effect of adding fulvic acid and humic acid on the hygroscopic growth of the inorganic salts is easier to dis-cern. At 25◦C, the water uptake curve obtained for each NAFA mixture was slightly smaller than that for the corre-sponding pure salt for most of theaw range tested, but
in-creased to match the salt at high aw values. As shown in
Fig. 7a, the hygroscopic growth curves for NAFA–NACL and NAFA–AMSL followed or were slightly below the ZSR pre-diction for each solution untilaw values of 0.90 and 0.98,
respectively. Above these values, the curves transitioned to match the hygroscopic growth of NaCl above aw=0.95
for NAFA–NACL, and of (NH4)2SO4above aw=0.98 for
NAFA–AMSL. For NAFA–NACL, the ZSR curve underpre-dicted the growth by as much as 13 % in the 0.90–0.995 range. This underestimate of the ZSR approach at highaw
indicates possible interactions between NAFA and the in-organic salt that resulted in additional water uptake beyond that of each individual component. Since the ZSR curves are based on the data from our previous study, which found a
Gfof 1 for NAFA belowaw=0.999, another possibility is
that our apparatus underestimated the hygroscopic growth of NAFA at highaw values. Two studies found modest
hy-groscopic growth for NAFA particles ataw=0.90: Gysel et
al. (2004) found aGfof 1.14 with a HTDMA, and Chan and
Fig. 5. Hygroscopic growth factor as a function of water activity for pure substances at 25◦C. Open symbols show the growth factors calculated from data measured by Zamora et al. (2011). Solid lines represent fits to the data based on the water activity parameteriza-tions presented in Table 1, while vertical dashed lines denote the deliquescenceawvalue. The deliquescence measured for NAFA or Fluka HA was aboveaw=0.999; therefore Gf=1 for these humic substances (HS) below this value.
Chan (2003) also measured the water uptake of mixed parti-cles of NAFA / sodium chloride and NAFA / ammonium sul-fate in a 1:1 mass ratio. Within experimental uncertainty, the hygroscopic growth curve for our 1:3 NAFA–NACL mixture agreed with the 1:1 mixture studied by Chan and Chan up toaw=0.85. Byaw=0.90, the growth factor for
our 1:3 mixture increased to be 17 % higher than the 1:1 mixture, probably due to a higher proportion of the more hygroscopic solute, sodium chloride. The growth factors re-ported by Chan and Chan for the 1:1 NAFA–AMSL mixture were 11 % higher than those we found for our 1:3 mixture at
aw=0.813, matching the growth factor for pure ammonium
sulfate. Above this value, the difference between the hygro-scopic growth curves for both mixtures decreased until they intercepted ataw=0.909. In general, the water uptake data
for both NAFA / inorganic salt mixtures obtained by Chan and Chan increased much more slowly than that for our mix-tures, reporting up to 17 % lower water uptake for NAFA– NACL but up to 11 % higher water uptake for NAFA–AMSL. Frosch et al. (2011) also measured the water uptake of a 1:1 NAFA–AMSL mixture, but using an osmometer. However, they reported data for the 6–12Gfrange atawvalues above
0.9985, which is outside of our maximum measured value of 0.9963.
Fig. 6. Hygroscopic growth factor as a function of water activity for the NAFA–LEVO mixture at 25◦C. Solid symbols show growth factors calculated from bulk solution measurements using Eq. (3). The solid line represents the fit to the data based on the water activ-ity parameterizations presented in Table 1. The dashed line denotes the hygroscopic growth factor as predicted by the ZSR method. The curve for pure levoglucosan (dotted line) is given for reference.
The hygroscopic growth curves of HA–NACL and HA– AMSL at 25◦C are presented in Fig. 7b. The water uptake obtained for each HA mixture was smaller than that for the corresponding pure salt in proportion to the mass added of the organic species. This suggests that humic acid did not contribute any hygroscopic growth, as expected from its pre-vious data as an individual solute. Thus, the curves agreed well with their respective ZSR predictions throughout the measured range. Within uncertainty, our data for HA–AMSL matched that obtained by Brooks et al. (2004) with the HT-DMA for the 1:9 and 1:1 Fluka HA/ammonium sulfate par-ticles in theawrange of 0.80 to 0.92, where the data overlap.
4.2.2 Fulvic acid with levoglucosan
(a)
(b)
Fig. 7. Hygroscopic growth factor as a function of water activity at 25◦C for the mixture of inorganic salts with (a) NAFA, and (b) HA. Solid symbols show growth factors calculated from bulk so-lution measurements using Eq. (3). Solid lines represent the fit to the data based on the water activity parameterizations presented in Table 1, while dashed lines denote the hygroscopic growth factor as predicted by the ZSR method. The curves for pure sodium chloride (dotted line) and ammonium sulfate (dotted-dashed line), including their deliquescence points (vertical lines), are given for reference. Published data for similar mixtures was included: (a) EDB measure-ments by Chan and Chan (2003) at 22.5–23.8◦C, and (b) HTDMA data by Brooks et al. (2004) at 30◦C.
were 5.0–6.7 % lower. Both mixtures behaved very simi-larly to pure solutions with equivalent mass percentage of levoglucosan, indicating that the saccharide had the largest influence by far on the water vapor pressure over the solu-tion. Unfortunately, the DRHs of these mixtures were not measured since solutions saturated in both solutes could not
Fig. 8. Hygroscopic growth factor as a function of water activity for NAFA and HA in MIXORG at 25◦C. Solid symbols show growth factors calculated from bulk solution measurements using Eq. (3). Solid lines represent the fit to the data based on the water activ-ity parameterizations presented in Table 1. Red solid circles show HTDMA data at 21–24◦C for Suwannee River fulvic acid (SRFA) in MIXORG from published work by Svenningsson et al. (2004). The dashed line denotes the prediction by the ZSR approach for MIXORG containing NAFA, HA or SRFA, based on no hygro-scopic growth observed for these HS belowawof 0.999 in Zamora et al. (2011).
be prepared. The large quantity of NAFA required to prepare these saturated solutions, given the high aqueous solubility of levoglucosan, was not available due to IHSS sample purchase limits. The water activity varied only slightly with tempera-ture in the 0–30◦C temperature range, with maximum vari-ations of 1.0 % for 2:1 NAFA–LEVO and 1.3 % for 1:3 NAFA–LEVO. Further measurements of the diluted solu-tions at 25◦C were only conducted on 1:3 NAFA–LEVO.
The solution molality versus water activity data for NAFA–LEVO was plotted and fitted with a 5th-degree poly-nomial to obtain its water activity parameterization. The cor-responding polynomial coefficients, R-squared values and valid ranges are listed in Table 1. Figure 4 shows a van’t Hoff factor of 0.90 for NAFA–LEVO, suggesting that this mixture behaves close to an ideal solution. The addition of fulvic acid slightly lowered the van’t Hoff factor of NAFA– LEVO, as compared to that of levoglucosan. A similar effect was observed on the mixtures of NAFA with the inorganic salts.
Fig. 9. Hygroscopic growth factor as a function of water activity for NAFA and HA in MIXBIO at 25◦C. Solid symbols show growth factors calculated from bulk solution measurements using Eq. (3). Solid lines represent the fit to the data based on the water activ-ity parameterizations presented in Table 1. Red solid circles show HTDMA data at 21–24◦C for Suwannee River fulvic acid (SRFA) in MIXBIO from published work by Svenningsson et al. (2004). The dashed line denotes the prediction by the ZSR approach for MIXORG containing NAFA, HA or SRFA, based on no hygro-scopic growth observed for these HS belowawof 0.999 in Zamora et al. (2011).
uptake curve for pure levoglucosan for comparison. The hy-groscopic growth curve of NAFA–LEVO matched the ZSR prediction up to aw=0.98, which predicted values up to
10 % lower than pure levoglucosan. At 0.986, the NAFA– LEVO curve intersected that of pure levoglucosan, which joins with the ZSR curve aboveaw=0.9933. The water
up-take curve of NAFA–LEVO shifted left by 0.002–0.004 wa-ter activity values above the point where it met the curve for pure levoglucosan, which is within our experiment un-certainty range of aw±0.005. In sum, the NAFA–LEVO
mixture presented growth factors up to 10 % lower than pure levoglucosan belowaw=0.98, as predicted by the ZSR
method. Above 0.98, it agreed well with pure levoglucosan and the ZSR approach within experimental error.
4.2.3 MIXORG
MIXORG is a mixture of three organic compounds: levoglu-cosan, succinic acid and one humic substance, in proportions representative of the organic portion of continental polluted aerosols (Fig. 1). Figure 2c and d show the water activity versus temperature, in the 0–30◦C range, for the most con-centrated solutions of MIXORG made. These figures also
show the curves for the saturated solutions of pure levoglu-cosan, succinic acid, and ammonium sulfate as reference. The MIXORG mixtures had a minimal effect on the water activity, as expected from 80 % of their mass being com-prised of two substances that had little or no effect on the water vapor pressure over their pure saturated solutions. Al-though these solutions were saturated with respect to fulvic and humic acid, respectively, saturated solutions with respect to all solutes could not be prepared due to the large quan-tities of solutes required by the high solubility of levoglu-cosan. Hence, the deliquescence relative humidity for these mixtures could not be determined. Within the temperature range studied, the maximum water activity variation with temperature was 5.4 % for NAFA–MIXORG and 2.2 % for HA–MIXORG.
Table 1 lists the polynomial coefficients, R-squared val-ues and valid ranges for the water activity parameterization fits for the MIXORG mixtures. The van’t Hoff factors ob-tained for NAFA–MIXORG and HA–MIXORG were 0.28 and 1.10, respectively (Fig. 4). Assuming our molar weight estimates for the humic substances are accurate, these values indicate that HA–MIXORG behaved almost ideally, while NAFA–MIXORG appeared to deviate substantially from ide-ality. It is worth noting that due to solubility issues with suc-cinic acid, the factor for NAFA–MIXORG incorporates con-siderably less data points than all other solutions presented and therefore is a not reliable indication of ideality or disso-ciation levels.
Figure 8 shows the hygroscopic growth factor obtained for NAFA–MIXORG and HA–MIXORG, as a function of wa-ter activity. The curve generated with the ZSR model is also shown. Only one ZSR curve was included because both so-lutions have individual components with identical water up-take. Both NAFA and HA presented no hygroscopic growth as pure solutes in our previous study, and thus Gf=1 for
all water activity values under 0.999. The curve for HA– MIXORG presented much higher hygroscopic growth than the ZSR approach predicted but increased at a lower rate, which led to the intersection of the curves ataw=0.99. This
underprediction of the ZSR method underaw=0.99 may
in-dicate that solute interactions are contributing additional hy-groscopic growth to that expected from its individual com-ponents. The water uptake curve for HA–MIXORG was ob-tained for a maximum solution concentration equivalent to a growth factor of 1.5, due to the solubility constraints on solu-tion preparasolu-tion mensolu-tioned above. The curve appears almost linear above this Gfvalue, consistent with the steeper
sec-tion of the typical hygroscopic growth curve at higheraw
val-ues. The NAFA–MIXORG mixture presented a growth factor 42 % smaller than HA–MIXORG, and 21 % smaller than the ZSR prediction ataw=0.99.
particles between 0.85 and 0.95aw, agreed well with these
data. Our ZSR curve for both MIXORG mixtures also applies for SRFA–MIXORG since we obtained no growth for satu-rated solutions of SRFA in our previous study (Zamora et al., 2011). It predicts the data from the Svenningsson study reasonably well with a maximum underestimation of 8.0 %. One of the reasons for using two of the same mixtures used in Svenningsson et al. (2006) was to be able to compare the wa-ter uptake of different humic substances in mixtures of identi-cal composition. Unfortunately, the hygroscopic growth data for the fulvic acid mixtures were not obtained in the same water activity range due to the limitations of HTDMA at higher RHs, and of our method to achieve higher concentra-tions in bulk soluconcentra-tions. However, the data for HA–MIXORG and SRFA–MIXORG overlapped for a small range of water activity, where HA–MIXORG had a 21.4 and 26.3 % higher growth factor atawof 0.960 and 0.975, respectively.
4.2.4 MIXBIO
The MIXBIO mixture is composed of ammonium sulfate, levoglucosan, succinic acid, and a humic substance in pro-portions representative of biomass burning aerosols (Fig. 1). Figure 2c and d show the water activity versus tempera-ture, for the most concentrated solutions of MIXBIO made, in the 0–30◦C range. As expected, the MIXBIO solutions had lower water activity curves than the MIXORG solu-tions containing the same humic substance due to the hy-groscopic effect of ammonium sulfate. However, due to the quantity of mass of NAFA and HA required to make the bulk solutions, saturated solutions with respect to all so-lutes in MIXBIO could not be prepared. Therefore, the max-imum effect on the vapor pressure and the deliquescence rel-ative humidity for these mixtures could not be determined. The greatest water activity variation with temperature, within the 0–30◦C range, was 2.0 and 1.5 % for NAFA–MIXBIO and HA–MIXBIO, respectively.
The polynomial coefficients, R-squared values and valid ranges for the water activity parameterization fits for both MIXBIO mixtures are reported on Table 1. Figure 4 shows a van’t Hoff factor of 1.18 for NAFA–MIXBIO, and of 1.43 for HA–MIXBIO. As stated above, the molar weight estimates for the humic substances will affect the van’t Hoff factor cal-culation. Still, if we assume the estimates used are correct, MIXBIO containing NAFA behaves more like an ideal so-lution than does HA, since the former’s van’t Hoff factor is closer to one. The opposite was found for the MIXORG mix-tures.
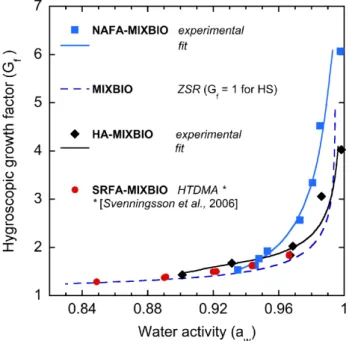
Figure 9 shows the hygroscopic growth factor obtained for NAFA–MIXBIO and HA–MIXBIO as a function of wa-ter activity. The ZSR model curve, also shown in Fig. 9, is applicable to NAFA–MIXBIO and HA–MIXBIO since their only difference is the addition of NAFA versus HA, both of which presented no hygroscopic growth as pure so-lutes (Gf=1 for all aw values). The hygroscopic growth
curve of HA–MIXBIO was 11–13 % higher than the ZSR prediction, although it followed its general trend and fol-lowed its curve aboveaw=0.99. NAFA–MIXBIO presented
a much higher hygroscopic growth, exceeding the ZSR pre-diction by 13 % and 48 % at aw=0.95 and 0.98,
respec-tively. Such a deviation from the ZSR method indicates interactions of NAFA with the other solution components that resulted in significant additional hygroscopic growth to that expected from the individual components. However, the data from the 1:3 NAFA / ammonium sulfate and 1:3 NAFA / levoglucosan systems did not suggest interactions among those solute pairs large enough to justify the growth observed in NAFA–MIXBIO. Since the NAFA–MIXORG mixture presented minimal water uptake, it seems likely that the additional water uptake above the ZSR calculation for NAFA–MIXBIO was caused by a multicomponent interac-tion between NAFA, ammonium sulfate and one or both of the remaining components: levoglucosan and succinic acid.
We have also included in Fig. 9 data collected by Sven-ningsson et al. (2006) with the HTDMA for the SRFA– MIXBIO mixture for comparison. These data were bounded on top by the ZSR curve shown in their study, which ac-counted for the small growth they observed for pure SRFA particles and for the limited solubility of succinic acid. Our ZSR curve for MIXBIO, which is also applicable for SRFA since we obtained no growth for its saturated solutions in our previous study, provides a lower bound for the data. Al-though Svenningsson et al. (2006) mentioned that the small overestimation resulted from taking into account the solu-bility of succinic acid, there may be alternative explanations. The over- and underestimation with our respective ZSR mod-els might indicate that the individual water uptake of SRFA in the MIXBIO mixture is slightly lower than expected from the HTDMA measurements but higher than expected from the bulk measurements of the pure solute. Another possibility is that interactions between SRFA and the other components are producing these small deviations from ZSR.
Since all three MIXBIO mixtures have identical composi-tion except for the identity of humic substance, we can com-pare their hygroscopic behavior directly. HA–MIXBIO and SRFA–MIXBIO shared the same hygroscopic growth fac-tor ataw=0.90, but HA–MIXBIO presented slightly higher
growth above that value. The water uptake data for the ful-vic acid mixtures overlapped briefly from 0.935 to 0.945aw,
but NAFA–MIXBIO showed a sharp increase in water uptake above this value, reaching a growth factor 22 % higher than the lastGfreported for SRFA–MIXBIO ataw=0.966.
5 Conclusions
from bulk water vapor pressure measurements of nine mix-tures of atmospheric relevance. These mixmix-tures consisted of two inorganic salts and four model compounds repre-senting different categories of water-soluble organic carbon (WSOC). The WSOC categories of neutral species and di-carboxylic acids were represented by levoglucosan and suc-cinic acid, respectively. HULIS was represented by two hu-mic substances (HSs): Nordic aquatic fulvic acid and Fluka humic acid. We calculated the hygroscopic growth factor as a function of water activity at 25◦C for each mixture, and com-pared it to the ZSR model prediction, and to the few relevant published studies available.
We investigated the effect of HULIS on the water up-take of three different hygroscopic solutes (sodium chlo-ride, ammonium sulfate, and levoglucosan), using five two-component solutions. Within the 0–30◦C range, the water vapor pressures over each of these mixtures were governed by the hygroscopic compound. Below 95 % RH, the addi-tion of NA fulvic acid or humic acid to each of these highly water-soluble solutes lowered their hygroscopic growth, in proportion to the added mass of HS. Yet, only the hygro-scopic growth of the mixtures containing fulvic acid transi-tioned to match the growth of the pure salt or saccharide at higher RHs values.
We also examined the hygroscopic behavior of these two HSs in mixtures based on recent aerosol characterization ex-periments of biomass burning (MIXBIO) and of the organic portion of the polluted continental (MIXORG) aerosols. We compared our results with the hygroscopic growth of Suwan-nee River fulvic acid in the same mixtures, measured by Svenningsson et al. (2004) with the HTDMA. MIXORG exhibited higher hygroscopic growth when containing hu-mic acid than when containing Suwannee River or Nordic aquatic fulvic acids. Conversely, MIXBIO showed a much higher water uptake with solute Nordic aquatic fulvic acid as compared to solutes humic acid or Suwannee River ful-vic acid. Each of these three humic substances affected the hygroscopic growth of mixtures differently, despite two be-ing fulvic acids frequently used as model compounds for HULIS. Above 95 % RH, the relative water uptake of iden-tical mixtures containing different HSs varied significantly among the mixtures studied and could not be predicted by the hygroscopic growth of the pure HS, suggesting inter-actions among components. This is consistent with find-ings from Brooks et al. (2004) and Chan and Chan (2003), which found differences in the hygroscopic behavior of iden-tical mixtures containing two different humic acids and two fulvic acids, respectively.
We obtained van’t Hoff factors for all the mixtures stud-ied, and for the pure substances for which there was suffi-cient data range. As expected from their low disassociation, all mixtures comprised entirely of organic solutes had a van’t Hoff factor near 1 except for NAFA–MIXORG. The addi-tion of NAFA to mixtures resulted in lower van’t Hoff factors than their pure components, assuming that succinic acid had
a van’t Hoff factor near 1. No such pattern was evident for HA mixtures.
We explored the effect of temperature in the 0–30◦C range on water activity for our nine mixtures. In our previous study, we found that the temperature had a small influence on water activity measurements in the same range, with a maximum variation of 11 % for the substances included in this work (Zamora et al., 2011). In the present work, the largest water activity variation with temperature observed in the 0–30◦C range for the mixtures studied was 9 %. Further analysis on the data for room temperature (20–30◦C), the range at which most water uptake measurements are collected, yielded a maximum variation of only 2 %. This variation is within the uncertainty range for the water activity (or RH) of several published studies. Thus, measurements obtained within the room temperature range of 20–30◦C may be compared di-rectly with more confidence.
Finally, we assessed the ability of the ZSR model to pre-dict the hygroscopic growth of the nine mixtures studied. The ZSR worked reasonably well for six of the nine mix-tures: three NAFA mixtures (NAFA–LEVO, NAFA–AMSL, NAFA–MIXORG) and three HA mixtures (HA–NACL, HA– AMSL, HA–MIXBIO). In general, the ZSR method pre-dicted the hygroscopic behavior of all the mixtures studied in this work within 12 % at or underaw=0.95 but considerably
underestimated the growth of two multicomponent mixtures at very highawvalues.
Overall, we have shown that the effect of humic substances on the hygroscopic behavior of atmospheric aerosols can vary widely depending on the identity and origin of the hu-mic substance. We confirmed evidence from previous studies that the ZSR method works well for two-component mixtures containing an organic and an inorganic solute and extended this assertion toaw values above 0.95, where it has rarely
been tested. We have also demonstrated that the ZSR ap-proach works reasonably well for the multicomponent mix-tures studied underaw=0.95, but can produce large
with humic substances can still provide insight into the be-havior or multicomponent mixtures in atmospheric aerosols.
Acknowledgements. We gratefully acknowledge the School of Earth Sciences at Stanford University and the atmospheric chem-istry division of the National Science Foundation for support. We would also like to thank D. M. Golden and L. M. Hildemann for helpful discussions.
Edited by: D. Topping
References
Alfarra, M. R., Paulsen, D., Gysel, M., Garforth, A. A., Dommen, J., Pr´evˆot, A. S. H., Worsnop, D. R., Baltensperger, U., and Coe, H.: A mass spectrometric study of secondary organic aerosols formed from the photooxidation of anthropogenic and biogenic precursors in a reaction chamber, Atmos. Chem. Phys., 6, 5279– 5293, doi:10.5194/acp-6-5279-2006, 2006.
Alshawa, A., Dopfer, O., Harmon, C. W., Nizkorodov, S. A., and Underwood, J. S.: Hygroscopic growth and deliquescence of NaCl nanoparticles coated with surfactant AOT, J. Phys. Chem. A, 113, 7678–7686, doi:10.1021/jp809869r, 2009.
Andreae, M. O. and Crutzen, P. J.: Atmospheric aerosols: Biogeo-chemical sources and role in atmospheric chemistry, Science, 276, 1052–1058, doi:10.1126/science.276.5315.1052, 1997. Artaxo, P., Storms, H., Bruynseels, F., Vangrieken, R., and
Maenhaut, W.: Composition and sources of aerosols from the Amazon basin, J. Geophys. Res.-Atmos., 93, D2, doi:10.1029/JD093iD02p01605, 1988.
Artaxo, P., Maenhaut, W., Storms, H., and Vangrieken, R.: Aerosol characteristics and sources for the amazon basin dur-ing the wet season, J. Geophys. Res.-Atmos., 95, 1697–16985, doi:10.1029/JD095iD10p16971, 1990.
Artaxo, P., Martins, J. V., Yamasoe, M. A., Procopio, A. S., Pauliquevis, T. M., Andreae, M. O., Guyon, P., Gatti, L. V., and Leal, A. M. C.: Physical and chemical properties of aerosols in the wet and dry seasons in Rondonia, Amazo-nia, J. Geophys. Res.-Atmos., 107, LBA 49-1–LBA 49-14, doi:10.1029/2001jd000666, 2002.
Averett, R. C., Leenheer, J. A., McKnight, D. M., and Thorn, K. A.: Humic substances in the Suwannee River, Georgia: interac-tions, properties, and proposed structures, Open-File Report-US Geological Survey, 1989.
Badger, C. L., George, I., Griffiths, P. T., Braban, C. F., Cox, R. A., and Abbatt, J. P. D.: Phase transitions and hygroscopic growth of aerosol particles containing humic acid and mixtures of humic acid and ammonium sulphate, Atmos. Chem. Phys., 6, 755–768, doi:10.5194/acp-6-755-2006, 2006.
Bond, T. C., Streets, D. G., Yarber, K. F., Nelson, S. M., Woo, J. H., and Klimont, Z.: A technology-based global inventory of black and organic carbon emissions from combustion, J. Geo-phys. Res.-Atmos., 109, D14, doi:10.1029/2003jd003697, 2004. Brooks, S.: Deliquescence behavior of organic/ammonium sulfate aerosol, Geophys. Res. Lett., 29, 23-1–23-4, doi:10.1029/2002gl014733, 2002.
Brooks, S.: Water uptake by particles containing humic materials and mixtures of humic materials with ammonium sulfate, Atmos.
Environ., 38, 1859–1868, doi:10.1016/j.atmosenv.2004.01.009, 2004.
Chan, M. N. and Chan, C. K.: Hygroscopic properties of two model humic-like substances and their mixtures with inorganics of at-mospheric importance, Environ, Science Technol., 37, 5109– 5115, doi:10.1021/es034272o, 2003.
Chan, M. N., Choi, M., Ng, N., and Chan, C.: Hygroscopicity of water-soluble organic compounds in atmospheric aerosols: amino acids and biomass burning derived organic species, En-viron. Science Technol., 39, 1555–1562, doi:10.1021/es049584l, 2005.
Chebbi, A. and Carlier, P.: Carboxylic acids in the troposphere, occurrence, sources, and sinks: A review, Atmos. Environ., 30, 4233–4249, doi:10.1016/1352-2310(96)00102-1, 1996. Choi, M. Y. and Chan, C. K.: The effects of organic species on
the hygroscopic behaviors of inorganic aerosols, Environmental Science & Technology, 36, 2422–2428, doi:10.1021/es0113293, 2002a.
Choi, M. Y. and Chan, C. K.: Continuous measurements of the water activities of aqueous droplets of water-soluble organic compounds, J. Phys. Chem. A, 106, 4566–4572, doi:10.1021/jp013875o, 2002b.
Clegg, S. L., Brimblecombe, P., and Wexler, A. S.: Thermodynamic model of the system H-NH-Na-SO42–NO3–Cl–H2O at 298.15 K, J. Phys. Chem. A, 102, 2155–2171, doi:10.1021/jp973043j, 1998.
Cruz, C. N. and Pandis, S. N.: Deliquescence and hygroscopic growth of mixed inorganic-organic atmospheric aerosol, Envi-ron. Science Technol., 34, 4313–4319, doi:10.1021/es9907109, 2000.
Decesari, S., Facchini, M. C., Matta, E., Lettini, F., Mircea, M., Fuzzi, S., Tagliavini, E., and Putaud, J. P.: Chemical features and seasonal variation of fine aerosol water-soluble organic com-pounds in the Po Valley, Italy, Atmos. Environ., 35, 3691–3699, doi:10.1016/s1352-2310(00)00509-4, 2001.
Decesari, S., Facchini, M. C., Fuzzi, S., McFiggans, G., Coe, H., and Bower, K.: The water-soluble organic component of size-segregated aerosol, cloud water and wet depositions from Jeju Island during ACE-Asia, Atmos. Environ., 39, 211–222, doi:10.1016/j.atmosenv.2004.09.049, 2005.
Dinar, E., Taraniuk, I., Graber, E. R., Anttila, T., Mentel, T. F., and Rudich, Y.: Hygroscopic growth of atmospheric and model humic-like substances, J. Geophys. Res.-Atmos., 112, 13, doi:D0521110.1029/2006jd0074-42, 2007.
Duarte, R., Pio, C. A., and Duarte, A. C.: Spectroscopic study of the water-soluble organic matter isolated from atmospheric aerosols collected under different atmospheric conditions, An-alytica Chimica Acta, 530, 7–14, doi:10.1016/j.aca.2004.08.049, 2005.
Facchini, M. C., Fuzzi, S., Zappoli, S., Andracchio, A., Gelencser, A., Kiss, G., Krivacsy, Z., Meszaros, E., Hansson, H. C., Als-berg, T., and Zebuhr, Y.: Partitioning of the organic aerosol com-ponent between fog droplets and interstitial air, J. Geophys. Res.-Atmos., 104, 26821–26832, doi:10.1029/1999jd900349, 1999. Frosch, M., Prisle, N. L., Bilde, M., Varga, Z., and Kiss, G.: Joint
Fuzzi, S., Decesari, S, Facchini, M. C., Matta, E., Mircea, M., and Tagliavini E.: A simplified model of the water soluble organic component of atmospheric aerosols, Geophys. Res. Lett., 28, doi:10.1029/2001gl013418, 2001.
Gelencser, A., Meszaros, T., Blazso, M., Kiss, G., Krivacsy, Z., Molnar, A., and Meszaros, E.: Structural characterisation of organic matter in fine tropospheric aerosol by pyrolysis-gas chromatography-mass spectrometry, J. Atmos. Chem., 37, 173– 183, doi:10.1023/a:1006402731340, 2000.
Gerber, H. E., Hoppel, W. A., and Wojciechowski, T. A.: experimental-verification of theoretical relationship between size and critical supersaturation of salt nu-clei, J. Atmos. Sci., 34, 1836–1841, doi:10.1175/1520-0469(1977)034<1836:evottr>2.0.co;2, 1977.
Gysel, M., Weingartner, E., Nyeki, S., Paulsen, D., Baltensperger, U., Galambos, I., and Kiss, G.: Hygroscopic properties of water-soluble matter and humic-like organics in atmospheric fine aerosol, Atmos. Chem. Phys., 4, 35–50, doi:10.5194/acp-4-35-2004, 2004.
Hallquist, M., Wenger, J. C., Baltensperger, U., Rudich, Y., Simp-son, D., Claeys, M., Dommen, J., Donahue, N. M., George, C., Goldstein, A. H., Hamilton, J. F., Herrmann, H., Hoff-mann, T., Iinuma, Y., Jang, M., Jenkin, M. E., Jimenez, J. L., Kiendler-Scharr, A., Maenhaut, W., McFiggans, G., Mentel, Th. F., Monod, A., Pr´evˆot, A. S. H., Seinfeld, J. H., Surratt, J. D., Szmigielski, R., and Wildt, J.: The formation, properties and im-pact of secondary organic aerosol: current and emerging issues, Atmos. Chem. Phys., 9, 5155–5236, doi:10.5194/acp-9-5155-2009, 2009.
H¨ameri, K., Charlson, R., and Hansson, H. C.: Hygroscopic proper-ties of mixed ammonium sulfate and carboxylic acids particles, AIChE Journal, 48, 1309–1316, doi:10.1002/aic.690480617, 2002.
Havers, N., Burba, P., Lambert, J., and Klockow, D.: Spec-troscopic characterization of humic-like substances in air-borne particulate matter, J. Atmos. Chem., 29, 45–54, doi:10.1023/a:1005875225800, 1998.
Hegde, P. and Kawamura, K.: Seasonal variations of water-soluble organic carbon, dicarboxylic acids, ketocarboxylic acids, andα -dicarbonyls in Central Himalayan aerosols, Atmos. Chem. Phys., 12, 6645–6665, doi:10.5194/acp-12-6645-2012, 2012.
Intergovernmental Panel on Climate Change (IPCC): Climate Change 2007: The Physical Science Basis: Working Group I Contribution to the Fourth Assessment Report of the IPCC, edited by: Solomon, S., Qin, D., Manning, M., Chen, Z., Mar-quis, M., Averyt, K. B, Tignor M., and Mille H. L., Cambridge Univ. Press, New York, 2007.
Jimenez, J. L., Canagaratna, M. R., Donahue, N. M., Prevot, A. S. H., Zhang, Q., Kroll, J. H., DeCarlo, P. F., Allan, J. D., Coe, H., Ng, N. L., Aiken, A. C., Docherty, K. S., Ulbrich, I. M., Grieshop, A. P., Robinson, A. L., Duplissy, J., Smith, J. D., Wilson, K. R., Lanz, V. A., Hueglin, C., Sun, Y. L., Tian, J., Laaksonen, A., Raatikainen, T., Rautiainen, J., Vaattovaara, P., Ehn, M., Kulmala, M., Tomlinson, J. M., Collins, D. R., Cu-bison, M. J., Dunlea, E. J., Huffman, J. A., Onasch, T. B., Al-farra, M. R., Williams, P. I., Bower, K., Kondo, Y., Schnei-der, J., Drewnick, F., Borrmann, S., Weimer, S., Demerjian, K., Salcedo, D., Cottrell, L., Griffin, R., Takami, A., Miyoshi, T., Hatakeyama, S., Shimono, A., Sun, J. Y., Zhang, Y. M., Dzepina,
K., Kimmel, J. R., Sueper, D., Jayne, J. T., Herndon, S. C., Trim-born, A. M., Williams, L. R., Wood, E. C., Middlebrook, A. M., Kolb, C. E., Baltensperger, U., and Worsnop, D. R.: Evolution of organic aerosols in the atmosphere, Science, 326, 1525–1529, doi:10.1126/science.1180353, 2009.
Jung, J., Tsatsral, B., Kim, Y. J., and Kawamura, K.: Organic and inorganic aerosol compositions in Ulaanbaatar, Mongolia, dur-ing the cold winter of 2007 to 2008: Dicarboxylic acids, ketocar-boxylic acids, and alpha-dicarbonyls, J. Geophys. Res.-Atmos., 115, D22, doi:10.1029/2010jd014339, 2010.
Kanakidou, M., Seinfeld, J. H., Pandis, S. N., Barnes, I., Dentener, F. J., Facchini, M. C., Van Dingenen, R., Ervens, B., Nenes, A., Nielsen, C. J., Swietlicki, E., Putaud, J. P., Balkanski, Y., Fuzzi, S., Horth, J., Moortgat, G. K., Winterhalter, R., Myhre, C. E. L., Tsigaridis, K., Vignati, E., Stephanou, E. G., and Wilson, J.: Organic aerosol and global climate modelling: a review, At-mos. Chem. Phys., 5, 1053–1123, doi:10.5194/acp-5-1053-2005, 2005.
Kawamura, K., Steinberg, S., Ng, L., and Kaplan, I. R.: Wet deposition of low molecular weight mono- and di-carboxylic acids, aldehydes and inorganic species in Los Angeles, Atmos. Environ., 35, 3917–3926, doi:10.1016/s1352-2310(01)00207-2, 2001a.
Kawamura, K., Yokoyama, K., Fujii, Y., and Watanabe, O.: A Greenland ice core record of low molecular weight dicarboxylic acids, ketocarboxylic acids, and alpha-dicarbonyls: A trend from Little Ice Age to the present (1540–1989 AD), J. Geophys. Res.-Atmos., 106, 1331–1345, doi:10.1029/2000jd900465, 2001b. Kerminen, V. M., Ojanen, C., Pakkanen, T., Hillamo, R., Aurela,
M., and Merilainen, J.: Low-molecular-weight dicarboxylic acids in an urban and rural atmosphere, J. Aerosol Sci., 31, 349–362, doi:10.1016/s0021-8502(99)00063-4, 2000.
Krivacsy, Z., Kiss, G., Varga, B., Galambos, I., Sarvari, Z., Ge-lencser, A., Molnar, A., Fuzzi, S., Facchini, M. C., Zappoli, S., Andracchio, A., Alsberg, T., Hansson, H. C., and Persson, L.: Study of humic-like substances in fog and interstitial aerosol by size-exclusion chromatography and capillary electrophore-sis, Atmos. Environ., 34, 4273–4281, doi:10.1016/s1352-2310(00)00211-9, 2000.
Lightstone, J. M., Onasch, T. B., Imre, D., and Oatis, S.: Deliques-cence, effloresDeliques-cence, and water activity in ammonium nitrate and mixed ammonium nitrate/succinic acid microparticles, J. Phys. Chem. A, 104, 9337–9346, doi:10.1021/jp002137h, 2000. Low, R. D. H.: A comprehensive report on nineteen
condensa-tion nuclei. I. equilibrium growth and physical properties, White Sands Missile Range, NM, USA, 551 pp., 1969.
Mader, B. T., Yu, J. Z., Xu, J. H., Li, Q. F., Wu, W. S., Fla-gan, R. C., and Seinfeld, J. H.: Molecular composition of the water-soluble fraction of atmospheric carbonaceous aerosols col-lected during ACE-Asia, J. Geophys. Rese.-Atmos., 109, D6, doi:10.1029/2003jd004105, 2004.
Marcolli, C., Luo, B., and Peter, T.: Mixing of the organic aerosol fractions: liquids as the thermodynamically stable phases, J. Phys. Chem., 108, 2216–2224, 2004.
frac-tion, J. Geophys. Res.-Atmos., 107, LBA 59-1–LBA 59-15 , doi:10.1029/2001jd000522, 2002.
Meyer, N. K., Duplissy, J., Gysel, M., Metzger, A., Dommen, J., Weingartner, E., Alfarra, M. R., Prevot, A. S. H., Fletcher, C., Good, N., McFiggans, G., Jonsson, ˚A. M., Hallquist, M., Bal-tensperger, U., and Ristovski, Z. D.: Analysis of the hygro-scopic and volatile properties of ammonium sulphate seeded and unseeded SOA particles, Atmos. Chem. Phys., 9, 721–732, doi:10.5194/acp-9-721-2009, 2009.
Mochida, M. and Kawamura, K.: Hygroscopic properties of lev-oglucosan and related organic compounds characteristic to biomass burning aerosol particles, J. Geophys. Res.-Atmos., 109, D21, doi:10.1029/2004jd004962, 2004.
Moore, R. H. and Raymond, T. M.: HTDMA analysis of multicomponent dicarboxylic acid aerosols with comparison to UNIFAC and ZSR, J. Geophys. Res.-Atmos., 113, D4, doi:10.1029/2007jd008660, 2008.
Mukai, H. and Ambe, Y.: Characterization of a humic acid-like brown substance in airborne particulate matter and tenta-tive identification of its origin, Atmos. Environ., 20, 813–819, doi:10.1016/0004-6981(86)90265-9, 1986.
Narukawa, M., Kawamura, K., Li, S. M., and Bottenheim, J. W.: Dicarboxylic acids in the Arctic aerosols and snowpacks col-lected during ALERT 2000, Atmos. Environ., 36, 2491–2499, doi:10.1016/s1352-2310(02)00126-7, 2002.
Pandis, S. N., Wexler, A. S., and Seinfeld, J. H.: Dynam-ics of tropospheric aerosols, J. Phys. Chem., 99, 9646–9659, doi:10.1021/j100024a003, 1995.
Peng, C., Chan, M., and Chan, C.: The hygroscopic properties of dicarboxylic and multifunctional acids: measurements and UNIFAC predictions, Environ. Sci. Technol., 35, 4495–4501, doi:10.1021/es0107531, 2001.
P¨oschl, U.: Atmospheric aerosols: Composition, transformation, climate and health effects, Angewandte Chemie-International Edition, 44, 7520–7541, doi:10.1002/anie.200501122, 2005. Prenni, A.: Water uptake of internally mixed particles containing
ammonium sulfate and dicarboxylic acids, Atmos. Environ., 37, 4243–4251, doi:10.1016/s1352-2310(03)00559-4, 2003. Pruppacher, H. R. and Klett, J. D.: Microphysics of Clouds and
Pre-cipitation, 2nd Ed., Springer Publications, New York, USA 1997. Putaud, J. P., Raes, F., Van Dingenen, R., Bruggemann, E., Fac-chini, M. C., Decesari, S., Fuzzi, S., Gehrig, R., Huglin, C., Laj, P., Lorbeer, G., Maenhaut, W., Mihalopoulos, N., Mulller, K., Querol, X., Rodriguez, S., Schneider, J., Spindler, G., ten Brink, H., Torseth, K., and Wiedensohler, A.: European aerosol phenomenology-2: chemical characteristics of particulate matter at kerbside, urban, rural and background sites in Europe, Atmos. Environ., 38, 2579–2595, doi:10.1016/j.atmosenv.2004.01.041, 2004.
Roberts, G. C., Andreae, M. O., Maenhaut, W., and Fernandez-Jimenez, M. T.: Composition and sources of aerosol in a cen-tral African rain forest during the dry season, J. Geophys. Res.-Atmos., 106, 14423–14434, doi:10.1029/2000jd900774, 2001. Rogers, R. R. and Yau, M. K.: A short course in cloud physics,
3rd Edn., Butterworth-Heinemann Publications, Massachusetts, USA, 1989.
Rogge, W. F., Mazurek, M. A., Hildemann, L. M., Cass, G. R., and Simoneit, B. R. T.: Quantification of urban organic aerosols at a molecular-level – identification, abundance and
seasonal-variation, Atmos. Environ. Pt. A, 27, 1309–1330, doi:10.1016/0960-1686(93)90257-y, 1993.
Saxena, P. and Hildemann, L. M.: Water-soluble organics in atmo-spheric particles: A critical review of the literature and applica-tion, J. Atmos. Chem., 24, 57–109, doi:10.1029/2003jd003775, 1996.
Simoneit, B. R. T., Schauer, J. J., Nolte, C. G., Oros, D. R., Elias, V. O., Fraser, M. P., Rogge, W. F., and Cass, G. R.: Levoglu-cosan, a tracer for cellulose in biomass burning and atmospheric particles, Atmos. Environ., 33, 173–182, doi:10.1016/s1352-2310(98)00145-9, 1999.
Sjogren, S., Gysel, M., Weingartner, E., Baltensperger, U., Cubi-son, M. J., Coe, H., Zardini, A. A., Marcolli, C., Krieger, U. K., and Peter, T.: Hygroscopic growth and water uptake kinetics of two-phase aerosol particles consisting of ammonium sulfate, adipic and humic acid mixtures, J. Aerosol Sci., 38, 157–171, doi:10.1016/j.jaerosci.2006.11.005, 2007.
Sloane, C. S. and Wolff, G. T.: Prediction of ambient light-scattering using a physical model responsive to relative-humidity – valida-tion with measurements from Detroit, Atmos. Environ., 19, 669– 680, doi:10.1016/0004-6981(85)90046-0, 1985.
Stokes, R. H. and Robinson, R. A.: Interactions in aqueous nonelec-trolyte solutions, I. solute-solvent equilibria, J. Phys. Chem., 70, 2126–2131, doi:10.1021/j100879a010, 1966.
Svenningsson, B., Rissler, J., Swietlicki, E., Mircea, M., Bilde, M., Facchini, M. C., Decesari, S., Fuzzi, S., Zhou, J., Mønster, J., and Rosenørn, T.: Hygroscopic growth and critical supersaturations for mixed aerosol particles of inorganic and organic compounds of atmospheric relevance, Atmos. Chem. Phys., 6, 1937–1952, doi:10.5194/acp-6-1937-2006, 2006.
Talbot, R. W., Andreae, M. O., Andreae, T. W., and Harriss, R. C.: Regional aerosol chemistry of the Amazon basin dur-ing the dry season, J. Geophys. Res.-Atmos., 93, 1499–1508, doi:10.1029/JD093iD02p01499, 1988.
Talbot, R. W., Andreae, M. O., Berresheim, H., Artaxo, P., Garstang, M., Harriss, R. C., Beecher, K. M., and Li, S. M.: Aerosol chem-istry during the wet season in central Amazonia – the influence of long-range transport, J. Geophys. Res.-Atmos., 95, 16955– 16969, doi:10.1029/JD095iD10p16955, 1990.
Tang, I. N. and Munkelwitz, H. R.: Composition and temperature-dependence of the deliquescence properties of hygroscopic aerosols, Atmos. Environ. Pt. A, 27, 467–473, doi:10.1016/0960-1686(93)90204-c, 1993.
Wise, M., Surratt, J. D., Curtis, D. B., Shilling, J. E., and Tolbert, M. A.: Hygroscopic growth of ammonium sulfate/dicarboxylic acids, J. Geophys. Res., 108, D20, doi:10.1029/2003jd003775, 2003.
Wu, Z. J., Nowak, A., Poulain, L., Herrmann, H., and Wieden-sohler, A.: Hygroscopic behavior of atmospherically relevant water-soluble carboxylic salts and their influence on the water uptake of ammonium sulfate, Atmos. Chem. Phys., 11, 12617– 12626, doi:10.5194/acp-11-12617-2011, 2011.
Zamora, I. R., Tabazadeh, A., Golden, D. M., and Jacobson, M. Z.: Hygroscopic growth of common organic aerosol so-lutes, including humic substances, as derived from water activity measurements, J. Geophys. Res.-Atmos., 116, D23, doi:10.1029/2011jd016067, 2011.
C., Rosman, K., and Zebuhr, Y.: Inorganic, organic and macro-molecular components of fine aerosol in different areas of Europe in relation to their water solubility, Atmos. Environ., 33, 2733– 2743, doi:10.1016/s1352-2310(98)00362-8, 1999.