A
r
t
ic
le
*e-mail: [email protected]
Analysis of Polynuclear Aromatic Hydrocarbons by SPME-GC-FID in
Environmental and Tap Waters
Emanuel Coelho,a Célia Ferreiraa and Cristina M. M. Almeida*,b,c
aLaboratório de Águas do Litoral Alentejano, Rua General Humberto Delgado, 7520-160 Sines, Portugal
bLaboratório de Hidrologia e Análises Hidrológicas,Faculdade de Farmácia da Universidade de Lisboa, Av. das Forças Armadas, 1600-083 Lisboa, Portugal
ciMed, The Institute for Medicines and Pharmaceutical Sciences, Faculdade de Farmácia da Universidade de Lisboa, Av. Prof. Gama Pinto, 1649-003 Lisboa, Portugal
Desenvolvimento e validação de um método de micro-extração em fase sólida acoplado à cromatografia gasosa com detector de ionização de chama (SPME-GC-FID) para a monitorização de dezesseis PAHs definidos como poluentes em amostras de água pela US EPA. As melhores condições de extração foram obtidas utilizando uma fibra de PDMS 30 µm, extração direta a 60 ºC durante 30 min sob agitação (1500 rpm) e com 10% de NaCl. O método mostrou ter uma boa linearidade (R2 > 0,99), repetibilidade e recuperação (> 71%). Os limites de detecção estão compreendidos entre 0,06 e 0,5 µg L-1. Foram efectuados outros estudos, tais como, de estabilidade, análises repetidas sobre a mesma amostra, precisão intermédia e influência da concentração do cloro residual na recuperação dos PAHs. O método foi aplicado a várias amostras de água, incluindo água de consumo humano e águas ambientais (subterrâneas, superficiais e água da chuva).
A procedure based on solid phase microextraction (SPME) and gas chromatography with flame ionization detection (GC-FID) was developed and validated in order to determine the sixteen US EPA PAH (polynuclear aromatic hydrocarbons) compounds in water samples. The best analytical conditions were obtained using PDMS 30 µm fibre by direct immersion at 60 ºC, 30 min, 1500 rpm and 10% NaCl. The method showed good linearity (R2 > 0.99), repeatability (< 10%) and recovery (> 71%). The detection limits were between 0.06 and 0.50 µg L-1. Other studies were also carried out, such as stability studies, repeated analysis on the same sample, intermediate precision and the influence of chlorine concentration in the recovery of the PAHs. This method was applied to several matrices, including tap water and real environmental samples (surface and underground water and rainwater).
Keywords: SPME, water analysis, polynuclear aromatic hydrocarbons, PAH, GC-FID
Introduction
Water pollution by organic compounds has caused increasing and worldwide concern. Among such compounds, polynuclear aromatic hydrocarbons have received considerable attention because of their documented
carcinogenity in experimental animals.1 These compounds
are potentially toxic and therefore their presence should be monitored both in environmental water and water for human consumption.
Polynuclear aromatic hydrocarbons are a large group of compounds with a molecular structure that includes two or
more fused aromatic rings. They are widely distributed in the environment as a result of the incomplete combustion
of organic material, from both natural (e.g. forest fires and
volcanic eruptions) and anthropogenic sources (e.g. motor
vehicles, industrial processes, domestic heating, waste
incineration, and tobacco smoke).1-3 Also the spillage of
fossil fuel can be a significant source of contamination,1-3
as well as the leaching from pipes, coating, linings and joint
adhesives during water distribution (supply).1-4
PAHs are frequently associated to an increase of
incidence of several types of cancer.2,4 Because of their
PAHs can be absorbed by skin, ingestion or inhalation,
being quickly distributed into the organism.2
Monitoring these compounds in environmental samples is an important step for the exposure control. On the basis of their frequency of occurrence in the environment and their proved mutagenicity and carcinogenicity, sixteen PAHs have been selected by the US EPA (“United States
Environmental Protection Agency) as priority pollutants.5
The World Health Organization (WHO) defined a guideline
value of 0.7 µg L-1 for benzo(a)pyrene. In Europe, the
Council Directive 98/83/EC demands that the sum of the concentrations of 4 PAHs (benzo(b)fluoranthene, benzo(k) fluoranthene, benzo(ghi)perylene and indene(1,2,3-cd)
pyrene) in drinking water can not exceed 0.1 µg L-1. It also
states that the concentration of benzo(a)pyrene can not be
greater than 0.01 µg L-1.6
Figure 1 shows the structures of sixteen PAHs selected by EPA and studied in this work.
Currently screening of semivolatile organic compounds in environmental water matrices, require a preconcentration
step, usually liquid-liquid extraction (LLE)or solid-phase
extraction (SPE) before chromatographic methods.7,8 In
both cases analytes are extracted from the aqueous phase and dissolved into an organic solvent. This solvent is then evaporated to a small volume to concentrate the analytes and lower the detection limits. The evaporation of solvent can be eliminated when a PTV inlet is used and the large
volume injection (LVI) technique is applied.9 LLE is a
very useful technique, but it is laborious, time consuming and requires large amounts of frequently toxic organic solvents. SPE is a less time consuming technique, being easily automated, but it still requires the use of toxic solvents for the elution step, and it can be expensive since the cartridges are discarded after one extraction. Both procedures of extraction can lead to errors of contamination or spillage and on the other hand they often produce even more toxic waste.
A very successful new approach to sample preparation is solid-phase microextraction (SPME) developed by
the Pawliszyn’s group in the early 90’s.10-12 The SPME
Figure 1. Structures of the sixteen PAH studied in this work. The five structures in the small box are the compounds listed in the European Council Directive
technique can be routinely used in combination with gas chromatography, high-performance liquid chromatography and capillary electrophoresis and places no restriction on MS. SPME reduces the time necessary for sample preparation, decrease purchase and disposal costs of solvents and can improve detection limits. This technique has been applied to the extraction of many volatile and semivolatile organic compounds from water, such as
pesticides,13-17 polychlorinated byphenyls,18 BTEX and
other substituted benzenes,19,20 triazines,8 phthalates,21
trihalomethanes22,23 and PAHs.3, 24-29
Probably the most important feature determining the analytical performance of SPME is the type and thickness of the coating material. Other important characteristic of the fibre coatings is the porosity. Less polar coatings such as PDMS and PDMS/DVB are considered to be more suitable for the analysis of non-polar compounds (such as PAHs), whereas more polar fibre coatings such as polyacrilate are considered to be more suited for polar analytes. However, the selection of a fibre according to the physicochemical parameters of the compounds is not always straightforward. Sample agitation, sampling type (immersion or headspace), salting out and extraction temperature are also important
parameters.30
There are two main types of SPME sampling: immersion sampling, where the fibre is immersed into the aqueous phase, and headspace sampling, where the fibre is exposed to the headspace above the sample. The choice depends mainly on the polarity and volatility of the analytes. Immersion sampling is widespread in the SPME approach, but for volatile compounds and dirty samples, the headspace mode is preferred as it results in faster equilibration times and higher selectivity. For analysis of PAHs in water matrices, both sampling methods have been previously investigated. It was found that headspace SPME extracted efficiently only the low molecular weight
PAHs (even when elevated temperatures were applied, i.e.
80 ºC), whereas immersion SPME resulted in the detection
of all PAHs.3,27
The aim of this work was the optimization of a solid phase microextraction procedure and quantification by gas chromatography with flame ionization detection (SPME-GC-FID) for the determination of sixteen polynuclear aromatic hydrocarbons in water samples.
The chromatographic conditions were optimised and validated for the analysis of these compounds and were
presented in a previous report.31 The optimization of the
SPME procedure included: fibre coating, desorption time and temperature, extraction time, stirring and ionic strength of the sample (“salting-out” effect). The SPME-GC-FID method was applied to the analysis of several kinds of water
samples: tap water, surface water, underground water and rainwater.
Experimental
Instrumentation
The chromatographic analysis was performed using a Perkin-Elmer AutoSystem Gas Chromatograph, equipped with a flame ionization detector and a split/splitless injector (Perkin-Elmer, Norwalk, USA) with an insert liner of 0.75 mm I.D. (Supelco, Bellefonte, PA, USA). A dedicated gas
chromatography capillary column 30 m × 0.25 mm × 0.12 µm
(CP Sil PAH-CB Ultimetal) from Varian (Walnut Creek, CA, USA) was used for the separation of the PAHs.
A fibre holder for manual use was purchased from Supelco. SPME fibres were also from Supelco and coated with six different films: poly(dimethylsiloxane)
(PDMS) 7, 30 and 100 µm, poly(acrylate) (PA) 85 µm,
poly(dimethylsiloxane/divynilbenzene) (PDMS/DVB) and a poly(dimethylsiloxane/divynilbenzene/carboxen) (PDMS/DVB/CAR). All fibres were conditioned in the hot injector of the gas chromatograph according to instructions provided by the supplier.
The stirring and heating of aqueous solutions were performed
using a hot/stirring plate, DataPlate Digital from Biomolecular
Inc. (Reno, NV, USA) with stirring bars 13 mm × 3 mm from Azlon (Bibby Sterilin, Staffordshire, UK).
The sample temperature during analysis by SPME was monitored using a 5” thermometer for SPME from Supelco.
Chemical and standard solutions
The acetonitrile was HPLC-grade obtained from Carlo Erba Reagenti (Milan, Italy). Acetone and methanol were pesticide-grade and were also obtained from Carlo Erba Reagenti. The analytes studied – naphthalene, acenaphtylene, acenaphtene, fluorene, phenantrene,
anthracene, fluoranthene, pyrene, benzo(a)anthracene,
chrysene, benzo(b)fluoranthene, benzo(k)fluoranthene,
benzo(a)pyrene, indeno(1,2,3-cd)pyrene, dibenzo(ah)
anthracene and benzo(ghi)perylene – were obtained from
Dr. Ehrenstorfer (Augsburg, Germany) and Chem Service (West Chester, PA, USA), quality > 99 %. Sodium chloride
and sodium thiosulfate (pro-analysis grade) were purchased
from Merck (Darmstadt, Germany). The reagent water was obtained from an Elix™ water purification system supplied by Millipore (Molsheim, France).
quality or equivalent). These stock solutions were diluted (1:500) in acetone to get an intermediate standard solution. For SPME optimisation studies, appropriate amounts of the intermediate standard solutions were added to reagent
water, resulting in concentrations between 0.5 µg L-1 and
5.0 µg L-1. These solutions were stored at 4 ºC in the
absence of light.
Fourteen solutions containing all standards with
concentrations between 0.1 and 5 µg L-1 were prepared for
linear range studies and the approximate concentrations were 0.1, 0.2, 0.3, 0.4, 0.5, 0.6, 0.7, 0.8, 0.9, 1.0, 2.0, 3.0,
4.0 and 5.0 µg L-1.
Sampling procedure
For sample storage, method validation and analysis, 20 mL crimp top glass vials were used. Vials were fitted with crimped aluminium caps lined with PTFE-coated butyl rubber septa. Vials, septa and seals were all purchased from Agilent Technologies (Wilmington, DE, USA). The water samples (20 mL) were collected directly into the vials, sealed and kept at 4 ºC until analysis. A mass of 2 g of sodium chloride was added to each sample. For samples containing residual chlorine it was also necessary
to add a reducing agent: 90 µL of a solution containing
1.8% of sodium thiosulfate was added to the sample
for its preservation.32 After collection, the samples were
immediately refrigerated at 4 ºC and were analysed within
7 days.32 The water samples were allowed to reach room
temperature before starting the analysis.
Chromatographic conditions
The chromatographic parameters used in this work were
previously optimised and validatedfor the separation of
PAHs 31: injector temperature 280 ºC, detector temperature
375 ºC, initial GC oven temperature 65 ºC (1 min),
increased at 25 ºC min-1 to 140 ºC and then at 5 ºC min-1 to
300 ºC. Helium was used as the carrier gas and was set to 117 KPa. Splitless time was experimentally determined and
was set to 2 min. The detector flow-rates were 450 mL min-1
for air and 45 mL min-1 for hydrogen.
On the beginning of each working day, a column blank was followed by fibre blank and reagent water blank to detect any possible laboratory contamination.
SPME procedure
For optimization of analytical conditions in the analysis of PAHs in water by SPME, an aliquot of 20 mL of
reagent water was spiked with 50 µL of an intermediate
standard solution on a 20 mL vial. Headspace analysis was performed using a headspace volume of 25% (15 mL sample on a 20 mL vial). After placing a stir bar in each vial, it was sealed with an aluminium seal with a PTFE-coated butyl rubber septum. The vials were placed on a hot/stirring plate at a controlled temperature. In order to control temperature, a 5” thermometer was placed in a vial containing reagent water under the same conditions and in parallel on the same hot/stirring plate. The samples were heated for 30 min and after this period the fibre was pushed out and exposed by immersion in the solution for 30 min. Whenever NaCl was used for the salting out effect, after each injection the SPME fibre was washed with reagent water to prevent salt accumulation on the fibre surface and to increase the fibre lifetime.
After extraction, the fibre was thermally desorbed for 2 min into the glass liner of the GC port at maximum
temperature recommended for each fibre (PDMS 7 µm =
340 ºC; PDMS 30 µm = 280 ºC; PDMS 100 µm = 280 ºC;
PA 85 µm = 320 ºC; PDMS/DVB 65 µm = 270 ºC; PDMS/
DVB/CAR 50/30 µm = 270 ºC). Subsequent analysis
showed no presence of carryover after 2 min of desorption time. Nevertheless, keeping the fibre in the injector for an additional time with the injector in split mode is a preventive measure for avoiding a possible carryover. Moreover, blanks were run periodically during the analysis to confirm the absence of contamination. For each parameter studied
all solutions were analysed in triplicate (n = 3).
Validation studies
The linear range of GC-FID coupled with the SPME procedure was studied by analysis of fourteen solutions containing all standards at different concentration levels
(between 0.1 and 5 µg L-1). The study of linearity included
the statistical linearity test determining the test value PG
required for the F-test. If PG ≤ F, the non-linear calibration
function does not lead to a significantly better adjustment:
the calibration function is linear.33 If PG > F, the working
range should be reduced as far as possible to receive a linear calibration function; otherwise the information values of the analysed samples must be must be evaluated using the non-linear calibration function.
Taking into account the linearity ranges a solution was prepared with all target compounds at the lower values of each linear range. These solutions were injected ten times and the standard deviations (SD) were determined based on the areas obtained for each compound. The values of limit of detection (LOD) and limit of quantification (LOQ)
were calculated using the formula (3 × SD) and (10 × SD),
The recovery was determined by analysing tap water and environmental waters spiked with an intermediate solution of target compounds. Tap water and environmental waters without fortification were analysed under the same conditions.
The recovery was calculated dividing the concentration of spiked sample obtained from calibration graph and theoretical concentration value (calculated from
concentration of original sample plus spike solution).34
The repeatability of the analytical procedure (as relative standard deviation, RSD %) was estimated analysing six replicates of reagent water spiked with an intermediate standard solution of PAH.
The successive extractions on the same sample (20 mL, 1
µg L-1 of each target compound) in the same conditions were
done in order to check the possibility of repeated analysis using the same sample, in routine analysis. Before two successive analyses on the same sample, there was a 15 min stabilization period before exposure to the fibre (30 min).
Water samples
The collection of samples in fieldwork was carried out within the sampling program for the quality control of water. The water samples (20 mL) were collected accordingly to the sampling procedure described in section 2.3. The samples were heated at 60 ºC on a hot/stirring plate at 1500 rpm and then kept at this temperature for, at least,
30 min. The fibre (PDMS 30 µm) was exposed directly to
the sample during 30 min (the stainless steel needle was kept 2 cm below the septum).
Results and Discussion
SPME fibre and temperature selection
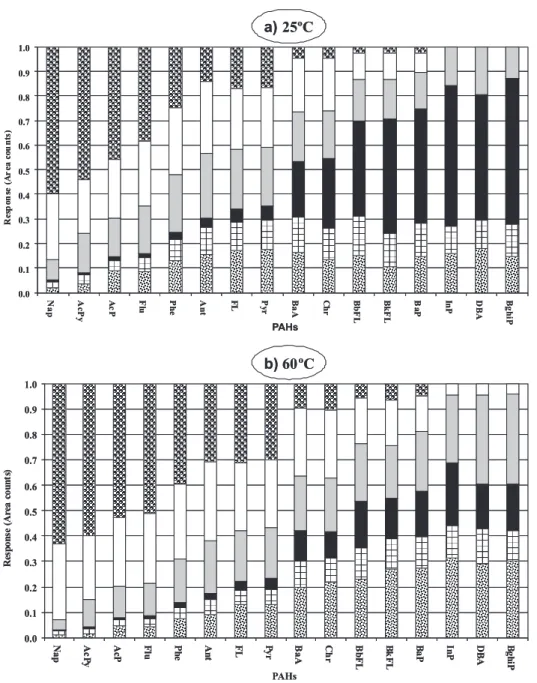
In order to find the most suitable fibre type, six fibres were tested at two temperatures: 25 ºC and 60 ºC. Figure 2 shows the peak areas obtained for PAHs by SPME extraction of three samples, using different fibres. The
analyte concentration (5 µg L-1 each PAH), the sample
volume (20 mL) and the extraction conditions (30 min, 1500 rpm) were the same in all cases.
PAHs with different characteristics showed different extraction behaviours. PDMS/DVB and PDMS/DVB/CAR fibres showed the best efficiencies for PAHs with two, three and four aromatic rings. However, these fibres showed no ability to extract some of the five and six-ring PAHs (such as BaP, InP, DBA and BghiP) at room temperature, and only PDMS and poly(acrylate) fibres were able to extract all sixteen PAHs in solution.
For the five and six-ring PAHs, PDMS was the most
suitable coating, particularly at 60 ºC. The 30 µm PDMS
coated fibre extracted the highest amounts of five- and
six-ring PAHs, followed by the 100 µm and 7 µm PDMS, and
by the poly(acryilate) fibre. These results were similar to
those described in the literature.25
The extraction efficiency increases with the temperature for all the five and six-ring PAHs, independently of the fibre. The one exception is observed when testing the 7
µm PDMS coated fibre; that may be explained by the fibre
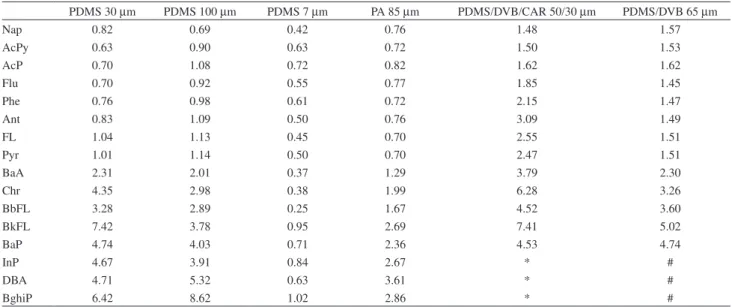
thin coating. A highest extraction temperature can lead to desorption of the analytes in such a thin coating. For the other fibres, a change in the extraction temperature from 25 to 60 ºC caused an increment up to eight-fold in the peak areas. For PDMS/DVB fibre, no peak was detected at 25 ºC for the six-ring PAHs, but increasing the temperature to 60 ºC allowed the detection of these compounds. Six-ring PAHs showed were not detectable with the PDMS/DVB/ CAR fibre, not even at an extraction temperature of 60 ºC. The increment of the response of the sixteen PAHs when increasing the extraction temperature from 25 to 60 ºC are presented in Table 1.
Although 60 ºC is an optimum temperature for five-ring and six-ring compounds, it was not particularly suitable for low molecular mass compounds. For these compounds the
high responses were obtained with PDMS 100 µm and these
responses were confirmed by other authors.3, 23-27 However,
accordingly with the requirements of Portuguese law (translation of the European Council Directive 98/83/EC) the target PAHs for analysis are the five and six-rings. For
this reason the best fibre is 30 µm PDMS and therefore all
subsequent experiments were made with this fibre.
Time extraction effect
In SPME analysis of PAHs, extraction time is a crucial parameter because these compounds have very long equilibrium times. The equilibrium time increases with the molecular mass of the PAHs. For example, Doong
et al. reported equilibrium times longer than 60 h for the
six-ring PAHs.3
The fibre was exposed directly into the solution for 5, 15, 30 and 45 min, under the same conditions. The results are presented in Figure 3.
Equilibrium was not reached within 45 min for the majority of the PAHs studied. But for quantitative analysis,
it is not necessary for the analytes to reach equilibrium.35
Analysis of variance (ANOVA) was applied to compare the results obtained with a 30 and a 45 min extraction time; the results showed no significant differences between the two
time was adopted, even though the majority of the PAHs have not reached the equilibrium at this time. Also, this sampling time was considered suitable and convenient for the chromatographic run, allowing maximum sample throughput.
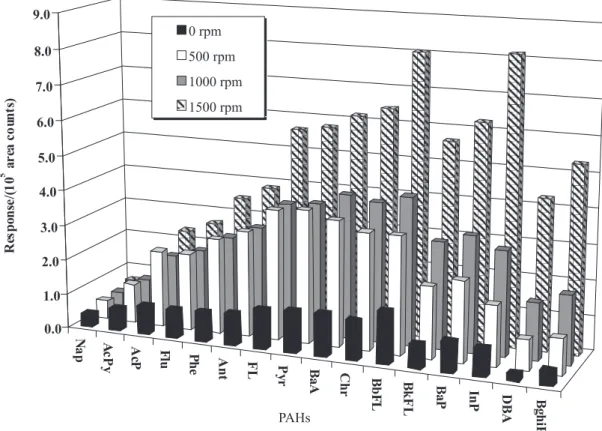
Stirring effect
Agitation is generally required to facilitate mass transport
between the bulk of the aqueous sample and the fibre.9 Four
stirring rates were tested: 0 (static), 500, 1000 and 1500 rpm (Figure 4). The stirring speed influences significantly the extraction of PAHs. A well-stirred or agitated solution
provides a more efficient extraction, increasing sensitivity. The best stirring speed was 1500 rpm.
“Salting-out” effect
Another parameter that may affect SPME of organic analytes is ionic strength of the aqueous solution. The ionic strength of the water can be increased by adding a
salt, (e.g. NaCl or NaSO4) to the aqueous samples, thereby
increasing the partitioning of organic analytes (especially polar analytes) into the polymer coating. Although salt addition can significantly increase the sensitivity of the method, very high salt contents during immersion SPME
can irreversibly damage the fibre, thus limiting its lifetime
and introducing imprecision in the measurements.12,27
The fibre was exposed by immersion in PAH solutions containing 0, 10 and 20% NaCl. The results can be seen in Figure 5. A concentration of 10% of NaCl yielded the greatest responses, providing better sensitivity.
Comparison between immersion and headspace
Although the immersion technique may be expected as more convenient, analysis by the headspace technique was
done for comparison. We compared the results obtained in the analysis of the same solution by immersion and headspace (1500 rpm and 60 ºC).
As expected, for the five- and six-ring PAHs, the headspace method yielded low or even no response at all (see Figure 6). This is due to the very low volatility of the heavier-weight PAHs.
These results confirmed direct immersion SPME as most suitable for the analysis of polynuclear aromatic hydrocarbons.
Table 1. The increment of response of the 16 PAHs when increasing the extraction temperature from 25 to 60 ºC
PDMS 30 µm PDMS 100 µm PDMS 7 µm PA 85 µm PDMS/DVB/CAR 50/30 µm PDMS/DVB 65 µm
Nap 0.82 0.69 0.42 0.76 1.48 1.57
AcPy 0.63 0.90 0.63 0.72 1.50 1.53
AcP 0.70 1.08 0.72 0.82 1.62 1.62
Flu 0.70 0.92 0.55 0.77 1.85 1.45
Phe 0.76 0.98 0.61 0.72 2.15 1.47
Ant 0.83 1.09 0.50 0.76 3.09 1.49
FL 1.04 1.13 0.45 0.70 2.55 1.51
Pyr 1.01 1.14 0.50 0.70 2.47 1.51
BaA 2.31 2.01 0.37 1.29 3.79 2.30
Chr 4.35 2.98 0.38 1.99 6.28 3.26
BbFL 3.28 2.89 0.25 1.67 4.52 3.60
BkFL 7.42 3.78 0.95 2.69 7.41 5.02
BaP 4.74 4.03 0.71 2.36 4.53 4.74
InP 4.67 3.91 0.84 2.67 * #
DBA 4.71 5.32 0.63 3.61 * #
BghiP 6.42 8.62 1.02 2.86 * #
Increment ratio = peak area of each PAH at 60 ºC / peak area of each PAH at 25 ºC; * No peak detected; # No peak detected at 25 ºC.
Figure 4. Comparison of extraction of PAHs between static and stirred samples at different speeds by SPME at 60 ºC during 30 min with a 30 µm PDMS fibre.
Linearity
Taking into account the results discussed in the previous sections, the best conditions of extraction by SPME
for PAHs were as follows: 30 µm PDMS fibre, direct
immersion SPME, 60 ºC extraction temperature, 20 mL of sample, a concentration of 10% of NaCl and a 30 min
extraction time with stirring (1500 rpm).
The calibration was performed using an external standard. The linear ranges, the PG values and F values of Snedecor/Fisher for each compound are given in Table 2.
The squared correlation coefficients (R2) of PAHs were
between 0.9873 and 0.9983. The linearity test showed that
Table 2. Regression data for PAHs by optimised SPME-GC-FID using a 30 µm PDMS fibrea
Compound Linearity range / (µg L-1) R2 n CV / (%) b SE(b) m SE(m) PG F
Nap 0.9-5.0 0.9982 6 2.9 -25 731 11390 239 4.4 10
AcPy 0.2-5.0 0.9934 11 8.7 8185 1287 20898 567 0.43 5.3
AcP 0.3-5.0 0.9965 8 6.8 3729 1907 36233 882 0.34 6.6
Flu 0.4-5.0 0.9952 9 6.6 4369 2969 45066 1186 2.5 6.0
Phe 0.4-5.0 0.9960 9 6.0 6390 3321 55211 1327 5.3 6.0
Ant 0.3-5.0 0.9960 8 6.2 9751 3189 62196 1613 1.8 6.6
FL 0.3-5.0 0.9960 9 6.2 6189 4981 82964 1996 1.5 6.0
Pyr 0.6-5.0 0.9962 8 5.3 5994 5541 83228 2089 0.57 6.6
BaA 1.6-5.0 0.9925 5 4.5 16485 15309 90782 4551 2.4 18
Chr 1.5-5.0 0.9980 5 2.4 35393 4849 75041 2054 2.5 18
BbFL 0.3-5.0 0.9941 8 7.2 4050 9049 109454 3429 0.29 6.6
BkFL 0.3-5.0 0.9979 7 5.1 25546 3204 66592 1356 0.05 7.7
BaP 0.4-3.0 0.9957 5 6.8 22153 4509 71395 2717 3.9 18
InP 0.4-4.0 0.9983 6 3.5 -5698 4658 98641 2056 5.3 10
DBA 0.8-4.0 0.9873 5 8.2 20065 4658 28776 1882 0.54 18
BghiP 0.3-5.0 0.9960 7 6.8 7910 3561 48446 1379 1.4 7.7
a R2 = squared correlation coefficients. n = number of data points. CV = coefficient of variation of the method. b = intercept. SE(b) = standard error of the
intercept. m = slope. SE(m) = standard error of the slope. PG = test value. F = value of Snedecor/Fisher (tabled value at 95%).
Figure 6. Comparison of extraction of PAHs from samples between immersion and headspace SPME at 60 ºC during 30 min with a 30 µm PDMS fibre
the method has good linear behaviour in the presented linear range. The linear range was about one order of magnitude for all PAHs. The lowest correlation of some of the five and six-ring PAHs may be explained by the low water solubilities and long equilibrium times of these compounds.
Detection and quantification limits
Ten replicate solutions containing each PAH at the lowest concentration level of the linear range were analyzed by SPME-GC-FID. The standard deviations (SD) were determined based on the areas obtained from each compound. The values of limit of detection (LOD) and limit of quantification (LOQ) were calculated using the formula 3×SD and 10×SD, respectively
and are presented in Table 3.33,35
Although the detection limits achieved in this study do not satisfy completely the requirements of the European
Council Directive 98/83/EC (LOD ≤ 0.25 × parametric
value), they were comparable to the detection limits reported by EPA Method 8270. The LOD and LOQ values achieved for benzo(a)pyrene are suitable for the guideline value
(0.7 µg L-1) defined by the World Health Organization
(WHO).
Repeatibility
The repeatability was studied by analysing six replicate samples of reagent water spiked with a concentration level
of 2.5 µg L-1. The repeatability of the method is expressed
as relative standard deviation (RSD). For the purpose of
this method it may be considered acceptable a RSD of 10% or less.
Table 4 shows that nearly all values are below 10%. Therefore, the precision of this method was acceptable.
Intermediate precision
Most methods have run-to-run and day-to-day variability. The last are affected not only by the reproducibility of the sample preparation procedure, but also by the state of the stationary phase in the GC column, which plays a major effect on the performance of separations for PAHs with lower resolution.
In the last step of the validation procedure we were focused on the repeatability performance of our method at one concentration level (in the middle of the working range), and we did not study the day-to-day variability (intermediate precision ).
The intermediate precision of the direct immersion SPME-GC-FID technique was studied by analysing nine replicate samples of reagent water spiked with a
concentration level of 1.0 µg L-1 of each PAH during three
days. The results can be seen in Table 5.
Except for the more volatile Nap, AcPy, AcP, Flu and Phe, the RSD values for the intermediate precision were all below 15%.
Repeated analysis on the same sample
There are significant differences between the responses obtained in the first and second extractions
Table 3. Limit of detection (LOD) and limit of quantification (LOQ) for
PAHs by optimized SPME-GC-FID using a 30 µm PDMS fibre
Compound LOD / (µg L-1) LOQ / (µg L-1)
Nap 0.27 0.91
AcPy 0.06 0.21
AcP 0.08 0.28
Flu 0.11 0.38
Phe 0.12 0.38
Ant 0.09 0.31
FL 0.07 0.25
Pyr 0.19 0.63
BaA 0.50 1.67
Chr 0.44 1.48
BbFL 0.09 0.29
BkFL 0.08 0.27
BaP 0.12 0.41
InP 0.10 0.34
DBA 0.23 0.77
BghiP 0.10 0.32
Table 4. Repeatability of the optimized SPME-GC-FID procedure using
the 30 µm PDMS fibre at a fortification level of 2.5 µg L-1
Compound Average Area (n=6) RSD / (%) (n=6)
Nap 66277 1.1
AcPy 102716 4.2
AcP 202497 4.3
Flu 238726 2.9
Phe 358093 5.3
Ant 456414 3.7
FL 690271 10
Pyr 691345 8.5
BaA 748752 4.2
Chr 759785 12
BbFL 880367 5.6
BkFL 512752 5.7
BaP 594049 7.8
InP 576573 6.9
DBA 150915 3.8
(see Figure 7). In the second extraction, the response (area count) for the majority of compounds was 25-35% lower; therefore, in these conditions it is not possible to repeat the analysis on the same sample. These results can be explained as due to depletion of the analyte occurring after each extraction.
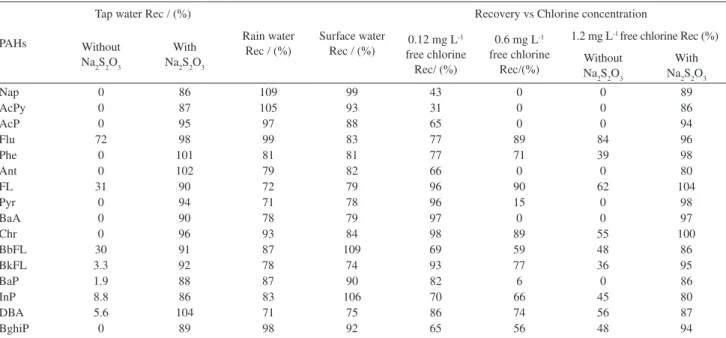
Recovery
The recoveries (Rec) of these compounds were evaluated after analysis of three samples of each matrix,
spiked with 50 µL of a solution containing PAHs (final
concentration level of 0.5 µg L-1). The results can be seen
in Table 6.
Most compounds have good recoveries in the various matrices tested, with the exception of the tap water. In this matrix, the recovery observed was too low, and the majority of the compounds were simply not detected. This is probably due to the high chlorine concentration that is present in tap
water. To test this hypothesis, 90 µL of a solution containing
1.8% of sodium thiosulfate was added to each tap water sample
(final concentration of sodium thiosulfate = 0.008%).32 The
samples were then spiked with 50 µL of a solution containing
PAHs (final concentration level 0.5 µg L-1). The addition
of sodium thiosulfate allowed the analysis of the PAHs in this matrix, providing good recoveries. Hence, it seems that chlorine concentration influences significantly the method. This hypothesis is tested on chlorine effect section.
Chlorine effect
The matrix effect study was perfomed in order to evaluate the interference of the concentration of chlorine
Table 5. Intermediate precision of the optimised SPME-GC-FID procedure
using the 30 µm PDMS fibre at a fortification level of 1.0 µg L-1
Compound RSD/(%) (n=9, 3 days)
Nap 38
AcPy 21
AcP 22
Flu 18
Phe 23
Ant 14
FL 11
Pyr 12
BaA 12
Chr 9.6
BbFL 15
BkFL 13
BaP 14
InP 13
DBA 15
BghiP 14
in water samples in the SPME extraction. Our goals was to decide if we had to use sodium thiosulphate after sampling and if there was any matrix interference in the SPME extraction procedure.
To test the hypothesis of chlorine interference in the analysis of PAHs by SPME-GC-FID, solutions of reagent
water containing a concentration of 0.12, 0.6and 1.2 mg L-1
chlorine were spiked with 50 µL of a solution containing
PAHs (final concentration level 0.5 µg L-1 each PAH). 90 µL
of a solution containing 1.8% of Na
2S2O3 was added to a
spiked solution containing 1.2 mg L-1 free chlorine. The
results are presented in Table 6.
Analysing our data we can say that there was a significant reduction of the level of target compounds when we use a higher concentration of chlorine. It seems clear that chlorine can be a serious cause of interference in the analysis of PAHs by this method in chlorinated
waters. Nevertheless, the addition of Na2S2O3 yielded
good recoveries, allowing the analysis of PAHs by SPME-GC-FID in chlorinated waters.
These results can be explained by the degradation of the PAHs or by the influence of chlorine on the adsorption efficiency on the SPME fibre.
Stability studies
In order to evaluate the stability of the PAHs in solution, we were prepared fourteen solutions with 20 mL
reagent water samples spiked with 2.5 µg L-1 of each PAH.
These solutions were sealed with aluminium caps lined with PTFE-coated butyl rubber septa at 4 ºC and in the
absence of light. They were analysed using the optimised SPME-GC-FID technique during 15 days (days: 1, 4, 6, 8, 11, 13 and 15). The analyses were made in duplicate. Blanks were prepared, refrigerated and analysed as well, in order to evaluate any possible contamination.
Analysis of variance (ANOVA) was applied to compare the results obtained during the 15-day period; the results showed no significant differences between the sets of data
(p value = 0.70).
Therefore, the storage of samples at 4 ºC and in the absence of light seemed to be effective for the preservation of the analytes during 15 days.
Water analysis
The validated method was used in the analysis of two hundred water samples from different sources: tap water, rainwater, surface water and groundwater. The samples
were obtained using adequate sampling procedures.7 The
analyses were done in duplicate. All samples gave PAHs concentrations less than minimum quantification levels.
On routine analysis, after the implementation of the method we use a control standard at the first concentration level in order to guarantee the LOQ given.
Conclusions
The SPME-GC-FID method was validated for the analysis of polynuclear aromatic hydrocarbons in water samples.
The different parameters affecting SPME of PAHs
Table 6. Recovery of PAHs by SPME-GC-FID in raw and treated water and with different chlorine concentrations
PAHs
Tap water Rec / (%)
Rain water Rec / (%)
Surface water Rec / (%)
Recovery vs Chlorine concentration
Without Na2S2O3
With Na2S2O3
0.12 mg L-1
free chlorine Rec/ (%)
0.6 mg L -1
free chlorine Rec/(%)
1.2 mg L-1 free chlorine Rec (%)
Without Na2S2O3
With Na2S2O3
Nap 0 86 109 99 43 0 0 89
AcPy 0 87 105 93 31 0 0 86
AcP 0 95 97 88 65 0 0 94
Flu 72 98 99 83 77 89 84 96
Phe 0 101 81 81 77 71 39 98
Ant 0 102 79 82 66 0 0 80
FL 31 90 72 79 96 90 62 104
Pyr 0 94 71 78 96 15 0 98
BaA 0 90 78 79 97 0 0 97
Chr 0 96 93 84 98 89 55 100
BbFL 30 91 87 109 69 59 48 86
BkFL 3.3 92 78 74 93 77 36 95
BaP 1.9 88 87 90 82 6 0 86
InP 8.8 86 83 106 70 66 45 80
DBA 5.6 104 71 75 86 74 56 87
have been studied, such as fibre coating, extraction method (direct immersion or headspace), stirring speed, fiber exposure time, temperature extraction, and salting-out effect. The best analytical conditions were obtained using
PDMS 30 µm fibre by direct immersion at 60 ºC for 30 min
under vigorous stirring (1500 rpm) and with the addition of 10% NaCl.
Linearity was studied between 0.1 and 5 µg L-1.
The minimum detection levels achieved with the SPME technique do not satisfy completely the regulatory levels of the European Council Directive 98/93/EC, but they are suitable for the guideline value of benzo(a)pyrene defined by the World Health Organization (WHO).
The optimized method yielded good repeatabilities ranging from 1.1 to 11.7% with a fortification level of
1 µg L-1. It also yielded good intermediate precision, in
particular for the heavier-weight PAHs.
The presence of chlorine in treated waters can cause serious interference when analysing PAHs by the
SPME-GC-FID procedure. The addition of Na2S2O3
overcomes this problem; therefore such addition is needed when screening chlorinated water samples.
The storage of the samples at 4 ºC and in the absence of light seemed to be effective for the preservation of the analytes during 15 days.
For screening PAHs in water samples, GC-FID is suitable for routine analysis but the use of GC-MS would be advisable to confirm identification of compounds and get further quantitative information if such information is needed. But in routine analysis of public water supplies (raw and treated water), just a few samples are likely to contain PAHs, and the proposed method can be easily used as a screening testing. If more detailed analyses were necessary for the few expected contaminated samples, the use of GC-MS would be necessary to confirm the identifications and search for possible causes of contamination.
An automated injection apparatus for the GC including adaptation for SPME would be a very useful addition to the analytical system, in order to increase sample throughput and make the process easier.
References
1. Manoli, E.; Samara, C.; Trends Anal. Chem. 1999, 18, 417. 2. W.H.O. (World Health Organization); Guidelines for
Drinking-water Quality, Vol. I - Recomendation, 3rd ed, Geneva, 2004. 3. Doong, R. A.; Chang, S. M.; Sun, Y. C.; J. Chromatogr A2000,
879, 177.
4. American Water Works Association (Editors); Water Quality & Treatment - A Handbook of Community Water Supplies, McGraw-Hill Handbooks, New York, 5th ed, ch. 2, 1999.
5. Santos, F. J.; Galceran, M. T.; Trends Anal. Chem. 2002, 21, 672.
6. European Commission, Council Directive 98/83/EC; Off. J. Eur. Commun.1998, L330, 32.
7. Clesceri, L. S.; Greenberg, A. E.; Eaton A. D.; Standard Methods for the Examination of Water and Wastewater, American Public Health Association, Washington DC: USA, 21st ed., Part 6000, 2005.
8. Frías, S.; Rodriguez, M. A.; Conde, J. E.; Pérez-Trujillo, J. P.; J. Chromatogr. A 2003, 1007, 127.
9. Morabito, P. L.; Mccabe, T.; Hiller, J. F.; Zakett, D.; J. High Resol. Chromatogr. 1993, 16, 90.
10. Pawliszyn, J.; Solid Phase Microextraction, Theory and Practice, Wiley-VCH, New York: USA, ch. 3, 4 and 6, 1997. 11. Zhang, Z.; Pawliszyn, J.; Anal. Chem. 1993, 65, 1843. 12. Zhang, Z.; Yang, M. J.; Pawliszyn, J.; Anal. Chem. 1994, 66,
844.
13. Dugay, J.; Miège, C.; Hennion, M. C.; J. Chromatogr. A 1998, 795, 27.
14. Page, B. D.; Lacroix. G.; J. Chromatogr. A 1997, 757, 173. 15. Gonçalves, C.; Alpendurada. M. F.; J. Chromatogr. A 2002,
968, 177.
16. Perez-Trujillo, J. P.; Frías, S.; Conde, J. E.; Rodríguez-Delgado, M. A.; J. Chromatogr. A 2002, 963, 95.
17. Sakamoto, M.; Tsutsumi. T.; J. Chromatogr. A 2004, 1028, 63. 18. Shu, Y. Y.; Wang, S. S.; Tardif, M.; Huang, Y.; J. Chromatogr.
A 2003, 1008, 1.
19. Almeida, C. M. M.; Vilas-Boas, L.; J. Environ. Monit. 2004, 6, 80. 20. Cho, H. J.; Baek, K.; Lee, H. H.; Lee, S .H.; Yang,J. W.; J.
Chromatogr. A 2003, 988, 177.
21. Luks-Betlej, K.; Popp, P.; Janoszka, B.; Paschke, H.; J. Chromatogr. A 2001, 938, 93.
22. Cho, D. H.; Kong, S. H.; Oh,S. G.; Water Res. 2003, 37, 402. 23. Stack, M. A.; Fitzgerald, G.; O’Connell, S.; James, K. J.;
Chemosphere 2000, 41, 1821.
24. Pérez, S.; Guillamón, M.; Barceló, D.; J. Chromatogr. A 2001, 938, 57.
25. Doong, R. A.; Chang, S. M.; Sun, Y. C.; J. Chromatogr. Sci.
2000, 38, 528.
26. Negrão, M. R.; Alpendurada, M. F.; J. Chromatogr. A 1998, 823, 211.
27. Psillakis, E.; Ntelekos, A.; Mantzavinos, D.; Nikolopoulos, E.; Kalogerakis, N.; J. Environ. Monit. 2003, 5, 135.
28. Supelco, Application Note 6, Sigma-Aldrich Co, http://www. sigmaaldrich.com/Graphics/Supelco/objects/4600/4554.pdf, accessed in March 2007.
29. King, A. J.; Readman, J. W.; Zhou, J. L.; Environ. Geo. Health.
2003, 25, 69.
31. Coelho, E.; Ferreira, C.; Almeida, C.; Optimização das Condições de Análise de Hidrocarbonetos Aromáticos Polinucleares por SPME-GC-FID, Abstracts of 3º Encontro Nacional de Cromatografia, Lisboa, Portugal, 15-17, 2003. 32. USEPA. SW-846 Methods (Chapter 4 - Organic Analytes),
Revision 3, December 1996.
33. ISO (International Organization for Standardization). ISO Standards Compendium – Environmental Water Quality, vol. I, 1st ed., pp. 279-287, 1994.
34. Burns, D. T.; Danzer, K.; Townsend, A.; Pure Appl. Chem.2002, 74, 2201.
35. The United States Pharmacopoeia, The National Formulary, USP 30/NF 25, <1225> Validation Compendial Procedures, pp. 680-683, 2007.
36. Ai, J.; Anal. Chem.1997, 69, 1230.