Multiscale Analysis of GPS Time Series from Non-decimated Wavelet
to Investigate the Effects of Ionospheric Scintillation
†G.O.N. BRASSAROTE1*, E.M. SOUZA2 and J.F.G. MONICO3
Received on November 30, 2013 / Accepted on April 15, 2015
ABSTRACT.Due to the numerous application possibilities, the theory of wavelets has been applied in several areas of research. The Discrete Wavelet Transform is the most known version. However, the down-sampling required for its calculation makes it sensitive to the origin, what is not ideal for some applications, mainly in time series. On the other hand, the Non-Decimated Discrete Wavelet Transform is shift invariant, because it considers all the elements of the sample, by eliminating the downsampling and, consequently, represents a time series with the same number of coefficients at each scale. In the present paper, the ob-jective is to present the theorical aspects of the a multiscale/multiresolution analysis of non-stationary time series from non-decimated wavelets in terms of its implementation using the same pyramidal algorithm of the decimated wavelet transform. An application with real time series of the effect of the ionospheric scin-tillation on GPS satellite signals is investigated. Results obtained in this investigation of the time series of the S4 scintillation index indicate the presence of a pattern that is repeated in the series on consecutive days. Through decomposition in multiscale by wavelets, this periodic daily effect could be identified in smoother scales of the wavelet periodogram, estimated and corrected from the original time series. Therefore, this paper presents an innovative methodology for the analysis of the effects of ionospheric scintillation on GPS signals, and take a first step toward separating the effect of scintillation in relations the other effects that may influence its analysis.
Keywords:Non-decimated wavelets, maximum overlap discrete wavelet transform, multiescale analysis, time series, ionospheric scintillation, GPS.
*Corresponding author: Gabriela Brassarote
†Thanks to Foundation for Research Support of the State of S˜ao Paulo – FAPESP, for the financial support; Paper presented at CMAC – Southeast in 2013.
1Master Degree in Computacional and Applied Mathematics, UNESP – Universidade do Estado de S˜ao Paulo, Rua Roberto Simonsen, 305, 19060-900 Presidente Prudente, SP, Brasil. E-mail: [email protected]
2Departamento de Estat´ıstica, UEM – Universidade Estadual de Maring´a, Av. Colombo, 5790, 87020-900 Maring´a, PR, Brasil. E-mail: [email protected]
1 INTRODUCTION
The theory of wavelets has been quite widespread, providing major advances in several different areas of the science. There are numerous possibilities of aplication, being used for modeling, decomposition, removal of noise and/or unwanted effects, compression, detection of singulari-ties, among other applications [6].
In general, the decimated version (Discrete Wavelet Transform – DWT) is the most well known. It is calculated through an efficient algorithm developed by Mallat [2], called Pyramidal Algo-rithm, which uses discrete filters and downsampling. This process eliminates the even or odd samples, so that at level j there is half of the coefficients of the previous level j−1. Applying an odd downsampling is similar to applying an even downsampling on data shifted by one unit. The DWT depends on the choice of downsampling, which corresponds to the choice of an origin in time or space [9].
In this application, the multiscale analysis is applied to non-stationary time series (TS) from GPS satellite signals. Some previous applications have obtained good results applying DWT to improve GPS positioning methods ([11]; [12]; [13]). However, to analyse TS it is preferable that the method is insensitive to the origin, which is possible with the shift invariant Non-Decimated Wavelet Transform (NDWT) [6].
Another advantage of using the NDWT is its easy implementation. It is possible to implement the NDWT applying the DWT pyramidal algorithm twice, first in the original vector and then in the shifted vector, eliminating the downsampling and causing that all the elements are considered at each stage of the algorithm.
The growing influence of GPS (Global Positioning System) in the navigation and remote sensing, is quite evident nowadays. However, until satellite signal gets to the GPS receiver, effects, often severe, influence the signal, causing errors or even the loss of the satellite signal by the receiver.
The ionosphere is a plasmatic region of the atmosphere that contains ions and electrons in suf-ficient quantity to affect signals of frequency band between 3 and 30 KHz that passes through it. The ionospheric scintillations, which are irregularities in the density of ions in the ionosphere is even worse. Its effects are more severe at high latitudes, where their occurrence is related to periods of high solar activity, magnetic storms and other extreme activities, and in equatorial and low latitudes regions, where the equatorial ionization anomaly (EIA) occurs [1]. The use of wavelets in the study of the scintillation have contributed for its better characterization in high latitude regions ([3]; [5]; [16]). However, for equatorial and low latitude regions, in which is included Brazil, there is still no work in that direction.
For high-precision applications it is necessary the correct understanding of the effect of the iono-spheric scintillation on GPS signals, enabling the characterization of this effect to allow the development of methodologies to reduce their interference.
stationarity. Due to the irregularities and scattering of the ionosphere, the effects of scintillation in the satellite signals may not be stationary. The use of the NDWT for a complete analysis in multiscale will make information and hidden patterns that could not be detected in the time or frequency domain can be explained in the time/frequency domain [7]. Even if some Fourier methods could be applied to non-stationary TS ([8]; [10]), when some effects need to be inves-tigated and separated in different scales at once, the wavelets methods became advantageous. This is because the wavelets can deal naturally with the severe non-stationarity in time caused by spikes of different magnitudes, identifying their frequency of occurrence, localization in time, and making a reliable approximation of magnitude of this effects.
2 THEORETICAL ASPECTS
Waveletis the functionψ (t)∈L2(R)that satisfies the following properties [9]:
∞
−∞
ψ (t)dt=0 and
∞
−∞
ψ2(t)dt =1
whereψ (t)is function of timet ∈R.
There are two known functions that perform a primary role in the wavelet analysis, the scaling functionφ, called fatherwaveletand thewaveletψ, also called motherwavelet.
The fatherwavelet, discretized form, in can be expressed as
φ (t)=√2 k
hkφ (2t−k)
wherehkis a low-pass filter, calledscaling filter, andkrepresents the scale covered by the filter.
On the other hand, in the relationship between the filtershk andgk,
gk=(−1)kh1−k
called quadrature mirror filter relation, it is considerated that the mother waveletψ can be de-fined as
ψ (t)=√2 k
gkφ (2t−k),
wheregkis a high-pass filter calledwavelet filter.
Through appropriate dilations and translations forφandψ, described by
φj,k(t)=2−j/2φ (2−jt−k) and ψj,k(t)=2−j/2φ (2−jt−k), j,k∈Z,
it is possible to construct bases for various function spaces. This is the main motivation for the development of the Wavelet Transform (WT), whose goal is to expand f ∈L2(R)using a set of wavelet functions that have time/frequency location.
Thus, it is considered that any signal f(t)∈L2(R)can be represented as [4]
f(t)=
k
cj0,kφj0,k(t)+
j≥j0
k
where
cj0,k =f(t), φj0,k(t)=−∞∞ f(t)φj0,k(t)dt, dj,k =f(t), ψj,k(t)=−∞∞ f(t)ψj,k(t)dt,
(2.1)
and j0represents the lowest level of resolution.
The coefficientsc,d described in (2.1), called smooth (or scaling) and detail (or wavelet) co-efficients, respectively, are result of the filtering of the function f(t) ∈ L2(R), by scaling and wavelets parent filters.
Aiming at practical application with sampled signals the following notation of DWT, in particu-lar the NDWT, will be used to facilitate its implementation.
2.1 NDWT
The great motivation for the use of the NDWT in this work is to use a transform that operates similarly to DWT, but does not suffer sensitivity to the origin choice in time for a TS, i.e., it is shift invariant. This sensitivity of the DWT is due entirely to dowsample the output from the scaling and wavelet filters at each scale (or level) of the pyramid algorithm, where for each two outputs of the filter, one output is discarded.
The idea of the NDWT is to eliminate the downsampling, considering all the elements, and representing a TS with the same number of coefficients at each scale.
The outputs of the filters that are discarded at the first level of the DWT pyramid algorithm, can be obtained by applying the DWT pyramid algorithm in the shifted vector T X instead of X, whereX is a sequence of observations (or a TS). This suggests that the NDWT can be obtained by applying the usual DWT pyramidal algorithm twice, once toXand the other toT X, and after merging the two sets of DWT coefficients together [9].
The NDWT scaling V˜j and wavelet W˜j coefficients, of level j, are calculed using the scaling coefficients V˜j−1of level j −1, as in DWT. However, downsampling does not occur and the filters are modified at each scale.
The NDWT scaling and wavelet coeffients can be seen as the result of the filtering of a TS X with the NDWT scaling and wavelet filters, which are presented below.
The NDWT scalingh˜k
and wavelet{ ˜gk}K-length filters, must satisfy
K−1
k=0 ˜
hk=0, K−1
k=0 ˜
h2k =1 2 and
+∞
−∞
˜
hkh˜k+2n=0,
and
K−1
k=0 ˜
gk =1, K−1
k=0 ˜
gk2= 1 2 and
+∞
−∞
˜
gkg˜k+2n=0,
So, given a TS{Xt :t =0, . . . ,N−1}, the result of the filtering of{Xt}with the NDWT scaling and wavelet filters is given, respectively, by
˜
Vj,t= K−1
k=0 ˜
hj,kXt−kmodN
˜
Wj,t = K−1
k=0 ˜
gj,kXt−kmodN, t =0,1, . . . ,N−1.
(2.2)
These two sequences given by equation (2.2) represent the NDWT of level j, and stipulate that the elements ofW˜j,V˜j andV˜j−1are obtained by circularly filtering{Xt}with the filters g˜j,k,
˜
hj,k
andh˜j−1,k
, respectively. The term “mod” of this equation allows a circularly filtering makingX to be represented with the same numbers of coefficients at each scale.
Moreover, it can be shown (see section 5.5 [9]) that it is possible to obtainW˜j andV˜jby filtering ofV˜j−1by the following equation
˜
Vj,t = K−1
k=0 ˜
hkV˜j−1,t−2j−1kmod N
˜
Wj,t = K−1
k=0 ˜
gkV˜j−1,t−2j−1kmod N, t =0,1, . . . ,N−1
(2.3)
The equations in (2.3) represent the NDWT pyramid algorithm and they can be written in matrix form as
˜
Vj = ˜BjV˜j−1 andW˜j = ˜AjV˜j−1, where the rows ofB˜j contain circularly shifted versions of
˜
hj
after it has been upsampled to
width 2j−1(k−1)+1 (that consists of inserting 2j−1zeros between each of thek values of the original filter) and then periodized to lenghtN, and with a similar construction for A˜j based upon g˜j[9].
The NDWT also allows to reconstructV˜j−1fromW˜jandV˜j. The inverse DWT can be calculated via inverse pyramidal algorithm described by the following equation
˜
Vj−1,t = K−1
k=0 ˜
hkV˜j,t+2j−1kmodN+
K−1
k=0 ˜
gkW˜j,t+2j−1kmodN, t =0,1, ...,N−1,
or, in matrix form,
˜
Vj−1= ˜BTj V˜j+ ˜ATjW˜j.
Through the wavelet periodogram, the energy of the process (or TS){Xt}is decomposed in different scales and with time/frequency location. It is calculated from the NDWT wavelet coef-ficients given in (2.2) and can be described by [4]
Ij,t =
W˜j,t
2
whereW˜j,t is calculated by the equation (2.2).
The periodogram provides a good description of where the significant changes are located in the function. Abrupt changes in the function correspond proportionately large magnitude of the coefficients.
From of the wavelet periodogram, a decomposition of variances is obtained in multiscale of the TS, i.e., in different levels of resolution j. Based on these results, it is possible to calculate the variance (energy) at each scale, with the goal to know what scale has the most energy. This task can be executed by summing all coefficients at each scale, according to the following equation
Sj,t = 1 N
N−1
n=0 W˜j,t
2
. (2.5)
and we have the global wavelet spectrum or power spectral density (PSD).
3 APPLICATION AND RESULTS
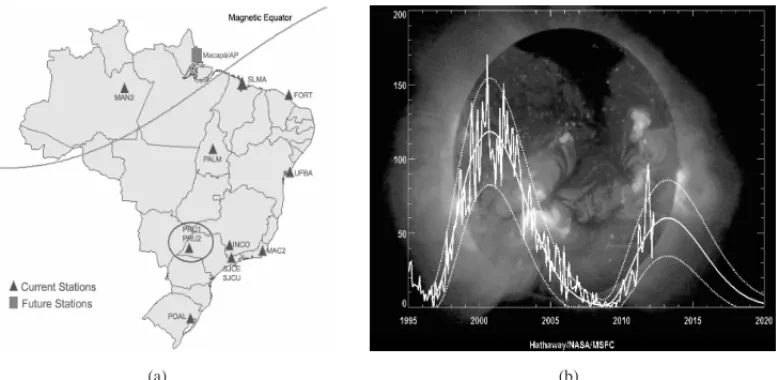
In March 2010, the CIGALA (Concept for Ionospheric Scintillation Mitigation for Professional GNSS in Latin America) project started to investigate the causes of the ionospheric scintillation on low latitudes and in the equatorial regions, as well as its effects on technologies under devel-opment. The choice of Latin America, especially Brazil is due to two reasons: it is in one of the most critical regions under effect of ionospheric irregularities and it has academic and commer-cial institutions of relevance to implementation and development of the project, such as UNESP (http://is-cigala-calibra.fct.unesp.br/is/).
With this project, 12 stations with high sampling rate receivers were installed in strategic places, as illustrated in Figure 1(a), so that the collections, maintenance and re-occupations are possible for validation of possible methodologies and algorithms developed. Thus, important data for the study of the ionospheric scintillation are available since February 14, 2011.
In order to investigate the TS of the effect of the ionospheric scintillation on GPS satellite sig-nals, and evaluate the proposed methodology, the data of the CIGALA Project available for the entire year of 2012 were used. The PRU1 station located at UNESP, Presidente Prudente, was chosen and the GPS satellite 11 was selected due to its highest scintillation index. The receiver, a Septentrio PolaRxS, represents the state of the art on receivers for tracking multi constellations and triple-frequency in the monitoring of the ionosphere. It has technology for extremely low noise and allows gathering intervals up to 100 Hz. It is possible to obtain the S4 scintillation index that can be used to characterize and help to understand the ionospheric irregularities that cause scintillation, as well as establish strategies for forecasting effects of the scintillation that can make the GPS ineffective [14].
The indexS4 is defined by
S4=
I2− I2 I2 ,
(a) (b)
Figure 1: (a) Stations of CIGALA network, highlighting station PRU1 used in this paper. Source: http://is-cigala-calibra.fct.unesp.br; (b) Cycle 24 – period of maximum solar activity in 2013. Source: http://solarscience.msfc.nasa.gov/predict.shtml.
denominator, the squared average of this intensity. Thus,S4 index is a unitless measure whose square root is like the coeficient of variation in statistics. AlthoughS4 amplitude index does not measure only scintilation effects, it has been used as an indicator of this effect in the literature. IfS4≥1.0 the level of scintillation is classified as strong, when 0.5≤S4≤1.0 the scintillation is moderate, and for 0≤S4≤0.5 the scintillation is weak [15].
The ionosphere is a very unstable layer that undergoes variations on several time scales – during the day, throughout the seasons and solar cycles that occur at each 11 years (Fig. 1(b)). In 2012, the highest indexS4 occured in March, as shown in Figure 2, where the indexS4 exceeds 2.1.
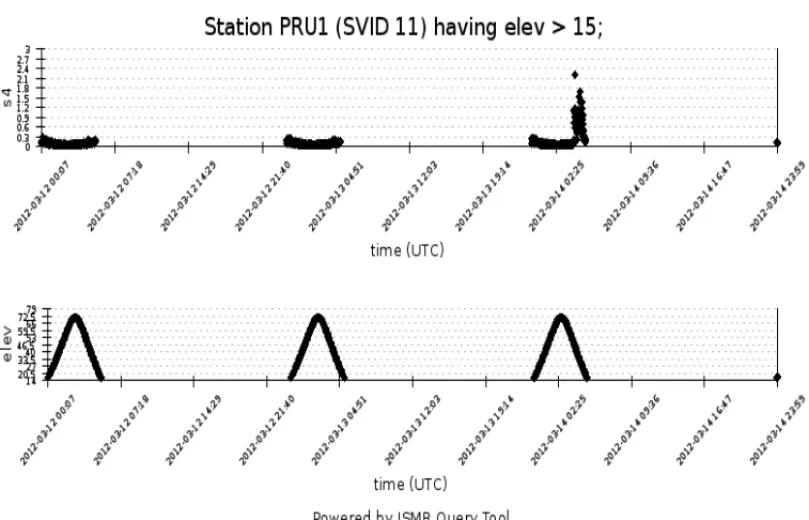
With a “zoom” on period from 03/12/2012 to 03/14/2012, it can be seen more clearly in Figure 3 (top) that the TS of scintillation index presents gaps caused by the lack of data when the satel-lites are not being tracked (i.e, daily gaps that occur because the satellite is invisible, below the horizon) and periodic behavior at each day when there are data.
This periodic behavior is related to effects that repeats about daily, such as multipath effect due to reflections of satellite signals on surfaces nearby of the receptor. If the receiver environment remains unchanged, the multipath effect changes according to the movement of the satellite, which has daily repeatability. It is noted also that this periodic behavior has a shape of “U”. Whereas the elevation angle between the satellite pointing direction and the local horizontal plane follows a shape of inverted “U”(bottom of the Figure 3), it is expected that the reflections (multipath) and noises are more expressive to lower angles.
Figure 2: Scintillation indexS4 from 01/01/2012 to 12/31/2012.
3.1 Results
The NDWT was applied to obtain the wavelet and scaling coefficients, given by 2.2, considering the wavelet family Symmlets with 10 vanishing moments (SYM10).
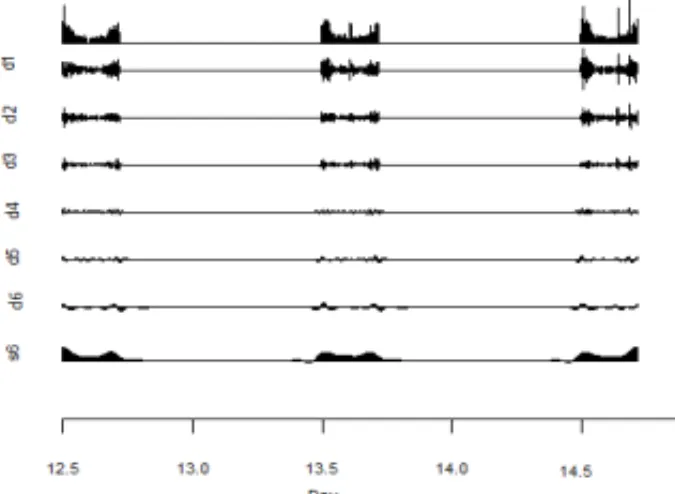
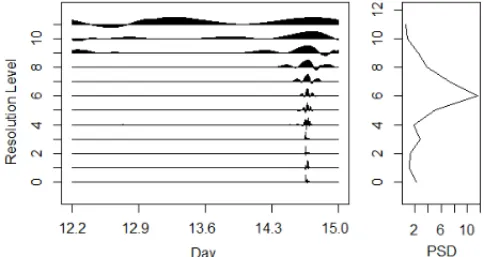
The Figure 4(a) presents the TS of the indexS4 of the period from 06/12/2012 to 06/14/2012 that caracterizes weak ionospheric scintillation, as preconized by the literature. Extracting in-formation in multiscale, as theory presented in section 2, we obtain in (b) the daily behavior of the TS in Figure 3 evidenced by repeatability at their three smoothest scales. So, we propose in this paper to estimate this behavior, which is evidenced at smoother scales of the wavelet peri-odogram and subtract it from the TS. Thus, in (c), the three smoothest scales are reconstructed to obtain a estimation of such behavior (or effect). For a more detailed analysis noindent multiscale, it was plotted (Fig. 4(d)) the wavelet spectrum estimated by the wavelet periodogram, described by the equation 2.4, and the global spectrum, which represents the energy or the total variance at each level of resolution. We can note in the global wavelet spectrum that the scale of level of resolution 9 is the greatest one. By interpretation of the frequency of resolution levels, the 9th level is related to the effects of 512 to 1024 minutes. This demonstrates that this effect is the closest to the daily behavior, which reinforces the existence of daily variations, which include the multipath, on scintillation indexS4.
(a) Scintillation index S4 from 06/12/2012 to 06/14/2012 (period of weak scintillation)
(b) Multiscale decomposition, period of weak scin-tillation
(c) Smoother scales reconstructed (d) Periodogram of the smoother scales
It is important to highlight that the wavelet multiscale decomposition is essential to identify in which scales the daily repeatability occurs. This methodology has advantages over methods in time domain or only in frequency domain, even those can deal with missing data, such as Fourier SLEX analysis or Lomb-Scargle periodograms ([8]; [10]). Wavelets can deal naturally with the severe non-stationarity in time caused by sudden spikes that change part of the U-shapes: sometimes in the beginning, middle and/or end of the U-shape, with different magnitudes. Hence, the difficulty is not to identify the frequency of occurrence of the periodicity, but to estimate only this effect without an overestimation due to mainly the spikes in edges of the U-shape.
Having extracted the daily behavior of the TS of index S4 of the period of strong scintillation (03/12/2012 to 03/14/2012), a TS corrected from the cyclical effect is plotted in Figure 5.
Figure 5: IndexS4 of the period with strong scintillation, with smoother scales (estimated in the period without scintillation) removed.
Figure 6: Periodogram of the scintillation index with smoother scales removed.
4 CONCLUSIONS
In this article a new methodology is presented for the investigation of the ionospheric scintillation through the wavelet spectrum of the TS of the indexS4 on GPS signals. It was possible to give a first step in relation to separate scintillation effect from other daily effects (mainly multipath) that may influence theS4 index.
After the estimation and removal of the daily effect, corrected series were obtained, making possible the investigation of an index that represents better the ionospheric scintillation. It is noteworthy that for effective analysis of the scintillation it is necessary to analyze a longer period of data, all available satellites and the other stations.
RESUMO. Devido `as in´umeras possibilidades de aplicac¸˜ao, a teoria dewaveletstem sido
utilizada nas mais diversas ´areas de pesquisa. A Transformada Wavelet Discreta ´e a vers˜ao mais conhecida. Por´em, o processo de decimac¸˜ao necess´ario para seu c´alculo, faz com que
ela seja sens´ıvel `a origem, o que para algumas aplicac¸˜oes n˜ao ´e o ideal, principalmente em
s´eries temporais. Ao contr´ario, a Transformada Wavelet Discreta N˜ao Decimada ´e invariante `a translac¸˜ao, pois leva em considerac¸˜ao todos os elementos da amostra, de modo a
repre-sentar uma s´erie temporal com o mesmo n´umero de coeficientes em cada escala, tendo o processo de decimac¸˜ao eliminado. Neste artigo pretende-se apresentar os aspectos te ´oricos da
an´alise multiescala/multirresoluc¸˜ao de s´eries temporais n˜ao estacion´arias a partir dewavelets
n˜ao decimadas utilizando, em termos de sua implementac¸˜ao, o mesmo algoritmo
pirami-dal da transformada waveletn˜ao decimada. Uma aplicac¸˜ao com a s´erie temporal real do
efeito da cintilac¸˜ao ionosf´erica sobre sinais de sat´elite GPS ser´a investigada. Resultados desta investigac¸˜ao das s´eries obtidas dos ´ındicesS4 de cintilac¸˜ao indicam a presenc¸a de um padr˜ao
que se repete na s´erie em dias consecutivos. Atrav´es da decomposic¸˜ao em multiescala por
wavelets, esse efeito peri´odico di´ario pode ser identificado nas escalas mais suaves do pe-riodogramawavelet, estimado e corrigido da s´erie temporal original. Portanto, este artigo
apresenta uma metodologia inovadora para a an´alise dos efeitos da cintilac¸˜ao ionosf´erica
so-bre sinais GPS, e d´a um primeiro passo em direc¸˜ao a separar o efeito da cintilac¸˜ao de outros efeitos que podem influenciar sua an´alise.
Palavras-chave:wavelets n˜ao-decimadas, transformada wavelet n˜ao-decimada, an´alise
mul-tiescala, s´eries temporais, cintilac¸˜ao ionosf´erica, GPS.
REFERENCES
[1] M.C. Kelley. The earths ionosphere: plasma physics and electrodynamics. San Diego: Academic Press (1989).
[2] S.G. Mallat. A theory for multiresolution signal decomposition: The wavelet representation.IEEE Trans. on Pattern Anal. and Mach. Intell.,11(1989), 674–693.
[4] P.A. Morettin. Ondas e Ondaletas: da an´alise de Fourier `a an´alise de ondaletas. EDUSP, S˜ao Paulo (1999).
[5] S.C. Mushini et al. Improved amplitu and phase-scintillation indices derived from wavelet de-trended high-latitude GPS data.GPS Solution,16(2012), 363–373.
[6] G.P. Nason. Wavelet Methods in Statistics with R. Springer, New York (2008).
[7] G.P. Nason & B.W. Silverman. The stationary wavelet transform and some statistical applications.
Lecture Notes in Statistics,103Springer-Verlag (1995), 281–299.
[8] H. Ombao, R. von Sachs & W. Guo. SLEX analysis of multivariate non-stationary time series.J. of the Am. Stat. Assoc.,100(470) (Jun., 2005), 519–531.
[9] D.B. Percival & A.T. Walden. Wavelets Methods for Time Series Analysis. Cambridge University Press, Cambridge, England (2000).
[10] J.D. Scargle. Statistical aspects of spectral analysis of unevenly spaced data.Astrophys. J.,263(1992), 835–853.
[11] E.M. de Souza et al. Processamento de Sinais com Wavelets: Reduc¸˜ao do Efeito do Multicaminho do Sinal GPS.TEMA – Tend. Mat. Apl. Comput.,6(1) (2005), 177–186.
[12] E.M. de Souza et al. Comparac¸˜ao das Bases de Wavelets Ortonormais e Biortogonais: Implementac¸˜ao, Vantagens e Desvantagens no Posicionamento com GPS.TEMA – Tend. Mat. Apl. Comput.,8(2007), 149–158.
[13] E.M. de Souza et al. M´etodo dos M´ınimos Quadrados com Regress˜ao Wavelets para Reduc¸˜ao de Erros no Processamento de Sinais GPS.TEMA – Tend. Mat. Apl. Comput.,8(2007), 139–147.
[14] J.H. Strangeways. Determining scintillation effects on GPS receivers. Radio Science, 44 (2009), doi:10.1029/2008RS004076.
[15] R. Tiwari et al. WBMod Assisted PLL GPS Software Receiverfor Mitigating Scintillation Affect in High Latitude Region.URSI – Int. Union of Radio Sci., IEEE (2011).
[16] R. Tiwari et al. Investigation of ionospheric irregularities and scintillation using TEC at high latitude.