Explaining school mathematics performance from symbolic
and nonsymbolic magnitude processing: similarities and
differences between typical and low-achieving children
Fernanda de Oliveira Ferreira
1,2, Guilherme Wood
3, Pedro Pinheiro-Chagas
1, Jan Lonnemann
4,5,6,
Helga Krinzinger
4, Klaus Willmes
4and Vitor Geraldi Haase
11 - Universidade Federal de Minas Gerais, Belo Horizonte, MG, Brazil
2 - Universidade Federal do Vale do Jequitinhonha e Mucuri, Diamantina, MG, Brazil 3 - Karl Franzens University of Graz, Graz, STMK, Austria
4 - RWTH Aachen University, Aachen, NRW, Germany 5 - Goethe University, Frankfurt am Main, HE, Germany
6 - Center for Individual Development and Adaptive Education of Children at Risk (IDeA), Frankfurt am Main, HE, Germany
Abstract
Magnitude processing is one of the most central cognitive mechanisms that underlie persistent mathematics dificulties. No consensus has yet been reached about whether these dificulties can be predominantly attributed to deicits in symbolic or nonsymbolic magnitude processing. To investigate this issue, we assessed symbolic and nonsymbolic magnitude representations in children with low or typical achievement in school mathematics. Response latencies and the distance effect were comparable between groups in both symbolic and nonsymbolic tasks. The results indicated that both typical and low achievers were able to access magnitude representation via symbolic and nonsymbolic processing. However, low achievers presented higher error rates than typical achievers, especially in the nonsymbolic task. Furthermore, measures of nonsymbolic magnitude explained individual differences in school mathematics better than measures of symbolic magnitude when considering all of the children together. When examining the groups separately, symbolic magnitude representation explained differences in school mathematics in low achievers but not in typical achievers. These results suggest that symbolic magnitude is more relevant to solving arithmetic problems when mathematics achievement is particularly low. In contrast, individual differences in nonsymbolic processing appear to be related to mathematics achievement in a more general manner. Keywords: symbolic number processing; nonsymbolic number processing; cognition; child development; dyscalculia.
Received 4 November 2011; received in revised form 25 April 2012; accepted 7 May 2012. Available online 29 June 2012.
Fernanda de Oliveira Ferreira, Pedro Pinheiro-Chagas, and Vitor Geraldi Haase, Departamento de Psicologia, Universidade Federal de Minas Gerais, Belo Horizonte, Brazil. Fernanda de Oliveira Ferreira is also at Universidade Federal do Vale do Jequitinhonha e Mucuri, Diamantina, Brazil. Guilherme Wood, Institute of Psychology, Karl Franzens University of Graz, Graz, Austria. Jan Lonnemann, Helga Krinzinger, and Klaus Willmes, Department of Neuropsychology, RWTH Aachen University, Aachen, Germany. Jan Lonnemann is also at Department of Educational Psychology, Institute for Psychology, Goethe University, Frankfurt am Main, Germany and Center for Individual Development and Adaptive Education of Children at Risk (IDeA), Frankfurt am Main, Germany. Correspondence regarding this article should be directed to: Guilherme Maia de Oliveira Wood, Institute of Psychology, Karl-Franzens University Graz, Universitätsplatz 2/ III, 8010, Graz, Austria. Phone: +43 316 380 8503. Fax: +55 316 380-9829. E-mail: [email protected]
Introduction
Mathematics dificulties (MD) are currently deined as persistent and severe dificulties in acquiring speciic
abilities related to mathematics that cannot be attributed
to emotional or educational inadequacies, lack of general intelligence, or sensorimotor impairment (American
Psychological Association, 1994; Butterworth, 2005).
The terminology and diagnostic criteria for MD vary
widely. Mathematics learning dificulties or disabilities
as research criteria refer to performance on standardized achievement tests below cut-off scores at the 25th to 35th
percentiles (Geary & Hoard, 2005; Jordan, Hanich, &
Kaplan, 2003). In contrast, developmental dyscalculia is usually deined by more stringent criterion (i.e., the 10th percentile; Murphy, Mazzocco, Hanich, & Early, 2007).
One inluential model of number processing attributes the main deicits encountered in MD to core magnitude representation dificulties (Piazza et al., 2010). Feigenson,
Dehaene, & Spelke (2004) proposing that infants and adult humans share an approximate number system dedicated
to representing number magnitude in an abstract form. According to the core deicit hypothesis, developmental dyscalculia is caused by a deicit that is speciic to the
performance on tasks that assess number magnitude, such
as nonsymbolic numerosity tasks (Dehaene, 1992, 2009).
Recently, Piazza and colleagues (2010) showed that the acuity of the approximate number system is impaired
in children with MD. Similarly, some authors have suggested that the deicits observed in MD constitute
an impairment in the “number module,” a system dedicated to processing sets of objects and operating
on them (Butterworth, Varma, & Laurillard, 2011). The
approximate number system interacts with symbolic
notational systems. Many authors argue that learning the
symbolic number system may be at least as important for
explaining deicits in MD as a deicit in the more basal
competencies related to the approximate number system
(e.g., Rousselle & Nöel, 2007). Furthermore, Mussolin,
Mejias, & Noel (2010) proposed a Two-Factor Theory of developmental dyscalculia that relates arithmetic achievement to both symbolic and nonsymbolic number
representations. According to this theory, children are
born with a nonsymbolic number sense and learn in school to map exact numerical symbols onto the internal number
representations. Accordingly, dyscalculic children may initially have a weak number sense, and this deicit may prevent them from beneiting from the increasing precision yielded by symbolic numbers (Mussolin et al., 2010).
If the core magnitude deicit hypothesis is correct, then deicits in both symbolic and nonsymbolic tasks
should be observed in MD (henceforth designating both of the experimental groups in the present study and MD in general) compared with typically achieving children (henceforth the control group in the present study) because magnitude representations are
accessed in both tasks. However, deicits may be more
pronounced in the nonsymbolic task because it more
directly measures the approximate number system.
Moreover, the nonsymbolic task should predict school mathematics achievement better than the symbolic
task. However, if the disconnection hypothesis is
true, then not only should one observe much more
pronounced deicits in symbolic magnitude processing
in the MD group, but this task should also be a better predictor of school mathematics achievement than nonsymbolic magnitude processing, regardless of the
group. Finally, possible differences in basic magnitude
comparisons between the MD group and the sample
with MD associated with language dificulties (MD+L group) were also examined. If deicits in phonological
and verbal abilities affect learning to connect symbols
and magnitudes, a more severe deicit in symbolic magnitude processing should be observed in the MD+L group than in the MD group.
Based on the hypothesis that the approximate number system has a continuous distribution in the population (Halberda, Mazzocco, & Feigenson, 2008), no categorical difference in nonsymbolic representation should exist between children with dyscalculia and
typically developing children. To explore the nature of
nonsymbolic representation, two criteria were used to
classify children with MD in the present study: a liberal criterion (25th percentile) and a more conservative
criterion (10th percentile). Using these two criteria, one can investigate how mathematics learning dificulties are associated with the severity of deicits in magnitude processing. Moreover, the numerical ranges used in
symbolic and nonsymbolic tasks were chosen to prevent interference from factors such as subitizing (Piazza et
al., 2010) in the nonsymbolic task and the unit–decade compatibility effect in the symbolic task. To avoid the
occurrence of subitizing processes in the nonsymbolic task, the numerical interval used in the nonsymbolic task in the present study was above the subitizing range
(1–4). Moreover, with regard to the symbolic task, we
chose a simple version of the task, including single digits only, to avoid interference from more complex aspects of symbolic magnitude processing such as familiarity
with round decade numbers (e.g., 10, 20, 30, and so on; Brysbaert, 1995) and the unit-decade compatibility effect (Nuerk, Weger, & Willmes, 2001).
Methods
Participants
Children participated only after written informed consent was obtained from their parents and orally from
the children. Participants were recruited from schools
in two southeastern Brazilian cities, Belo Horizonte
and Mariana. Approximately 82% of the children attended public schools. Recruitment was conducted in two phases. In the screening phase, 16 schools, eight
of which were public schools, were randomly selected from seven of a total of 10 school districts in the two
cities. Classrooms were then selected in these schools,
and the families were invited to participate in the
project. The study was approved by the local research
ethics committee of the Federal University of Minas
Gerais.
A total of 1643 children were screened for MD.
Subjects included in the screening sample had a
mean age of 9.75 years (SD = 1.95 years; range = 6 years; mean = 117.7 months; SD = 23.3 months). The mean formal schooling was 3.39 years (SD = 1.66 years; range = 6 years), and 50.9% of the subjects were female. Testing was conducted in groups in the classrooms. Two instruments were used in the
screening phase: the arithmetic and single word spelling subtests of the Brazilian School Achievement Test (Teste do Desempenho Escolar [TDE]; Stein,
1994). After screening, more detailed individual testing was conducted. The parents of all of the
children were invited to a meeting where the second
phase of the research (i.e., an individual assessment of approximately three sessions, 1 h each) was explained.
Four hundred twenty-four parents did not attend the meeting, 110 parents did not allow their children to participate in the second phase of the study, 123 children
presented only isolated spelling dificulties, 581
presented genetic disorders. Mothers were interviewed
with regard to the developmental, learning, and health histories of their children (Entrevista Semi-Estruturada para Diagnóstico em Psiquiatria da infância, K-SADS;
Brasil, 2003). Testing was conducted in quiet rooms dedicated by the schools for the study. Children were
assessed using Raven’s Coloured Progressive Matrices
(Angelini, Alves, Custódio, Duarte, & Duarte, 1999),
the reading subtest of the TDE, a simple reaction time task, and two computer tasks to assess magnitude
comparisons. Children with performance below the
25th percentile on Raven’s Coloured Progressive Matrices (Angelini et al., 1999) were excluded from the sample.
One hundred sixty-eight pupils participated in the second phase of the study that consisted of individual
neuropsychological testing. The mean age was 10.10 years (SD = 1.93 years) and 127.07 months (SD = 23.42 months). The 53 children with performance
below the 25th percentile in arithmetic but above the
25th percentile in spelling were assigned to the MD group. The 26 children with performance below the
25th percentile in both arithmetic and spelling were assigned to the MD+L group. The 89 children with
performance above the 25th percentile in all of the tests were assigned to the control group. All groups were
matched with regard to intelligence, age, and school
grade (Table 1). Mean formal schooling was 3.81 years (SD = 1.72 years), and 49.7% of the participants were female. Table 2 presents the group performance in
reading, spelling, and arithmetic and the mean age and
intelligence scores.
Psychological instruments
Brazilian School Achievement Test (Teste do Desempenho Escolar, TDE; Stein, 1994). The TDE is
the standardized test of school achievement most widely
used in Brazil. The TDE comprises three subtests:
arithmetic, single-word spelling, and single-word
reading. Norms are provided for school-aged children between the irst and sixth grades. The arithmetic
subtest is composed of three simple orally presented word problems and 45 written arithmetic calculations
of increasing complexity. The spelling subtest consists of 34-word dictation of increasing syllabic complexity.
The single-word reading subtest of the TDE consists of
75 stimuli that must be read aloud by the participant. Reliability coeficients (Cronbach’s α) are 0.87 or higher. The children were instructed to work as hard as they could without a time limit.
Simple Reaction Time Task. The computerized reaction time task is a simple task in which a picture of
a wolf (9.31 cm height, 11.59 cm length) is displayed in the center of a black screen for a maximum of 3000 ms.
The participant is instructed to press the space bar on the keyboard as fast as he or she can at the moment he or
she sees the wolf. Trials are terminated with the irst key press. The task had 30 trials with an intertrial interval of 2000, 3500, 5000, 6500, or 8000 ms. This task was used
to control possible differences in basic processing speed
unrelated to numerical tasks.
Symbolic Magnitude Comparison Task. In the symbolic number comparison task, Arabic numerals
from 1 to 9 were presented on the computer screen (2.12 cm height, 2.12 cm length). The visual angle of the stimuli was 2.43° in both the vertical and horizontal dimensions. The children were instructed to decide whether the magnitudes were larger or smaller than 5.
Arabic numerals were presented in white on a black
background. If the presented number was lower than 5, the child had to press a predeined key on the left side of the keyboard with the left hand. If the stimulus was
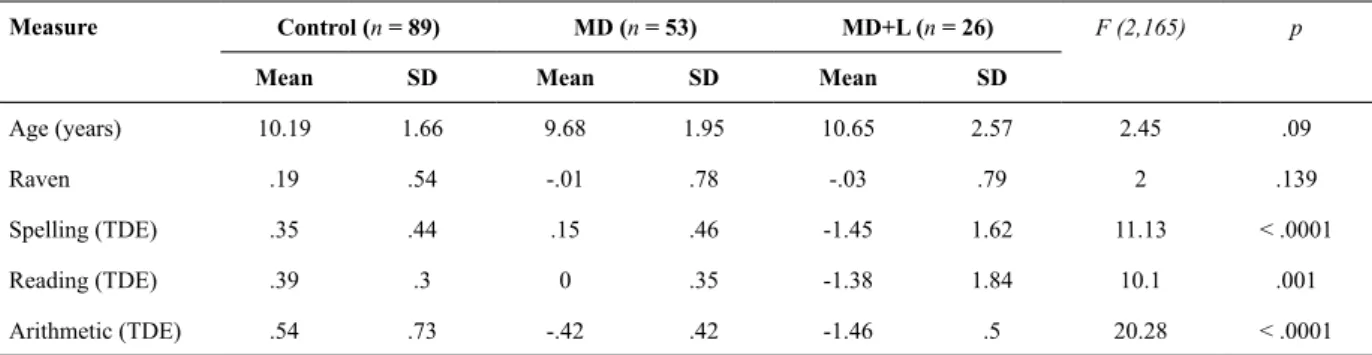
Table 2. Sample descriptions (age and intelligence) and performance in reading, spelling, and arithmetic (Z scores)
Measure Control (n = 89) MD (n = 53) MD+L (n = 26) F (2,165) p
Mean SD Mean SD Mean SD
Age (years) 10.19 1.66 9.68 1.95 10.65 2.57 2.45 .09
Raven .19 .54 -.01 .78 -.03 .79 2 .139
Spelling (TDE) .35 .44 .15 .46 -1.45 1.62 11.13 < .0001
Reading (TDE) .39 .3 0 .35 -1.38 1.84 10.1 .001
Arithmetic (TDE) .54 .73 -.42 .42 -1.46 .5 20.28 < .0001
Control, typical achievers; MD, mathematics dificulties; MD+L, mathematics and language dificulties. Table 1. Individual assessment sample descriptions
Measure Control (n = 89) MD (n = 53) MD+L (n = 26) c2 df p
Sex (Female) 58.40% 43.40% 38.50% 4.81 2 .090
School (Public) 77.30% 86.50% 88.50% 2.78 2 .249
higher than 5, then the key to be pressed was located at the right side of the keyboard and had to be pressed with
the right hand. The number 5 was not presented on the computer screen. Numerical distances between stimuli
and the reference number (5) varied from 1 to 4, with each
numerical distance presented the same number of times. Between trials, a ixation point (i.e., a cross designed
with the same size and color as the stimuli) appeared on
the screen. The task comprised eight learning trials and 80 testing trials. The maximum stimulus presentation time was 4000 ms with an intertrial interval of 700 ms.
Nonsymbolic Magnitude Comparison Task. In the nonsymbolic magnitude comparison task, the participant was instructed to compare two simultaneously presented sets of dots, indicating which one contained the larger
number. Black dots were presented on a white circle on a black background. In each trial, one of the two white circles contained 32 dots (i.e., reference numerosity), and the other one contained 20, 23, 26, 29, 35, 38, 41, or 44 dots. Each dot set magnitude was presented eight times, each time in a different coniguration. The task comprised eight learning trials and 64 testing trials. Perceptual
variables were randomly varied such that individual dot size was held constant in half of the trials, whereas the size of the area occupied by the dots was held constant in the
other half of the trials (Dehaene, Izard, & Piazza, 2005).
The maximum stimulus presentation time was 4000 ms
with an intertrial interval of 700 ms. Between each trial, a ixation point (i.e., a 3-cm diameter crossprinted in white) appeared on the screen. If the child judged that the right circle presented more dots, then a predeined key on the
right side of the keyboard had to be pressed with the right
hand. If the child judged that the left circle contained more dots, then a predeined key on the left side of the keyboard had to be pressed with the left hand.
Computer tasks were programmed with the
Neurobehavioral Systems presentation software.
Participants were seated approximately 50 cm from the
computer screen.
Data analysis
Response time data were trimmed, eliminating in two iterative steps all of the responses that were more extreme than three standard deviations from the individual means and reaction times that were faster
than 200 ms. Error data were arcsine-transformed to correct for skewness. The distance effect was calculated
for performance accuracy (error rates) and speed
(reaction time). Reaction times and error rates with large distances (6, 9, and 12 for the nonsymbolic task
and 2, 3, and 4 for the symbolic task) were subtracted from those with small distances (3 for the nonsymbolic
task and 1 for the symbolic task). To verify the presence
of a distance effect, a series of mixed-design analyses of variances (ANOVAs) was conducted for each task and each group for reaction times and error rates, with group
as the between-subjects factor. When the assumption of
sphericity was not met and epsilon estimates were less
than 0.75, the Greenhouse-Geisser correction was used. When main or interaction effects were signiicant, more speciic Bonferroni Least Signiicant Difference post hoc comparisons were performed.
Results
Simple reaction time measure
Hand, foot, and eye dominance were assessed using the standard protocol of Lefevre & Diament
(1982). All analyses were conducted by merging the data from left- and right-handed boys and girls. No signiicant differences were found among the three
groups with regard to reaction times in the simple reaction time task (F (2,165) = 1.61, MSE = 56256.67,
p = .204, η² = .024). Mean reaction times were 418.9 ms (SD = 131.43 ms) in the control group, 457.75 ms (SD =173.19 ms) in the MD group, and 500.53 ms (SD = 337.33 ms) in the MD+L group. These results indicate no signiicant baseline differences in simple reaction times.
Group comparisons in the symbolic task
A one-way ANOVA was conducted to compare the
three groups (MD, MD+L, and control) in the symbolic task. No signiicant differences were found among groups
in overall reaction time (F [2,115] = 2.62, MSE = 205135,
p = .076, η² = .037). Mean reaction times were 907 ms (SD = 323 ms) in the MD group, 916 ms (SD = 223 ms) in the MD+L group, and 851 ms (SD = 262 ms) in the control group. Bonferroni post hoc comparisons indicated
no signiicant differences among the three experimental groups. Reaction times for each distance and each group in the symbolic task are presented in Figure 1A.
Figure 1A. Reaction time as a function of numerical distance in the
MD, MD+L, and control groups in the symbolic task.
One-way ANOVA revealed signiicant differences
in total error rates among the three groups in the symbolic task (F [2,139] = 3.33, MSE = .073, p = .039,
η² = .036). Error rates were 11% in the control group, 16.38% in the MD+L group, and 18.37% in the MD group. However, pairwise comparisons revealed no signiicant differences among groups (p > .05). Error rates for each distance are presented in Figure 1B.
1 2 3 4
1150
1050
950
850
750
Reaction
T
ime (ms)
Numerical distance
Group comparisons in the nonsymbolic task
The analysis of the perceptual control factors did not reveal any differences in overall correct responses
for size (mean = 78%) and luminance (mean = 79%, p = .262, Cohen’s d = .02). Consequently, we assumed that
children processed the numerosity characteristics of the stimuli, so the perceptual factors were not considered in
the subsequent analyses.
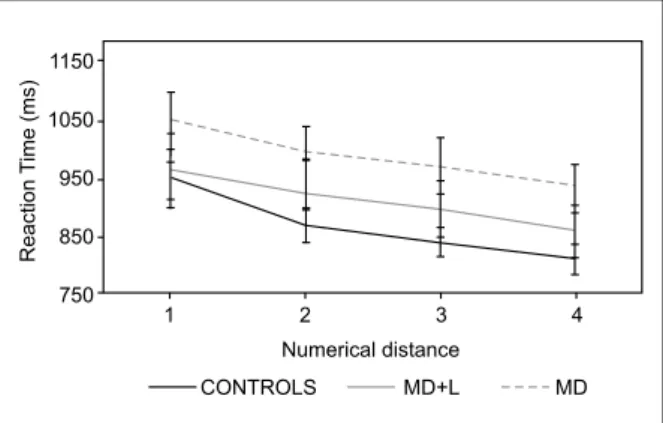
A one-way ANOVA was conducted to assess
the presence of statistically signiicant differences in response latency and accuracy across the three groups.
The MD group presented numerically higher total
reaction times (mean = 1242 ms, SD= 423 ms) than the MD+L group (mean = 1201 ms, SD = 347 ms) and control group (mean = 1191 ms, SD = 294 ms), but this difference did not reach statistical signiicance (F [2, 160] = .318, MSE = 38479.47, p = .728, η² = .004).
Figure 2A shows the reaction times for each distance
and each group in the nonsymbolic task.
rates (26%) than the MD+L (25%) and control (18%) groups. Corrected Bonferroni comparisons between the MD and control groups revealed a signiicant effect of
group (t [141] = -4.15, p < .05, Cohen’s d = .70).Bonferroni post hoc comparisons revealed no signiicant difference between the MD+L and control groups or between the MD and MD+L groups. Figure 2B shows the error rates for each distance and each group in the nonsymbolic task.
Figure 1B. Error rates (%) and standard errors as a function of nu
-merical distance in the MD, MD+L, and control groups in the sym
-bolic task.
Figure 2A. Reaction time (mean and standard error) as a function
of numerical distance in the MD, MD+L, and control groups in the nonsymbolic task.
With regard to total errors in the nonsymbolic task,
one-way ANOVA revealed signiicant differences among
the three groups (F [2, 160] = 9.04, MSE = 0.133, p < .0001, η² = .113). The MD group presented higher error
Figure 2B.Error rates (%) and standard errors as a function of nu
-merical distance in the MD, MD+L, and control groups in the non
-symbolic task.
Distance effect
The distance effect was analyzed by repeated-measures ANOVAs calculated separately for each task for reaction times and error rates, with group as the
between-subjects factor.
Distance effect for the symbolic task
.
A signiicantdistance effect on reaction times was found in the symbolic task (F [2, 141] = 70.93, MSE = 380986, p < .001, η² = .350), but no signiicant interaction with
group was observed (F [2, 141] = 1.07, MSE = 5739, p
= .346, η² = .016). This indicates that the three groups
presented comparable distance effects in the symbolic
task. Reaction times for each distance and each group in the symbolic task are shown in Figure 1A.
A signiicant distance effect was found when
considering error rates (F [1, 141] = 29.26, MSE = .428, p < .001, η² = .180), but no signiicant interaction with
group was observed (F [2, 142] = 1.28, MSE = .020, p
= .281, η² = .019). This indicates that the distance effect
for errors in the symbolic task was comparable across
groups. Bonferroni post hoc comparisons did not reveal
any signiicant differences among groups with regard to either response latencies or accuracy. Error rates in the
symbolic task are shown in Figure 1B for each distance
and each group.
Distance effect in the nonsymbolic task
.
Similarto the results found for the symbolic task, a signiicant
main effect of distance on reaction time was found in the nonsymbolic task (F [1, 141] = 45.96, MSE =
658316, p < .001, η² = .245). This indicates a robust distance effect on response latencies (Figure 2A). No signiicant interaction between distance and group was
3 6 9 12
1150
1050
950
850
750
Reaction
T
ime (ms)
Numerical distance
found (F [2, 141] = 1.87, MSE = 26765, p =.158, η² =
.026), indicating a similar distance effect in all three groups.
With regard to error rates, a signiicant distance
effect was found (F [2, 141] = 309.47, MSE = 4.26, p < .001, η² = .685), but no signiicant interaction with
group was observed (F [2, 141] = .733, MSE = .010, p =
.482, η² = .010). These results indicate that the distance effect was comparable in all three groups. Error rates for
each distance and each group in the nonsymbolic task
are shown in Figure 2B.
Conservative selection criterion
To evaluate the generalizability of the results to more severe forms of MD, analyses were repeated in subsamples selected according to a much stricter
criterion for MD (i.e., 10th percentile). Considering
the stricter criterion, the MD group comprised seven
children, and the MD+L group comprised 12 children.
The groups were matched with regard to intelligence and
age. Generally, the results replicated those obtained for the entire sample. The analysis that considered the strict group classiication criterion revealed no signiicant
differences among groups (p > .05) with regard to simple reaction times. The mean reaction times were 436.15 ms (SD = 81.15) in the control group, 448.29 ms (SD = 86.42) in the MD group, and 365.42 ms (SD = 116.82) in the MD+L group.
No differences in reaction time were found in either the nonsymbolic task (F [2, 48] = 1.499, MSE = 112736, p = .234, η² = .061) or symbolic task (F [2, 48]
= 2.30, MSE = 122231, p = .112, η² = .095). However, speciic comparisons among groups revealed signiicant differences between the MD group (mean = 1078 ms, SD= 157 ms) and MD+L group (mean = 840 ms, SD = 142 ms) in reaction times in the symbolic task (t14 = 3.11, p = .008, Cohen’s d = 1.58).
With regard to error rates, signiicant differences
among the three groups were observed in the nonsymbolic task (F [2, 48] = 4.35, MSE = .047, p =
.019, η² = .159). Corrected Bonferroni t-tests revealed
signiicant differences between the MD group (mean = 31%) and control group (mean = 20%, t(36) = -2.96, p = .005, Cohen’s d = 1.29). No signiicant differences were found when comparing the MD+L group (mean = 27%) with the other two groups (p > .05). Importantly, no signiicant differences in error rates were found in
the symbolic task (F [2, 48] = 0.527, MSE = 0.025, p =
.594, η² = .023).
A signiicant distance effect was found on reaction
time in the nonsymbolic task (F [1, 46] = 22.24, MSE = 246849, p < .001, η² = .326), but no signiicant
interaction between distance and group was observed (F [2, 46] = .188, MSE = 2090, p = .829, η² = .008), indicating a similar distance effect in all three groups. Similarly, a signiicant distance effect was found on
reaction time in the symbolic task (F [1, 46] = 18.65, MSE = 100069, p = .0001, η² = .308), but no signiicant
interaction between distance and group was observed
(F [2, 46] = 3.03, MSE = 16294, p = .059, η² = .126),
indicating a similar distance effect in all three groups. Signiicant distance effects were found on error
rates in the nonsymbolic task (F [1, 46] = 92.54, MSE = 1.11, p < .001, η² = .668) and symbolic task (F [1, 46]
= 12.06, MSE = .111, p = .001, η² = .214). However, no signiicant distance × group interaction was observed in the nonsymbolic task (F [2, 46] = 2.93, MSE = .035, p =
.063, η² = .113) or symbolic task (F [2, 46] = .001, MSE = .000128, p = .999, η² = .000).
Predictive effects of symbolic and nonsymbolic numerical representations on arithmetic achievement
To investigate the role of nonsymbolic and symbolic tasks in arithmetic achievement, a multiple linear regression was calculated with performance in the arithmetic achievement task (TDE) as the dependent
variable. Age, gender, intelligence, school grade,
distance effect, mean total reaction time, and the arcsine of the total error rate were the independent variables
in both the symbolic and nonsymbolic tasks. The intervening variables (i.e., age, gender, intelligence, and
school grade) were inserted in the model using the enter method, and the experimental variables were inserted in
the model using the stepwise method.
In the model that considered three groups together, the arcsine of the total error rate in the nonsymbolic task was the only experimental variable that remained in the model (B = -9.15, SE = 3.91, t [127] = -0.151, p = .02).
The other experimental variables were excluded from
the model (Table 3).
Linear multiple regressions were conducted
for each group separately. In the control group, all experimental variables were excluded from the model.
The only experimental variable that showed a marginally
signiicant result was the distance effect for error rates
in the nonsymbolic task (B = .135, t [127] = 1.79, p =
.07; Table 3). In the MD group, the only experimental
variable that remained in the model was the distance
effect for error rates in the symbolic task (Table 3). In the MD+L group, the experimental variable that
remained in the model was the arcsine of total errors in
the symbolic task (Table 3).
Discussion
In the present study the relative impact of symbolic and nonsymbolic magnitude processing on the development
of mathematics learning disabilities was investigated.
Children with isolated or associated math learning
dificulties and normal mathematics achievers matched
with regard to general intelligence and processing speed were selected from a large population and evaluated
for symbolic and nonsymbolic magnitude processing. No signiicant difference was found between groups in
response latencies in either the symbolic or nonsymbolic
task. In contrast, there were more errors in the MD group
especially the nonsymbolic task. Although the same trend was observed in the comparison between the MD+L and
control groups, the statistical comparison did not reach
signiicance. Moreover, no differences between the MD and MD+L groups were found in basic magnitude processing. A closer inspection of the distance effect in the
symbolic and nonsymbolic tasks revealed that children in all of tested groups presented a distance effect on both reaction times and error rates in both symbolic and
nonsymbolic tasks. Finally, a series of regression models
revealed that both symbolic and nonsymbolic magnitudes
appeared to speciically contribute to differences between children with and without MD. These results are discussed in more detail below.
With regard to the symbolic task, response latencies
did not differ across groups. In response accuracy, signiicant differences were revealed by the one-way
ANOVA when comparing the three groups, but these differences could not be replicated in the post hoc comparisons. Generally, one could argue that a failure to ind differences in response latencies and accuracy
between groups is attributable to a lack of sensitivity
of our symbolic magnitude task. However, several studies have reported signiicant differences in reaction
times in the symbolic task (De Smedt & Gilmore, 2011;
Iuculano et al., 2008; Landerl, Bevan, & Butterworth, 2004; Landerl & Kölle, 2009; Rousselle & Noël, 2007).
However, other studies that used the same set of stimuli and a comparable set of instructions as the present
study failed to ind signiicant differences in reaction
times (Landerl, Fussenegger, Moll, & Willburger,
2009; Mussolin et al., 2010). With regard to differences
between groups in response accuracy in the symbolic
task, results have also been quite mixed. Two studies that used one-digit numbers (Iuculano et al., 2008;
Rousselle & Noel, 2007) and one study that used two-digit numbers found higher error rates in the MD group
(Landerl & Kolle, 2009). Two other studies that used one-digit numbers failed to ind such differences (De Smedt & Gilmore, 2011; Mussolin et al., 2010).
The symbolic task used in the present study is comparable to the one used in most of the studies
mentioned above. Failure to ind signiicant differences in the present study may be attributable to task dificulty alone. Moreover, the signiicant distance effect found
on response latencies and accuracy in all of the groups
indicates that the MD and MD+L groups were able to
access magnitudes in the symbolic task at speed and
accuracy levels comparable to the control group. Again,
with regard to response latencies, one could argue that the lack of differences among groups is attributable to very
low task dificulty. Our results again appear to refute this
hypothesis because error rates in the symbolic task were
substantial in all of the groups, ranging from 11% in the control group to 16% and 18% in the MD+L and MD groups, respectively. This indicates that children with
and without MD in our study systematically activated magnitude representation in the symbolic task to a
comparable extent.
A signiicant distance effect was found on both
reaction times and error rates in all groups, regardless of
their mathematics achievement. This indicates that all
children correctly understood the task instructions and were able to access number magnitudes independently
of its format. Moreover, nonsigniicant interactions
between distance and group indicated that the distance
effect was equally pronounced in the three groups. With regard to response latencies and accuracy, conlicting
distance effect results have been published for MD
and control groups. Rousselle and Noël (2007) found
that children with MD had a smaller distance effect
than control subjects in the symbolic task. Mussolin et al. (2010) found that children with MD had a larger distance effect than control subjects. Discrepancies
among studies increase further when evaluating the
study by Landerl et al. (2009). These authors showed that although MD children were speciically slower
than typically developing children they did not show
a deviant or atypically large distance effect. Therefore, deinitive conclusions from the literature about a
Table 3. Linear multiple regression (enter and stepwise methods) for the Control, MD, and MD+L groups separately, with arithmetic achievement as the dependent variable
Group Measure B SE Beta T p
Control Age
Gender School grade Intelligence
Distance effect nonsymbolic
.399 .724 3.153 .871 5.83 .926 1.068 .895 1.026 3.257 .087 .053 .71 .066 .135 .431 .678 3.52 .849 1.791 .71 .5 .001 .399 .078 MD Age Gender School grade Intelligence
Distance effect symbolic
.302 .032 3.25 .203 5.25 .356 .474 .352 .399 2.43 .083 .003 .868 .028 .138 .848 .068 9.22 .598 2.16 .402 .946 0 .554 .03 MD+L Age Gender School grade Intelligence Error symbolic 1.31 2.67 4.51 .325 -11.7 1.1 1.307 1.28 .793 4.88 .493 .243 1.47 .053 -.382 1.189 2.046 3.526 .41 2.39 .269 .075 .008 .692 .038
difference between MD children and control subjects
with regard to the distance effect are still elusive. To some extent, absence of signiicant differences in the
symbolic task between the MD and control groups and
inconsistencies in the literature do not it the predictions derived from the disconnection hypothesis. According
to this view, robust differences between MD children and control subjects should be observed foremost in the
symbolic task. However, these indings are compatible with the core deicit hypothesis that predicts stronger deicits in the nonsymbolic task.
In the nonsymbolic task, differences in response
latencies among groups also did not reach signiicance.
These results are consistent with most studies that compared reaction times between children with
mathematics learning dificulties and controls in the
nonsymbolic task (De Smedt & Gilmore, 2011; Iuculano
et al., 2008; Landerl & Kölle, 2009; Piazza et al., 2010; Rousselle & Noël, 2007; but see Landerl et al., 2009). Importantly, some studies that failed to report signiicant
differences in response latencies in the nonsymbolic task used a set of numerical stimuli in the range of 1
to 9 (Iuculano et al., 2008; Mussolin et al., 2010; De Smedt & Gilmore, 2011). At least partially, failure to ind signiicant differences among groups in these
studies may be attributable to the occurrence of more perceptual phenomena such as subitizing (Mandler &
Shebo, 1982; Piazza et al., 2010) that may have masked
the occurrence of a distance effect in the numerical range
of 1 to 4. However, in the present study the numerical
range used in the nonsymbolic task was far beyond
the subitizing range. For this reason, negative results
obtained in the present study may not be attributable to confounds by the more perceptual aspects of magnitude
processing. Interestingly, an inspection of the studies
that used stimuli within the same magnitude range as the
present study reveals contradictory evidence. Landerl et al. (2009) found differences in reaction times between children with and without MD, but Rousselle and Noël (2007), Landerl and Kölle (2009), and Piazza et al. (2010) failed to report such differences. These previous
studies and the present study used comparable stimulus sets, task instructions, and selection criteria for sample
assignment. Therefore, explaining why only Landerl et al. (2009) were able to ind signiicantly slower response latencies in MD children is dificult. Future studies should use more sensitive methods (e.g., the Weber fraction) to investigate possible deicits in magnitude processing in MD (Piazza et al., 2010; Mazzocco, Feigenson, & Halberda, 2011).
In contrast to the nonsigniicant results obtained in the symbolic task, signiicantly higher error rates were
observed in the nonsymbolic task in the MD group
than in the control group. These indings indicate a deicit in nonsymbolic representation in the MD group compared with the control group (Landerl et al., 2009; Mazzocco et al., 2011; Mussolin et al., 2010; Piazza et al., 2010). Although differences between the MD
group and control group in the nonsymbolic task can be
conciliated with the disconnection hypothesis, they also
better it the predictions of the core deicit hypothesis because deicits observed in the symbolic task failed to reach signiicance.
To investigate the stability of our results with regard to symbolic and nonsymbolic magnitude processing across more or less conservative criteria for
the classiication of mathematics learning dificulties,
we selected a subsample of children who presented a
more severe form of MD. Generally, these comparisons conirmed the pattern of results found with the more liberal classiication criterion (i.e., 25th percentile).
The MD group presented higher error rates in the
nonsymbolic task compared with the control group.
A further inspection of the effect size found in this comparison revealed more robust differences between the control group and the subsample with severe MD (Cohen’s d = 1.29) than between the control group and the entire MD sample (Cohen’s d = 0.70). Interestingly,
Mazzocco et al. (2011) found the same effect size when
performing the same comparison between controls and MD children with regard to the acuity of the
approximate number system using the Weber fraction.
These results suggest that differences in accuracy in
nonsymbolic magnitude processing relect a deicit in core magnitude representation (Piazza et al., 2010). A
possible exception to the pattern of effects found when
using the more conservative classiication was the comparison between the MD+L and control groups.
However, further analyses of these data using an inverted
eficiency score (Iuculano et al., 2008) did not conirm the existence of any differences. Apparently, the MD+L
group tended to respond more quickly than the MD group in the symbolic task, but also committed more
errors. These differences between groups were far from signiicant in the nonsymbolic task. This may indicate a particular deicit in the MD+L group when manipulating symbolic stimuli. Together our results for response
latencies, accuracy, and the distance effect in symbolic
and nonsymbolic tasks are compatible with a deicit
in the approximate number system in MD children,
independent of the classiication criterion used to classify them. These analyses corroborate the existence of a statistically signiicant deicit in nonsymbolic
magnitude processing, whereas differences between the MD and control groups in symbolic magnitude
comparison were less pronounced. To what extent is
performance in symbolic and nonsymbolic tasks related to more general mathematics achievement?
Regression models showed that nonsymbolic magnitude processing explained individual differences in school mathematics better than measures of symbolic processing when considering all of the children
together. Similar but less robust results were obtained
when considering the regression model for the control
group only. No predictor related to number processing reached signiicance in the control group. However,
error rates in the nonsymbolic task were the only
that approached signiicance. Importantly, discrepant results were obtained by Holloway and Ansari (2009).
After controlling for general abilities, these authors found that the distance effect that arose from reaction times in the symbolic task was the best variable to explain mathematical achievement in a group of typically
achieving 6- to 8-year-old children. However, the
nonsymbolic task in that study included magnitudes in
the range of 1 to 9, which can be discriminated easier and
consequently activate the approximate number system
less than higher numerical intervals. This may have
reduced the demands on the approximate number system and reduced the sensitivity of the nonsymbolic task to individual differences in mathematics achievement in
the study by Holloway and Ansari (2009). Together our
results suggest that nonsymbolic magnitude processing can explain mathematics achievement independently of
the actual level of performance presented by children.
Moreover, the results suggest that nonsymbolic number
magnitude is a more speciic predictor of mathematics achievement than symbolic magnitude.
Analysis of the regression models for each group
separately revealed another pattern of results. Symbolic processing was the only variable speciically related to
number processing that explained individual differences
in low mathematics achievers. Are these results
consistent with the disconnection hypothesis? Our results indicate that symbolic magnitude is more important for explaining mathematics learning in children with
particularly low mathematics achievement. However,
the MD group should then present more pronounced
deicits in the symbolic task, and these deicits
should explain mathematics achievement better than
performance in the nonsymbolic task. The MD group was not signiicantly impaired in symbolic processing. Although ANOVA suggested the presence of signiicant
differences between groups and the absolute difference in errors between the control and MD groups was
approximately 7%, pairwise comparisons did not reveal a signiicant difference. Furthermore, performance in
the symbolic task explained mathematics performance
only for the MD group and not for the control group.
Considering these results, our data cannot be interpreted
as consistent with an access deicit. However, the present results may be consistent with Halberda et al. (2008), in which deicits in nonsymbolic representation may interfere with symbolic mathematics learning. We found that the MD and MD+L groups committed more
errors in the symbolic task, but this difference was not
suficiently large to reach statistical signiicance. This suggests that symbolic representation is not signiicantly impaired in MD.
Considering that symbolic representation is slightly preserved in MD, this representation is used by MD children as a compensatory strategy to deal with the pronounced impairment observed in nonsymbolic
representation. Considering that nonsymbolic
representation is an important predictor of mathematics achievement demonstrated in the global regression
model, symbolic representation may be used as a kind of “compensatory number line” utilized to solve
mathematical problems. For children with preserved nonsymbolic processing (i.e., the control group), this representation predicts arithmetic performance. This
result favors the hypothesis that lower acuity of the
approximate number system is a core deicit of MD (Dehaene & Cohen, 1997; Halberda et al., 2008).
However, the disconnection hypothesis also predicts
more pronounced deicits in symbolic tasks than in nonsymbolic tasks, which was not observed in our study.
In conclusion, children with MD appeared to be able to access magnitude representations via both symbolic and nonsymbolic tasks, but they were less accurate than typically achieving children in
nonsymbolic processing than in symbolic processing.
Generally, nonsymbolic processing also appears to predict mathematics achievement more accurately
than symbolic processing. However, when considering
low-achieving children only, symbolic processing predicted mathematics achievement more accurately
than nonsymbolic processing. For these reasons, basic
magnitude representations of the approximate number system appear to be a more general predictor of mathematics achievement, whereas symbolic magnitude
representation appears to compensate for deicits in the approximate number system.
Acknowledgements
G.W. is supported by a grant from the FWF der Wissenschaftsfond (nr. P22577). V.G.H. is supported by grants from CAPES/DAAD. Probal Program, CNPq (307006/2008-5,401232/2009-3), and FAPEMIG (APQ-02755-SHA, APQ-03289-10).
Competing Interests
The authors declare that they do not have any
inancial or noninancial competing interests.
References
American Psychiatric Association (1994). Diagnostic and statistical manual of mental disorders, 4th edition. Washington, D. C.: American Psychiatric Press.
Angelini, A. L., Alves, I. C. B., Custódio, E. M., Duarte, W. F., & Duarte, J. L. M. (1999). Matrizes progressivas coloridas de Raven—escala especial. São Paulo: Centro Editor de Testes e Pesquisas em Psicologia.
Brasil, H. H. A. (2003). Versão Brasileira da Entrevista Semi-Structured Schedule for Affective Disorders and Schizophrenia for School-Age Children: Present and Lifetime Version (K-SADS-PL) (Tese de doutoramento). São Paulo: Universidade Federal de São Paulo.
Brysbaert, M. (1995). Arabic number reading: on the nature of the numerical scale and the origin of phonological recoding. Journal of Experimental Psychology: General, 124, 434-452.
Butterworth, B. (2005). Developmental dyscalculia. In J. I. D. Campbell (Ed.), Handbook of mathematical cognition (pp. 455-467). Hove: Psychology Press.
Butterworth, B., Varma, S., & Laurillard, D. (2011). Dyscalculia: From brain to education. Science, 332, 1049-1053.
Dehaene, S. (1992). Varieties of numerical abilities. Cognition, 44,
1-42.
Dehaene, S. (2009). Origins of mathematical intuitions: the case of arithmetic. Annals of the New York Academy of Sciences, 1156,
232-259.
Dehaene, S., & Cohen, L. (1997). Cerebral pathways for calculation:
Double dissociation between rote verbal and quantitative
knowledge of arithmetic. Cortex, 33, 219-250.
Dehaene, S., Izard, V., & Piazza, M. (2005). Control over non-numerical parameters in numerosity experiments. Unpublished manuscript. Available at www.unicog.org; accessed April 23, 2012. Feigenson, L., Dehaene, S., & Spelke, E. (2004). Core systems of
number. Trends in Cognitive Sciences, 8, 307-314.
Geary, D. C., & Hoard, M.K. (2005). Learning disabilities in arithmetic and mathematics: Theoretical and empirical perspectives. In J. I. D. Campbell (Ed.), Handbook of mathematical cognition (pp. 253-267). New York: Psychology Press.
Halberda, J., Mazzocco, M. M., & Feigenson, L. (2008). Individual
differences in non-verbal number acuity correlate with math
achievement. Nature, 455, 665-668.
Holloway, I. D., & Ansari, D. (2009). Mapping numerical magnitudes
onto symbols: The numerical distance effect and individual
differences in children’s mathematics achievement. Journal of
Experimental Child Psychology, 103, 17-29.
Iuculano, T., Tang, J., Hall, C. W. B., & Butterworth, B. (2008).Core information processing deicits in developmental dyscalculia and low numeracy. Developmental Science, 11, 669-680.
Jordan, N. C., Hanich, L. B., & Kaplan, D. (2003). A longitudinal study of mathematical competencies in children with speciic mathematics dificulties versus children with comorbid mathematics and reading dificulties. Child Development, 74, 834-850.
Landerl, K., Bevan, A., & Butterworth, B. (2004). Developmental dyscalculia and basic numerical capacities: A study of 8-9-year-old students. Cognition, 93, 99-125.
Landerl, K., Fussenegger, B., Moll, K., & Willburger, E. (2009).
Dyslexia and dyscalculia: Two learning disorders with different
cognitive proiles. Journal of Experimental Child Psychology, 103,
309-324.
Landerl, K., & Kölle, C. (2009). Typical and atypical development of basic numerical skills in elementary school. Journal of Experimental Child Psychology, 103, 546-565.
Lefevre, A. B., & Diament, A. J. (1982). Epidemiologia em neurologia infantil: Estudo dos diagnosticos mais comuns. Revista do Hospital das Clínicas Faculdade de Médica de São Paulo, 37, 199–205. Mandler, G., & Shebo, B. J. (1982). Subitizing: An analysis of its
component processes. Journal of Experimental Psychology: General, 111, 1-22.
Mazzocco, M. M., Feigenson, L., & Halberda, J. (2011). Impaired
acuity of the approximate number system underlies mathematical
learning disability (dyscalculia). Child Development, 82,
1224-1237.
Murphy, M. M., Mazzocco, M. M., Hanich, L. B., & Early, M. C. (2007). Cognitive characteristics of children with mathematics
learning disability (MLD) vary as a function of the cutoff
criterion used to deine MLD. Journal of Learning Disabilities,
40, 458-478.
Mussolin, C., Mejias, S., & Noël, M. P. (2010). Symbolic and
nonsymbolic number comparison in children with and without
dyscalculia. Cognition, 115, 10-25.
Nuerk, H. C., Weger, U., & Willmes, K. (2001). Decade breaks in the
mental number line? Putting the tens and units back in different
bins. Cognition, 82, B25-B33.
Piazza, M., Facoetti, A., Trussardi, A. N., Berteletti, I., Conte, S., Lucangeli, D., Dehaene, S., & Zorzi, M. (2010). Developmental
trajectory of number acuity reveals a severe impairment in
developmental dyscalculia. Cognition, 116, 33-41.
Rousselle, L., & Noël, M. P. (2007). Basic numerical skills in children
with mathematics learning disabilities: A comparison of symbolic
vs. nonsymbolic number magnitude processing. Cognition, 102,
361-395.