Catarina Máximo Serpa Carvalho
Licensed in Biomedical Engineering
Gene Expression Analysis in Cardiac and Adipose
Derived Fibroblasts: potential influence of origin and
in vitro
culture
Dissertation for a Master’s Degree in Biomedical Engineering
Orientadora:
Doutora Maria Alexandra Núncio de Carvalho Ramos Fernandes,
Departamento de Ciências da Vida, Faculdade de Ciências e
Tecnologia, Universidade Nova de Lisboa
Co-orientador:
Priv.-Doz. Ph.D. Harald Lahm, Department of Cardiovascular
Surgery, Division of Experimental Surgery, German Heart Center
Munich, Technische Universität München
Júri :
Presidente: Doutora Célia Maria Reis Henriques
Arguentes: Doutor Pedro Miguel Ribeiro Viana Baptista
Vogais: Doutora Maria Alexandra Núncio de Carvalho
iii
Gene Expression Analysis in Cardiac and Adipose Derived Fibroblasts: potential
influence of origin and in vitro culture
Copyright © Catarina Máximo Serpa Carvalho, Faculdade de Ciências e Tecnologia,
Universidade Nova de Lisboa.
A Faculdade de Ciências e Tecnologia e a Universidade Nova de Lisboa têm o direito, perpétuo
e sem limites geográficos, de arquivar e publicar esta dissertação através de exemplares
impressos reproduzidos em papel ou de forma digital, ou por qualquer outro meio conhecido ou
que venha a ser inventado, e de a divulgar através de repositórios científicos e de admitir a sua
cópia e distribuição com objectivos educacionais ou de investigação, não comerciais, desde
v
ACKNOWLEDGEMENTS
Foremost, I would like to thank Ph.D. Alexandra Fernandes who stood by me as my supervisor
at Faculdade de Ciências e Tecnologia, Universidade Nova de Lisboa, with advice and support,
during the research process and writing of this master thesis.
I would also like to thank Priv.-Doz. Ph.D. Harald Lahm, my external supervisor, who guided me
through both practical work, as well as the writing and analysis.
Furthermore, I must express my gratitude to Priv.-Doz. MD Markus Krane for welcoming me at
the German Heart Centre Munich and endorsing this new interesting project. I’m also thankful
for all the collaborations of the Experimental Surgery Unit at the German Heart Centre Munich,
who were always available, and provided exceptional practical help. Thanks to them, my
scientific and social skills in the laboratory were improved.
I would like to acknowledge Ph.D. Salomé Almeida, whose help in the genetics analysis part of
this work was invaluable. I am gratefully indebted to her, for her very valuable comments on this
thesis, as well as her patient guidance, encouragement and advice.
In particular, I am grateful to Ph.D. Sofia Duque, who introduced me to research, strongly
contributing to this project choice.
I would like to specially thank FCT UNL for giving me the opportunity to do this Erasmus
internship abroad, accomplishing this work as my masters’ project, pushing me to try harder,
and motivating me to pursue research in the future.
Last but not least, thank you to my family, who provided me with unfailing support and
continuous encouragement in my studies in Lisbon, and abroad, throughout these years. Thank
you for always supporting me in every way, this accomplishment would not have been possible
without you.
vii
ABSTRACT
Cardiac fibroblasts represent one major cell population in the heart, and are responsible for
many important cardiac functions. They also arise from different cardiac lineages, suggesting
that they are primed to transdifferentiation, and may be directly involved in cardiogenesis.
The objective of this study was to achieve a detailed analysis of the transcriptional activity of
human cardiac fibroblasts, derived from right and left atrium, assuming a possible contribution
of the fibroblast population in cardiac development.
Cardiac samples were collected, both from adult patients, suffering from coronary and valvular
heart disease, and from infant patients suffering from congenital heart disease. Control
fibroblasts from adipose tissue, of the same patient, were cultured as a reference. Gene
expression was evaluated by reverse transcriptase quantitative polymerase chain reaction
(RT-qPCR), and subsequently subjected to data analysis. The gene expression was compared
between cardiac, and adipose-derived fibroblasts. In addition, the results were analysed
according to age, and different cell passages.
Gene expression comparison between atrial cardiac fibroblasts (CF) and their respective
adipose tissue fibroblasts (AF), show that certain cardiac transcription factors, such as GATA5,
are only expressed in CFs and absent in AFs. Only in children, the same occurs for GATA4 and
WT1. However, typical fibroblast markers like CD90 or DDR2, seem to have a higher
expression level in AFs. Age-dependent effects are small if any. Passage 0 (P0) fibroblasts,
usually show higher gene expression levels than passage 2 (P2) fibroblasts.
Interestingly, in vitro cell culture appears to affect gene expression. Therefore, it is important to
use unbiased approaches for gene expression analysis such as directly use ex vivo purified
cardiac fibroblasts. Further gene expression studies, focused on diagnoses, may contribute to
gene interference in cell culture differences. The eventual possibility of using fibroblasts in
cardiac regeneration strongly encourages further research in this area.
Keywords
ix
RESUMO
Os fibroblastos cardíacos são a principal população de células no coração, e são responsáveis
por muitas funções cardíacas importantes. Também são provenientes de linhagens cardíacas
diferentes, sugerindo que estão predispostos para a transdiferenciação e podem estar
diretamente envolvidos na cardiogénese.
O objectivo deste estudo foi realizar uma análise detalhada da actividade transcripcional dos
fibroblastos cardíacos humanos, provenientes da aurícula direita e esquerda, assumindo uma
possível contribuição da população de fibroblastos no desenvolvimento cardíaco.
Foram recolhidas amostras cardíacas, provenientes de doentes adultos, com patologia de
doença coronária e valvular, e de crianças com patologias cardíacas congénitas. Tendo sido
usados como referência, fibroblastos de controle de tecido adiposo do mesmo doente.
Relativamente à metodologia usada, após os testes de reacção de transcriptase reversa
RT-qPCR (quantitative Reverse Transcriptase Polymerase Chain Reaction), procedeu-se a uma
análise de dados. Finalmente, foi efectuada uma comparação do padrão de expressão entre
fibroblastos cardíacos (CF) e de tecido adiposo (AF). Os resultados foram comparados tendo
em conta os grupos etários, e as diferentes passagens.
Em relação ao perfil de análise de expressão genética dos CF de crianças e adultos, em
comparação com os respectivos AF, os resultados mostram que certos factores de transcrição,
como o GATA5, é apenas expresso em CFs e não nos AFs. O mesmo acontece apenas em
amostras de crianças para GATA4 e WT1. No entanto, os marcadores de fibroblastos típicos,
como CD90 ou DDR2, parecem ter um nível maior expressão nos AFs. Os efeitos dependentes
da idade são baixos, não sendo significativos. Os fibroblastos da passagem 0 (P0), mostram
geralmente níveis de expressão mais elevadas do que os da passagem 2 (P2).
Curiosamente, a cultura in vitro parece afectar a expressão genética, pelo que, futuramente, a
análise da expressão dos genes, deverá ser efectuada ex vivo, usando directamente,
fibroblastos cardíacos purificados. Estudos futuros de expressão genética, focados nos
diagnósticos, poderão contribuir para uma melhor compreensão da interferência genética na
cultura de células. A eventual possibilidade do uso de fibroblastos na regeneração cardíaca,
incita a uma maior investigação nesta área.
Palavras-Chave
x
xi
TABLE OF CONTENTS
ACKNOWLEDGEMENTS ... V
ABSTRACT ... VII
RESUMO ... IX
TABLE OF CONTENTS ... XI
LIST OF FIGURES ... XIII
LIST OF TABLES ... XV
LIST OF EQUATIONS ... XVII
LIST OF ABBREVIATIONS ... XIX
1.
INTRODUCTION ... 1
1.1 Heart Development ... 1
1.2 Fibroblasts ... 2
1.2.1. Cardiac Fibroblasts ... 3
1.2.2. Fibroblasts Markers ... 5
1.3 Heart Disease ... 5
1.3.1 Congenital Heart Disease ... 6
1.3.2. Heart Disease in Adults ... 8
1.4 Scope ... 8
2.
MATERIALS ... 11
2.1. Chemicals and Reagents ... 11
2.2. Equipment ... 12
2.3. Kits ... 13
2.4. Produced Media and Solutions ... 13
2.5. Antibodies and Serum Used ... 14
2.6. Biological material ... 14
3.
METHODS ... 15
3.1. Establishment of primary cardiac and adipose fibroblast cultures ... 15
3.1.1. Cell Culture ... 15
3.1.2. Protocol used ... 16
3.1.3. Cell passaging ... 17
3.2. RNA Extraction ... 18
3.3. cDNA synthesis ... 19
xii
3.5. Reverse Transcriptase - Quantitative Polymerase Chain Reaction (RT-qPCR) with
SybrGreen ... 21
3.5.1. Principle of RT-qPCR ... 21
3.5.2. Quantification of RT-qPCR samples by means of Standard Curves ... 23
3.5.3. Normalisation with housekeeping gene b-Actin ... 23
3.5.4. Agarose Gel Electrophoresis ... 24
3.5.5. Data Analysis ... 25
3.6. Immunostaining ... 25
3.6.1. Immunocytochemistry ... 26
3.6.2. Immunohistochemistry ... 26
4.
RESULTS ... 29
4.1. Primary cardiac and control fibroblast cultures ... 29
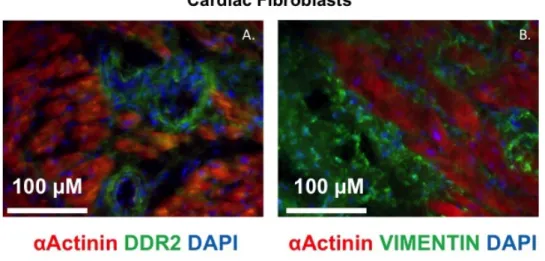
4.2. Immunostaining ... 30
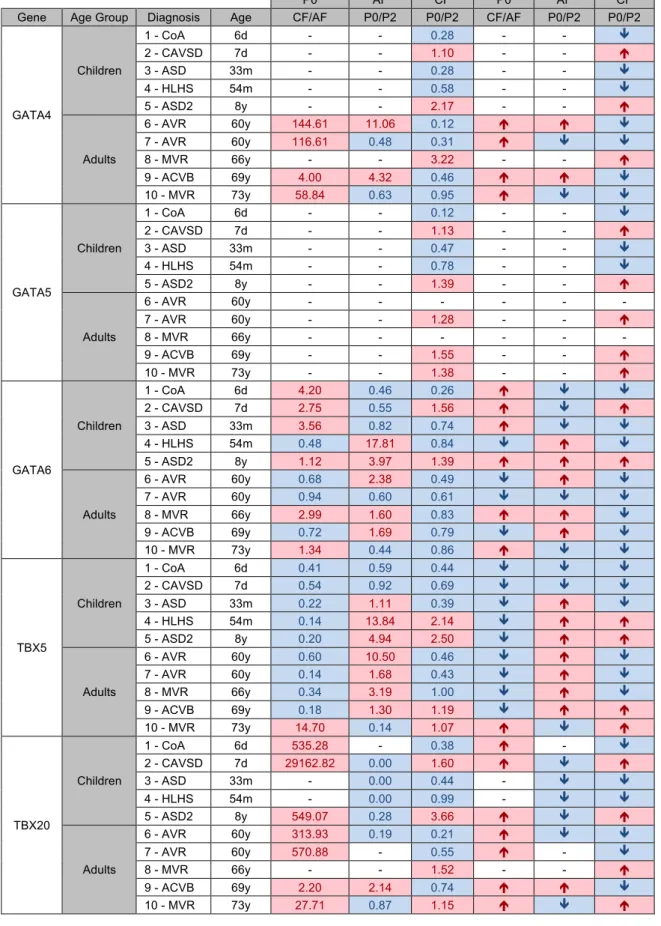
4.3. Gene expression ... 33
4.3.1. Comparison between AF and CF ... 39
4.3.2. Comparison between Passages zero and two ... 41
4.3.3. Comparison between Children and Adults ... 46
5.
DISCUSSION ... 49
5.1. Analysis of Comparison between AF and CF ... 49
5.2. Analysis of Comparison between Passages zero and two ... 51
5.3. Comparison between Children and Adults ... 53
6.
CONCLUSION ... 63
6.1. AF vs. CF ... 63
6.2. Culture ... 65
6.3. Children vs. Adults ... 66
REFERENCES ... 69
ATTACHMENTS ... 75
Attachment A - List of consumables, software and used primers ... 75
Attachment B - Standard curve for CD90 ... 77
Attachment C - RT-qPCR Gene Expression Results ... 79
Attachment D – Review of 14 studied genes ... 83
xiii
LIST OF FIGURES
Figure 1.1 - Photograph of AF at P0 from a child after 4 days in culture, ... 3
Figure 1.2 - Experimental procedure representation ... 9
Figure 3.1 - Cell Culture Procedure ... 15
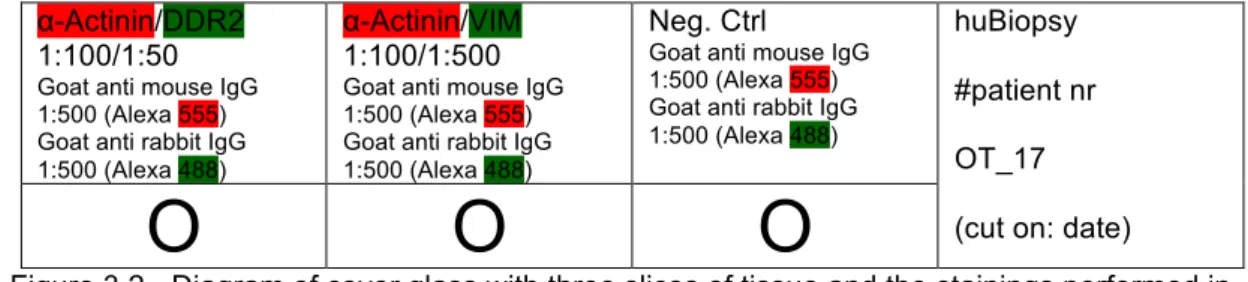
Figure 3.2 - Diagram of cover glass with three slices of tissue and the stainings performed in IHC. ... 27
Figure 4.1 - Photograph of confluent AF at P0 after a week in culture from a child sample, ... 29
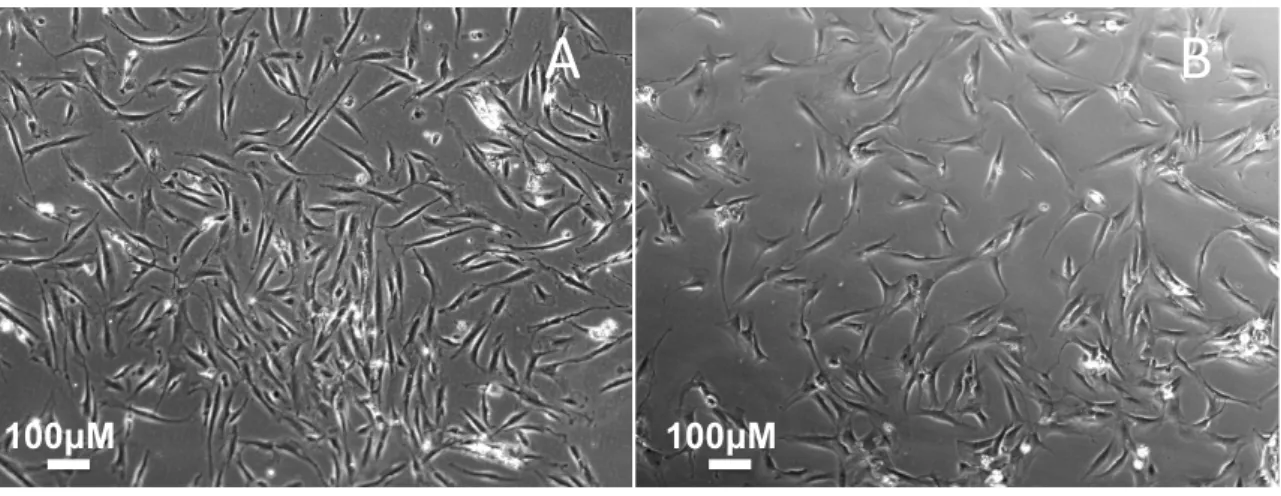
Figure 4.2 - Photographs of AF (A) and CF (B, right atrium) at P0 after 3 days of culture from a child. ... 30
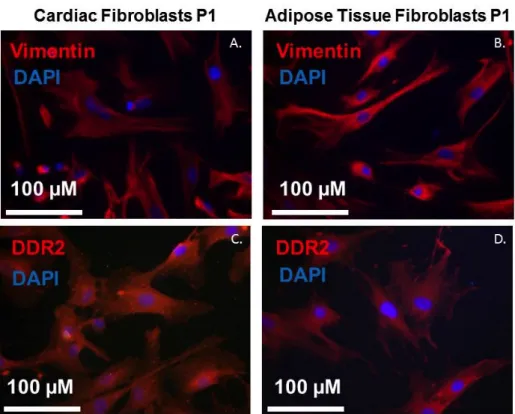
Figure 4.3 - Immunocytochemistry results ... 31
Figure 4.4 - Immunohistochemistry results ... 32
Figure 4.5 - Graphs of CF/AF ratio for P0, for cardiac genes. ... 39
Figure 4.6 - Graphs of CF/AF ratio for P0, for epicardial genes. ... 40
Figure 4.7 - Graphs of CF/AF ratio for P0, for fibroblasts markers. ... 40
Figure 4.8 - Graphs of CF/AF ratio for P0, for endothelial and mesenchymal markers. ... 41
Figure 4.9 - Graphs of P0/P2 ratio for AF, for cardiac genes. ... 42
Figure 4.10 - Graphs of P0/P2 ratio for CF, for cardiac genes. ... 43
Figure 4.11 - Graphs of P0/P2 ratio for AF, for epicardial genes. ... 44
Figure 4.12 - Graphs of P0/P2 ratio for CF, for epicardial genes. ... 44
Figure 4.13 - Graphs of P0/P2 ratio for AF, for fibroblasts markers. ... 45
Figure 4.14 - Graphs of P0/P2 ratio for CF, for fibroblasts markers. ... 45
Figure 4.15 - Graphs of P0/P2 ratio for AF, for endothelial and mesenchymal markers ... 46
Figure 4.16 - Graphs of P0/P2 ratio for CF, for endothelial and mesenchymal markers ... 46
Figure 5.1 - Heatmap of gene expression of all tested genes in all patients ... 49
Figure 5.2 – Gene Interaction ... 54
Figure 5.3 – Heatmap of gene expression of cardiac genes in all patients ... 55
xiv
Figure 5.5 - Heatmap of gene expression of fibroblasts markers in all patients ... 59
Figure 5.6 - Heatmap of gene expression of endothelial and mesenchymal markers in all
xv
LIST OF TABLES
Table 2-1 - Chemicals and reagents ... 11
Table 2-2 - Equipment ... 12
Table 2-3 - Kits ... 13
Table 2-4 - Produced Media and Solutions ... 13
Table 2-5 - Antibodies and serum used ... 14
Table 3-1 - List of the diagnosis of the collected samples ... 16
Table 3-2 - cDNA synthesis protocol. ... 20
Table 3-3 - Mastermix composition for a RT-qPCR, for one sample. ... 22
Table 3-4- RT-qPCR Operating conditions ... 22
Table 3-5 - Dilution series for a standard curve ... 23
Table 3-6 - Composition List ... 24
Table 4-1 - Results of ratio analysis between tissue and passages, for cardiac genes. ... 35
Table 4-2 - Results of ratio analysis between tissue and passages, for epicardial genes. ... 36
Table 4-3 - Results of ratio analysis between tissue and passages, for fibroblasts markers ... 37
Table 4-4 - Results of ratio analysis between tissue and passages, for other markers. ... 38
xvii
LIST OF EQUATIONS
Equation 3-1 - RNA Volume per sample ... 20
Equation 3-2 - Amplified PCR-products ... 23
xix
LIST OF ABBREVIATIONS
ACVB Aorto-coronary vein bypass
AF adipose derived fibroblasts
aq. bidest double distilled water
ASD Atrial Septal Defect
ASDII Atrial Septal Defect Secundum
AVR Aortic valve replacement
CAVSD Complete Atrium Ventricle Septum Defect
CD105 Cluster of Differentiation 105
CD90 Cluster of Differentiation 90
cDNA complementary DNA
CF cardiac fibroblasts
CHD Congenital Heart Disease
CoA Coarctation of the aorta
DDR2 Discoidin domain-containing receptor 2
DMEM Dulbecco´s Modified Eagle Medium
DNA Deoxyribonucleic acid
dNTP deoxyribose nucleoside triphosphate
EDTA Ethylenediamine tetraacetic acid
EMT Epithelial-to-mesenchymal transformation
EPDC Epicardium-derived cell
FCS Fetal Calf Serum
GATA4 GATA-binding protein 4
GATA5 GATA-binding protein 5
GATA6 GATA-binding protein 6
xx
HKG House Keeping Gene
HLHS Hypoplastic left heart syndrome
ICC Immunocytochemical staining
IHC Immunohistochemical staining
M-MLV-RT Moloney Murine Leukemia Virus Reverse Transcriptase
MVR Mitral valve repair
P Passage
PBS Phosphate buffered saline
PDGRFΑ Platelet Derived Growth Factor Alpha
Pen/Strep Penicillin/Streptomycin
PFA Paraformaldehyde
POSTN Periostin
RNA Ribonucleic acid
RPMI Roswell Park Memorial Institute Medium
RT-qPCR Reverse Transcriptase Quantitative Polymerase Chain Reaction
TBE Tris/Borate/EDTA
TBX18 T-box Transcription factor 18
TBX20 T-box Transcription factor 20
TBX5 T-box Transcription factor 5
TCF21 Transcription factor 21
VIM Vimentin
1
1. INTRODUCTION
The cardiovascular system is one of the most important systems in the human body, as it is
essential for the distribution of nutrients and oxygen to all cells of the body. During embryonic
development, the heart is the first organ to develop. Cardiogenesis is a complex,
well-orchestrated series of processes, including specification, proliferation, migration, and
differentiation (1). Accordingly,, cardiac development is exquisitely sensitive, as any
perturbation in the cells involved in this process leads to cardiac malformations. These
frequently result in the death of the embryo (2). If, instead, the child is born, congenital
abnormalities in cardiac growth, contractility and vascularity, will affect the child wellbeing,
leading to an early life filled with medical interventions and a poor quality of life. If the
malformations are too extreme death will occur (3).
1.1 Heart Development
Heart development has been considerably studied in mice, towards understandingt this
process, to determine the biological pathways and responsible genes involved, as well as
lineage tracing (1).
Cardiac development starts with the formation of the precardiac mesoderm. At embryonic day
6.5 (E6.5), gastrulation takes place and mesoderm cells migrate anteriolaterally to form
bilaterally paired heart fields. At E7.75 the two fields meet, forming the cardiac crescent, also
denominated as the first heart field (1). In this location, primary cardiac progenitor cells will
contribute to left ventricle and atria (3). The second heart field is derived from the pharyngeal
mesoderm, and contributes primarily to the right ventricle and outflow tract (4). They also
contribute a majority of cells to the atria (5). Both halves of the cardiac crescent migrate to build
the linear heart tube by E8. By E9.5, the heart looping occurs, in which the primitive heart tube
loops asymmetrically. This rightward looping, and differential growth, brings the primitive heart
chambers into alignment before their future integration. This process ends, when the main
regional divisions of the mature heart and primordium of the great arterial trunks become
established preceding septation, by E10.5 (1). The four-chambered heart starts to form,
beginning with neural crest cells migrating into the heart. Resulting from a derivation of cells
from cardiac muscle cells, the development of the conduction system follows. Cardiac chamber
is formed (atria and ventricles), and septa construction occurs, a process in which atrial and
ventricular septum are generated and organized, to separate these four enclosed cavities within
the heart (6). Along with smooth muscle cells, the venous and arterial vasculature is modulated.
Finally, valves and endocardium, originated by endothelial cells, are formed (3).
Examples of transcription factors, expressed by primary cardiac progenitor cells, are GATA
Binding Protein 4/5/6 (GATA4/5/6), and T-box transcription factor 5/20 (TBX5/20) will be studied
2
The GATA family factors constitute a family of zinc finger DNA binding proteins that control the
development of diverse tissue-specific profiles by activating or repressing transcription (7) (8).
These transcriptional factors control gene expression and differentiation in a variety of cell
types, along with cellular maturation; proliferation and survival (9) (10).
GATA4 encodes a transcriptional activator that plays a key role in cardiac development. It is
expressed in adult heart and during embryonic development it is expressed from E7.5
(formation of first heart field) until E10.5 (when the four-chambered heart is formed) (11).
GATA5 is required during cardiovascular development and is known for playing an important
role in smooth muscle cell diversity. Regarding GATA6, it is expressed during early
embryogenesis and localizes to endo- and mesodermally derived cells during later
embryogenesis, around E13.5 (12) (13) (14). Other than the heart it also plays an important role
in gut and lung development. Highest levels of expression were seen in smooth muscle cells of
the aorta and pulmonary artery, but also in atrial and ventricular myocardium (12).
TBX5 plays a role in heart development and specification of limb identity. It encodes a
DNA-binding protein that regulates the transcription of several genes and is involved in heart
development and limb pattern formation. TBX5 is expressed in the embryonic heart from E8,
when the cardiac crescent migrates to form the linear heart tube, to E10.5, when the
four-chambered heart is formed (7). TBX20 is present in the cardiac progenitor differentiation
pathway and heart development. It plays a role in endoderm formation and branching involved
in blood vessel morphogenesis (15) (16).
These five transcription factors act interactively and collaboratively in cardiac development. This
regulatory network of transcription factors controls the responses to intrinsic, and extrinsic
inductive factors, which establish patterns, and guide morphogenesis (17).
1.2 Fibroblasts
Fibroblasts are typically identified by their spindle-shaped flattened morphology and ability to
adhere to culture plates, as seen in figure 1.1. Fibroblasts synthesize most of the extra cellular
matrix (ECM) of connective tissue (fibrillar collagens and fibronectin). Their nuclei are large and
euchromatic and, possess prominent nucleoli. Fibroblasts are characterized as being
nonvascular, non-epithelial, and non-inflammatory cells (18). Other than their main function,
structural, these cells are also known for their part in inflammation regulation, and wound
3
Figure 1.1 - Photograph of AF at P0 from a child after 4 days in culture, with 10x. The image was not edited.
As a heterogenous population, fibroblasts are widely distributed in numerous tissues of the
vertebrate organism, being associated with various forms of connective tissue and repairing
function. However, fibroblasts from differing anatomic sites have distinct transcriptional patterns
and, may even exhibit different morphology. Lipid metabolism, cell signalling pathways that
control proliferation, cell migration and cell fate determination are other functions that can vary.
1.2.1. Cardiac Fibroblasts
Fibroblasts, along with cardiomyocytes, smooth muscle cells and endothelial cells, are the
resident cell populations in the adult heart. They form a major cell population in the heart (up to
two-thirds in a normal adult heart), which is largely interspersed in the collagen network. (21).
Cardiac fibroblasts (CF) serve diverse functions in the heart providing structural, mechanical,
electrical, and biochemical contributions (6). CF are responsible for synthesis and maintenance
of a 3D scaffold for cardiomyocytes, which insures the functional integrity of the myocardium. In
addition, CF also have the ability to sense mechanical stress through multiple pathways,
including integrins, ion channels, and secondary messenger responders. Finally, mechanical
stimulation may result in ECM gene expression, growth factor production, and collagenase
activity (22).
During embryonic development, CF have further vital functions, such as synthesis of ECM and
instructive epithelial differentiation. Different populations of fibroblasts originate from different
sources: the epicardium; endocardium and from the neural crest, and co-exist within the heart
(23) (24) (25). CF derive mainly from the epicardium (26) (27), thus, the epicardial markers
T-box transcription factor 18 (TBX18); Wilms’ tumor 1 (WT1), and Transcription factor 21 (TCF21)
4
TBX18 gene codes for a member of a family of transcription factors that plays a crucial role in
embryonic development (28). It is expressed in epicardium. In the heart, it contributes to
formation of the sinus horn myocardium at the venous pole of the heart (29). In adults, TBX18 is
found in differentiated smooth muscle of the coronary vessels; including the coronary arteries,
and in some coronary vascular smooth muscle cells development (28).
The zinc finger transcription factor encoded by the WT1 carries a mutation in Wilm’s tumor
patients, cancer of the kidneys that usually affects children and rarely adults. This gene is
expressed in epicardium, among other locations in the heart and kidney (25).
Transcription factor 21 is a member of the class basic helix-loop-helix (bHLH) family of
transcription factors that manage cell-fate specification. It promotes cardiac fibroblasts identity
and persists in differentiated cardiac interstitial and adventitial fibroblasts in the postnatal and
adult heart. TCF21 is mainly required for epicardial development and fibroblast lineage. Besides
the epicardium, it is expressed in kidney, lung and reproductive tract (27) (30).
As for the endothelial lineage; most mesenchymal cells are derived from
endothelial-to-mesenchymal transition (EMT) of a subset of endocardial cells, making this a compelling
candidate for the source for the endothelially derived fibroblasts in myocardium (23). Markers
such as Cluster of Differentiation 105 (CD105) (an endothelial marker), Platelet-derived growth
factor receptor α (PDGRFA) and Periostin (POSTN) (both mesenchymal markers) are important
for endothelial/mesenchymal lineage.
Indeed, the Endoglin gene, CD105, encodes a homodimeric transmembrane glycoprotein of the
vascular endothelium involved in angiogenesis and regulation of endothelial cell proliferation
(31) (32). In an immunohistochemical study, CD105 is expressed in the human foetal heart at
the 9th (in endocardium) and 10th week (in epicardial and myocardial vessels), throughout
gestation, and postnatally. This embryonic human heart development stage would correspond
to E14.5 of the mouse (33). Mutation of CD105 causes hereditary hemorrhagic telangiectasia,
an autosomal dominant inherited vascular dysplasia (34).
Tyrosine kinase receptor PDGRFA is a mesenchymal marker involved in the arrangement and
development of the cardiovascular system. The fact that fibroblast main function is structural,
synthesising most of the extra cellular matrix of connective tissue, PDGRFA comprehensively
marks fibroblasts generally, as it found to stimulate collagen synthesis (35). Other than cardiac
fibroblasts, in normal heart, it also marks smooth muscle cells and cardiomyocytes. (23).
POSTN, codes a TGFβ superfamily-responsive matricellular protein, which is secreted
throughout cardiovascular morphogenesis and postnatal cardiac homeostasis. It is required for
maturation and extracellular matrix stabilization of noncardiomyocyte lineages of the heart (36).
5
cells, and in cells undergoing EMT. It is used to mark CF population but, since it is an
extracellular protein, it has limitations in fibroblast labelling by means of antibodies (22). It is
expressed in small part of adult heart (6).
1.2.2. Fibroblasts Markers
CF have been extensively studied in respect to their origin, to determine when and where
distinct fibroblasts are generated, their lineage, and how they move to the final position in the
heart. For this, it is crucial to adjust cell-staining techniques to identify fibroblasts. In the late 19th
century, fibroblasts would be identified only by their structure. Nowadays immunostaining also
allows identification of fibroblasts, and lineage tracing permits the divination of the path of origin
of a specific fibroblast, thus permitting the understanding of CF lineages, above mentioned (37).
There are several fibroblast markers, however none is exclusive or expressed by all types of
fibroblasts. The lack of specific fibroblasts markers is one of the main problems concerning the
study and purification of these cells. Nevertheless, Cluster of Differentiation 90 (CD90),
Discoidin domain receptor 2 (DDR2) and Vimentin (VIM) have been analysed.
CD90, or Thymocyte antigen 1 (Thy-1), codes a cell surface membrane glycoprotein. It is known
to label subsets of fibroblasts as well as immune and endothelial lineages (6) (23). It is also
involved in the biological process of angiogenesis, and expressed mainly in smooth muscle
cells.
DDR2 encodes a tyrosine kinase receptor protein (38). Representing a cell surface receptor
(39), it is used to mark fibroblasts; however, it only identifies subsets of fibroblasts (22).
Nevertheless, DDR2 is also expressed by smooth muscle cells, epithelial cells, and bone
marrow-derived cells (39).
The intermediate filament protein coding gene, VIM, is part of the cytoskeleton. It is mostly used
to label cardiac fibroblasts, but it also labels endothelial, immune system cells, and
mesenchymal-derived cells (38). However, the staining is mostly comprehensive, i.e. all CF are
marked positive (6).
1.3 Heart Disease
Cardiac disease is nowadays a worldwide public health problem. Therefore, the study of the
heart and the mechanisms during development are very important to potentially develop
treatment and prevention therapies. A major part of this condition comprises acquired heart
disease, which develop during life and is manifested in adults. In contrast, precocious
6
cardiac malformations. In many cases the aetiology of congenital heart disease remains largely
unknown.
1.3.1 Congenital Heart Disease
The heart is the first functional organ during embryogenesis. Unfortunately, approximately 4 to
14 per 1.000 live births are diagnosed with congenital heart disease (CHD), a condition, in
which malformations of the heart anatomy occur disturbing the circulatory system. The
underlying malformations range from small atrial or ventricular septal defects to highly complex
malformations, resulting in serious hemodynamic changes. Hypoplastic left heart syndrome
(HLHS) and Tetralogy of Fallot are major and most severe clinical malformations (40).
CHD is the most common birth defect as it is estimated that 2% of live births have it (41).
Furthermore, the incidence of this disease may be more than 10 times greater in nonviable
embryos (i.e., spontaneously aborted foetuses or still-births) and these malformations contribute
to advanced heart failure in the paediatric and adult population (1), (41) (42) (43).
Regarding aetiology and pathogenesis; 90% of cases are unknown and in the 10% of cases the
environmental and genetic factors may lead to CHD. There are single gene mutations,
chromosomal deletion or additions and single gene mutations that affect proteins of
transcription factors.
The diagnosed CHDs in this project are presented in the following paragraphs.
HYPOPLASTIC LEFT HEART SYNDROME
HLHS results from a defective development by a stenotic or atretic aortic and/or mitral valve, a
high-grade hypoplasia of the ascending aorta and a highly hypoplastic or even completely
missing left ventricle. Because of the abnormal circulation, the ductus arteriosus and foramen
ovale are patent and the right atrium, right ventricle, and pulmonary artery are enlarged. Until
recently, HLHS was a uniformly fatal pathologic condition (40).
Severe atrial septal leads to obstruction to left ventricular outflow, causing hypoplasia of the left
ventricle and ascending aorta.
HLHS can be caused by mutation in the Gap Junction Protein, Alpha-1 gene (GJA1) gene and
in the NK2 Homeobox 5 gene (NKX2-5) gene. This last gene is essential in cardiac
development and its mutation causes various congenital heart malformations. Cardiac
expression of NKX2-5 continues throughout development and into adult life (44). However, this
7
CO-ARCTATION OF THE AORTA
The aortic co-arctation (CoA) is an obstructive congenital anomaly described by the narrowing
of part of the aorta causing obstruction of blood flow to the body. The obstruction of the left
ventricular outflow results in pressure hypertrophy of the left ventricle.
No particular gene has been directly associated with this clinical diagnosis.
ATRIAL SEPTAL DEFECT
ASD I (Atrial Septal Defect Primum), consists of a cardiac septal defect. It occurs less than 10%
of ASD cases and is next to AV valves, mitral cleft. ASD has some variations, which can be
distinguished by its clinical synopsis.
ASD II (Atrial Septal Defect secundum type), for instance is described clinically when the
patient exhibits (beyond the atrial septal defect) pulmonary valve thickening or stenosis and, in
some patients, even ventricular septal defects and atrioventricular septal defect. In comparison
to ASDI it usually occurs 90% of ASD cases and is distinguished by a defective fossa ovalis.
This variation is known to be caused by a mutation in the GATA4 gene. (48) (49) (50) (51)
ASD has other variations (52), like ASD4 and ASD9 are caused by mutation in the TBX20 (53)
and GATA6 gene (54), respectively. There is no description of clinical synopsis for ASD4, but
characteristics of ASD9 consist of atrial septal defect, ostium secundum type and in some
patients: tricuspid valve disease; pulmonary valve disease and pulmonary artery hypertension.
COMPLETE ATRIOVENTRICULAR SEPTAL DEFECT
The term 'atrioventricular septal defect' (AVSD) covers a spectrum of congenital heart
malformations characterized by a common atrioventricular junction coexisting with deficient
atrioventricular septation. In ostium primum atrial septal defect (ASD) there are separate
atrioventricular valvar orifices despite a common junction, whereas in complete AVSD (CAVSD)
the valve itself is also shared (55).
The 2 syndromes most frequently associated with AVSD are Down syndrome, in which AVSD is
the most frequent congenital heart defect, and Ivemark syndrome (56). Other variations like
AVSD4, which is caused by mutation in the GATA4 gene (57) (58), and AVSD5 caused by
8
1.3.2. Heart Disease in Adults
Cardiovascular diseases (CVDs) are a group of disorders of the heart and blood vessels. CVDs
are the number 1 cause of death globally: more people die annually from CVDs than from any
other cause (59).
In adults, coronary heart disease is a type of cardiovascular disease that affects the blood
vessels supplying the heart muscle, causing myocardial ischemia, due to reduction in the
coronary blood flow, as a result of obstructive atherosclerosis in the coronary artery.
Aorto-coronary Vein Bypass (ACVB) consists of the establishment of a bypass by using veins from the
aorta to the coronary vessels (59).
Valvular heart disease consists of the malfunctioning of a valve in the heart. Aortic Valve
Replacement (AVR), consists in the replacement of the aortic valve in case of stenosis or
regurgitation. As for Mitral Valve Repair (MVR), it consists in the repair of the mitral valve also in
case of stenosis or regurgitation. This clinical diagnosis, in the case of mitral prolapse, is
associated with connective tissue disorders like Marfan syndrome (autosomal dominant) (59).
In adults, there is a weak contribution that genes may have in heart diseases, since a somatic
cause is more expected. However, they may be used as an indicative. Age, the medication
history, and clinical history (risk factors like smoking, obesity or lack of exercise, poor diet and
excessive alcohol consumption) are the main responsible factors of these diseases.
1.4 Scope
The main objective of this project is to identify the expression patterns of primary CF from
children and adults. Relative gene expression patterns are also compared between culture
passages at time zero and after two passages with the purpose to see whether if culture
conditions would change the gene expression profile.
Cardiac samples were collected, from adult patients, suffering from coronary and valvular heart
disease, and from children suffering from congenital heart disease (Figure 1.2). Control
fibroblasts, from adipose tissue of the same patient, were used as a reference. These cells were
cultured for two passages. Gene expression of passage zero (P0) and passage two (P2) was
evaluated by reverse transcriptase quantitative polymerase chain reaction (RT-qPCR) and
subsequently subjected to data analysis. The gene expression was compared between cardiac
and adipose-derived fibroblasts. In addition, the results were analysed according to the age,
9
extra staining assays, immunocytochemical (ICC) and immunohistochemical (IHC), to confirm
the analysis of fibroblasts only and not of other cells.
Genes that are relevant during cardiac development were used in this work. Besides those
genes, some fibroblast markers were also included.
Figure 1.2 - Experimental procedure representation
Abbreviations: P0, passage zero; P1, passage one; P2, passage two; ICC,
immunocytochemical staining; IHC, immunohistochemical staining; RNA, ribonucleic acid;
cDNA, complementary deoxyribonucleic acid; RT-qPCR, quantitative reverse transcriptase
10
11
2. MATERIALS
A list of all the materials used in this work such as chemicals and reagents, equipment, kits,
produced medium, produced solutions is presented in the next sections.
2.1. Chemicals and Reagents
The tables containing the consumables, primers and software, were displaced to Attachment A
– “List of consumables, software and used primers”.
All chemicals and reagents used in this work are listed in table 2.1.
Table 2-1 - Chemicals and reagents
Designation Item number Manufacturer
Bovine Serum Albumin
(BSA) B14 Thermo Scientific
DMEM (4,5g/l Glucose, with
L-Glu (stable)) FG-0435 Merck Millipore
EDTA (0,5M) CN06.2 Carl Roth GmbH & Co. KG
Ethanol (>99,8%) K928.1 Carl Roth GmbH & Co. KG
Fetal Bovin Serum (FCS)
(ESC-qualified) 10270-106 Invitrogen
GeneRuler 50bp DNA
Ladder (0,5µg/µl) SM0371 Thermo Scientific
H2O (double distilled) R91051 H. Kerndl GmbH
PeqGold Universal Agarose
Powder 35-1020 Peqlab
Trypsin/EDTA- solution
(0,25%) 25200-056 Life Technologies
Dithiothreitol (DTT) (0,1M) P/N Y00147 Invitrogen
DNA Loading buffer (6x) R0611 Fermentas
dNTPs (10mM) R0181 MBI Fermentas
First strand buffer (5x) P/N Y02321 Invitrogen
Collagenase Type2 LS004176 Worthington
L-ascorbic acid -2 –
phosphate (5g) A8960 Sigma Aldricht
M-MLV Reverse
Transcriptase (200U/µl) 28025-013 Invitrogen
Sodium pyruvate (100mM) 11360-039 Life Technologies
Random hexamer Primers
(250ng/µl) 48190-011 Invitrogen
SybrGreen Quantitect 204145 Qiagen
12
2.2. Equipment
Next, table 2.2 follows listing all the equipment used in the lab.
Table 2-2 - Equipment
Device Manufacturer
Analytical Balance EW600-2M Kern & Sohn GmbH
CO2-Incubator AutoFlow CO2 Water Jacket
(37°C, 5% CO2) NuAire
Battery powered pipette filler- Pipetus Hirschmann Fluorescencemicroscope Axiovert 200M ZEISS Electrophoresis Gel Device - Power Supply
Gel Bio-Rad
Gel Imaging System – ChemDoc XR Bio-Rad
Gel Chambers (50ml, 150ml) Bio-Rad
Fridge 4°C Liebherr
Fridge -20°C Liebherr
Fridge -80°C Thermo Scientific
Hemocytometer Carl Roth GmbH & Co. KG
Microwave MW 7849 900W Severin
NanoDrop 2000 Spectrophotometer Thermo Scientific
Pipetes (various) Eppendorf Research
Safety workbench Class II NuAire
Thermomixer comfort Eppendorf
Thermocycler C1000 BIO-RAD
Table Centrifuge 5417R Eppendorf
Vortex device Scientific Industries
Water bath (37°C) Memmert
Medium bench centrifuge – Heraeus
Megafuge 2.0R Thermo
ABI PRISM 7000 Applied Biosystems
Cryostat Leica CM1850 Leica Biosystems
13
2.3. Kits
Table 2.3 lists the original kits used for RNA extraction, cDNA production and PCR.
Table 2-3 - Kits
Kit Item number Manufacturer
PeqGOLD Total RNA Kit 126834 Peqlab
PeqGOLD DNase I Digest 12-1091-02 Peqlab
High Pure PCR Product
Purification Kit 11 732 668 001 Roche
2.4. Produced Media and Solutions
Produced media, used in cell culture, and solutions, used in digestion of samples, cell culture
and electrophoresis are listed below in table 2.4
Table 2-4 - Produced Media and Solutions
Media and Solutions Composition
MEF Medium
DMEM + 10% (v/v) FCS + 1%(v/v) Na-Pyruvate (100mM) + 1% (v/v) Pen (100U/ml) / Strep (100µg/ml)
TBE-Buffer (10x) Solution
55.64g boric acid + 109g Tris 9.3g EDTA; dissolve Disodium salt dihydrate in aq. bidest, set pH to 8.3 with 1M HCl; fill up to 1L with aq. Bidest
TBE-Buffer (1x) Solution 100ml TBE-Buffer (10x) + 900ml aq. bidest
Trypsin/EDTA-Solution (0.05%) 1ml Trypsin/EDTA-Solution (0.25%) + 4ml PBS
Collagenase Solution (0.2%)
100mg Collagenase Type 2 +10ml PBS, sterile filter and wrap falcon tube in
14
2.5. Antibodies and Serum Used
A list of the serum and antibodies used in Immunocytochemistry (ICC) and
Immunohistochemistry (IHC) staining assays are listed below in table 2.5. Dilution used is also
presented as well as the fluorescence of the 2nd antibody, Alexa Fluor 555 and Alexa Fluor 488,
corresponding to red and green respectively.
Table 2-5 - Antibodies and serum used
Staining Antibody Manufacturer,
number Dilution Fluorescence
ICC
1st Anti-Vimentin: rabbit polyclonal IgG
Abcam ab45939
1:500
-
1st Anti-DDR2: rabbit polyclonal IgG
LSBio, LS-C99151
1:10
-
2nd Goat anti rabbit IgG Abcam
ab150078
1:500
Alexa Fluor 555
IHC
1st Anti-α-Actinin: mouse monoclonal sarcomere antibody Abcam, ab9465 1:100 -
2nd Goat anti mouse IgG Abcam,
ab150114
1:500
Alexa Fluor 555
1st Anti-Vimentin: rabbit polyclonal IgG
Abcam ab45939
1:500
-
1st Anti-DDR2: rabbit polyclonal IgG
LSBio, LS-C99151
1:50
-
2nd Goat anti rabbit IgG Abcam
ab150078
1:500
Alexa Fluor 488
Staining Serum Dilution Fluorescence
ICC/IHC - Goat Serum Abcam - -
2.6. Biological material
All donors have signed an informed consent and the procedure was approved by the local
15
3. METHODS
3.1. Establishment of primary cardiac and adipose fibroblast cultures
3.1.1. Cell Culture
Cell culture is the process, by which eukaryotic cells are grown under controlled conditions.
There are two types of culture: cells in suspension and adherent cells. Epithelial and
fibroblasts-like cells both attach to a substrate; the difference between them is the morphology: epithelial
like-cells appear flattened and polygonal in shape, while fibroblasts appear elongated and
bipolar. Lymphoblast-like cells do not attach to a substrate and remain in suspension with a
spherical shape (60).
The aim of cell culture is to provide an environment to maintain the proliferation of a certain cell
type which then allows the analysis of selected parameters (e.g. gene expression). Cell culture
requires sterile conditions (avoid contamination by bacteria, etc); and defined parameters (e.g.
temperature; humidity; CO2, growth medium) and suitable surface for attachment (culture
vessel) for adherent cells. Figure 3.1
16
Regarding the sterile conditions, all work is done in a laminar flow. Cultures are incubated (with
defined temperature, gas mixture and humidity level, usually: 37ºC; 5% CO2 in air and more
than 95% humidity, with these last two helping stabilizing pH).
Cell culture media, chemically defined, have a neutral pH (7.2-7.4), contain essential amino
acids, vitamins, inorganic salts, and glucose, among others. The most commonly used media
are Dulbecco’s Modified Eagle Media (DMEM) and Roswell Park Memorial Institute Medium
(RPMI). Usually they are supplemented with antibiotics (penicillin, streptomycin, etc.) to inhibit
the growth of contaminants. Media are sterile and stored at 4ºC.
Cell culture vessels used for fibroblasts culture (adherent cells) are T-flasks (T-25, T-75 - the
number indicates cm2 of surface area) and multiwell plates, which come in various sizes. The
ones used in this project are 12-well plates (60).
Cell cultures from 5 children and 5 adults with congenital or acquired coronary and valvular
heart disease were established. The surgical intervention or the type of diagnosis of each
patient is listed in table 3.1. Right atrium (RA) was the type of cardiac tissue harvested for all
patients, except for one adult patient with the MVR diagnosis, whose cardiac tissue harvested
and analysed was left atrium (LA).
Table 3-1 - List of the diagnosis of the collected samples
Age Group Patient Intervention/Diagnosis Cardiac
Tissue
Children
1 Coarctation of Aorta (CoA) RA
2 Complete Atrium Ventricle Septum Defect (CAVSD) RA
3 Atrium Septum Defect (ASD) RA
4 Hypoplastic Left Heart Syndrome (HLHS) RA
5 Atrium Septum Defect Secundum (ASDII) RA
Adults
6 Aortic Valve Replacement (AVR) RA
7 Aortic Valve Replacement (AVR) RA
8 Mitral Valve Repair (MVR) LA
9 Aorto-coronary Vein Bypass (ACVB) RA
10 Mitral Valve Repair (MVR) RA
3.1.2. Protocol used
Human cardiac biopsies or subcutaneous adipose tissue are transferred on ice from the
operating room to the lab in phosphate-buffered saline (PBS). The sample is cut into small
fragments (approx. 1mm3) using scalpels. A small part of the sample is snap frozen in liquid
nitrogen and kept at -80ºC. This will serve as a tissue control. The remaining tissue is digested
17
Optionally, the digested tissues may be filtered through a 70µm filter to remove larger
undigested pieces. Cells are centrifuged for 10min at 300xg and resuspended in MEF Medium
(DMEM high glucose, 1% sodium-pyruvate, 10% FCS and 1% Pen/Strep). Depending on the
size, the cells are distributed into a T25 flask or in 3 wells of a 12-well plate in the same
medium. T-flasks and multiwell plates were labeled with project name (fibroblasts project), and
patient number (differing samples from children and adults, and cardiac and adipose tissue).
Date of seeding is also present, as well as passage number. Dates of medium changing and
passaging were noted.
After overnight incubation, fibroblasts should have attached to the plastic surface. To get rid of
cellular debris and non-attached cells the wells are then washed and receive fresh medium.
After 5 to 7 days, P0 cultures should present the typical fibroblast morphology and are ready for
the next culture passages, namely the P1 to be used for downstream experiments and P2 for
further procedures.
All cell culture work was done under sterile conditions in the laminar flow. Unsterile solutions
were filtered; material and devices were sprayed with 70% (v/v) ethanol before use. Cells are
incubated at 37°C and 5% (v/v) CO2 in a atmosphere with circa 95% (v/v) of humidity.
3.1.3. Cell passaging
Cell lines cannot be kept in culture indefinitely due to the gradual rise in toxic metabolites, use
of nutrients limitation and increase in cell number (avoid inhibition due to contact). The aim is to
keep the cells actively and healthily growing and expand the number of cells, which leads to the
necessity to subculture at regular intervals (cell passaging). For adherent cells, it involves
breaking the bonds or cellular ‘glue’ that attaches the cells to the substrate and to each other.
The use of proteolytic enzymes, like trypsin, breaks down proteins that facilitate adhesion.
When the fibroblasts reach 80% confluence (referring to the proportion of the surface of the
flask, which is covered by cells, usually cells are cultured only until 80% confluence, and not
100%, to avoid contact inhibition), medium is aspirated and the plate wells are washed with
sterile phosphate-buffered saline (PBS). This PBS pre-rinse step is made, due some confluent
cultures being more difficult to detach. Thus, it will remove the serum, which neutralizes the
action of the trypsin, from the well. Cells were detached from the plastic with Trypsin (1:4,
Trypsin/EDTA: PBS), as it stripped proteins from the cell surface, after a 5-minute incubation at
37ºC (trypsin’s operating temperature). Incubation time and concentration were chosen
carefully, as incubating cells (with too high a trypsin concentration) for too long will damage cell
membranes and kill the cells. After inspecting cells under the microscope, and making some
they are already detached, trypsinized cells, with a round shape, as they now are suspended,
18
continue to act as a proteinase until an inhibitor, such as serum, neutralizes it, thus MEF
medium was added, inactivating trypsin, due to the FCS content. Afterwards cells were
centrifuged for 5 min at 1500 rpm. The supernatant was aspirated and the cells were
resuspended with MEF medium.
Cells were distributed in 3 new wells in a 12-well plate, designated passage one. These cells
were again passaged and grown to 80% confluence (passage two, P2).
3.2. RNA Extraction
RNA extraction consists on the purification of RNA from biological samples, and is used to
generate complementary DNA (cDNA), and afterwards amplify this cDNA with primers, specific
for the gene of interest in quantitative Reverse Transcriptase Polymerase Chain Reaction
(RT-qPCR).
However, why chose this technique, when DNA can be purified and amplified with quantitative
Polymerase Chain Reaction (qPCR), saving work? In order to distinguish a few particular genes
of interest, among all other coding and non-coding sequences, which are sitting in the nucleus,
the only one possible way is to follow the messenger RNA (mRNA), corresponding to the genes
of interest. When extracting a particular mRNA, its corresponding gene is being expressed (or
productive) in the moment of extraction. The coding DNA is present in all nucleated cells,
whereas the coding mRNA is expressed only in those cells that are actively synthesizing the
protein. Therefore, if interested only in the cells that are active, i.e. expressing the RNA, RNA
extraction has to be accomplished.
The RNA extraction was performed with the peqGOLD Total RNA Kit (Peqlab). For the cultured
fibroblast, medium was aspirated and 400µL of RNA Lysis buffer were added directly to the
confluent cells. The culture surface was rinsed multiple times with the lysis buffer to capture as
many cells as possible. The lysate was collected with a pipette and added to a 1.5mL
Eppendorf tube. The lysates were promptly stored at -20°C until further use.
Regarding the tissue control, samples were retrieved from -80ºC on dry ice. Samples were
transferred to 2 mL tubes with 1.4mm ceramic (zirconium oxide) beads, designed for soft tissue
homogenization, which were put on ice. 400µL of the previously used RNA Lysis are buffer is
added. Lysates placed in the Precellys® 24, piece of benchtop equipment dedicated to the
grinding, lysis, and homogenization of biological samples. With 3D speed and motion, the beads
crush the biological sample to release the desired RNA. The settings parameters were
19
intervals – 20s and the pauses between digestion intervals – 005s). After homogenization, the
tubes were put on ice until RNA extraction.
RNA isolation from fibroblasts samples and tissue samples, was performed accordingly to the
manufacturer’s instructions, (PeqGOLD Total RNA Kit, #126834).
The lysate was transferred into a DNA removing column, placed in a 2ml tube. After 1min
centrifugation at 10,700rpm at room temperature, it was transferred to a new 1.5ml tube. An
equal volume (400μl) 70% Ethanol was added to the lysate and mixed by vortexing, preventing
hydrolysis of the RNA. A RNA binding column was placed in a new 2ml tube. The lysate was
added directly to the membrane of the column. It was centrifuged at 10,700rpm for 1min and the
tube containing the flow-through liquid was discarded. In the first washing step, the RNA binding
column was placed in a new 2ml tube. 500μl of RNA wash buffer I was added, and the lysate
was centrifuged at 10,700rpm for 15sec.The flow-through liquid was discarded, but the tube
was reused. DNase digestion step followed, to remove DNA. A 75μL reaction mix for each
column was prepare, containing 73.5μL of DNase I Digestion Buffer and 1.5 μL of RNase-free
DNase I (20 Kunitz units/μl). The DNase digestion reaction mix, was added to the column,
directly onto the membrane. After a 15min incubation at room temperature, the columns were
placed into a new 2ml tube. 400μl RNA Wash Buffer I was added and a 5min incubation at
benchtop followed. After a 15sec centrifugation at 10,700rpm, the flow-through was discarded.
In the second washing step, 600μl of completed RNA wash buffer II was added and the column
was centrifuged for 15sec at 10,700rpm. The flow-through liquid was discarded and the step
was repeated, discarding again the low-through liquid. In the drying step, the column was
centrifuged at 10,700rpm for 2min. Finally, in the elution step, the last step, the column was
placed into a new 1.5ml tube. 50μL of sterile RNase-free dH20 (DEPC-water) were added
directly to the membrane of the column and it was centrifuged for 1min for 6,900rpm to elute
RNA.
After RNA extraction, purified samples are frozen at -20°C until further use.
.
3.3. cDNA synthesis
Complementary DNA (cDNA) is synthesized from purified RNA. It consists of a double-stranded
DNA synthesized from a single stranded purified RNA (mRNA) template in a reaction catalysed
by the enzyme reverse transcriptase.
Prior to reverse transcription, the RNA concentration must be measured at 260nm using the
20
Firstly 1.5µL random hexamer primers (250ng/µL), 1.5µL of deoxyribonucleotide triphosphates
(dNTPs) (10mM), 100ng RNA from sample are added to a tube which is filled up with
RNase-free water to a final volume of 20.5µL. The mix is pipetted into a tube and briefly centrifuged.
The mixture is incubated for 5 min at 65°C and chilled on ice.
In the second step 6µL of first strand buffer (5x) and 3µL of DTT (100mM) are added, gently
mixed and incubated at 37°C for 2 min.
After cooling the mix down on ice for some minutes, 0.5 µL of the enzyme Moloney Murine
Leukemia Virus Reverse Transcriptase (M-MLV RT) (200 units) is added and mixed. The
mixture is incubated (10 min at 25°C), followed by a 50-min incubation at 37°C. Finally, the
enzyme is inactivated at 75°C for 10 min. The samples are frozen at -20°C until further use.
In table 3.2, a typical approach to produce cDNA is shown. The values for RNA and water are
not fixed (depend on the RNA concentration value). Thus, being X represented in the volume of
RNA per sample.
Table 3-2 - cDNA synthesis protocol.
Steps Reagents Volume per
sample [µL]
Conditions
Duration Temperature
1st step
RNA (100ng) X
5min 65°C
dNTPs (10mM) 1,5 Random
Primers (250ng/µL)
1,5
DEPC Water *
2nd step
First Strand
Buffer (5x) 6 2min 37°C
DTT (100mM) 3
3rd step M-MLV RT
(200U/µL) 1
10min 25°C
50min 37°C
15min 75°C
The volume of RNA per sample is denominated X as it depends on RNA concentration.
The RNA concentration will determine the volume of RNA per sample, in equation 3.1, and the
volume of diethyl pyrocarbonate (DEPC) water, used to inactivate RNase enzymes.
100
𝑅𝑁𝐴 𝑐𝑜𝑛𝑐𝑒𝑛𝑡𝑟𝑎𝑡𝑖𝑜𝑛 𝑣𝑎𝑙𝑢𝑒= 𝑅𝑁𝐴 𝑣𝑜𝑙𝑢𝑚𝑒 𝑝𝑒𝑟 𝑠𝑎𝑚𝑝𝑙𝑒
Equation 3-1 - RNA Volume per sample
21
The sum of RNA and RNase-free water must be 17.5 µL. Thus, if the RNA concentration
measured is too low, the maximum volume added is 17.5 µL and no water is added.
3.4. Polymerase Chain Reaction
With the help of Polymerase Chain Reaction (PCR) it is possible to amplify specific
DNA-fragments. In this process, a DNA-polymerase synthesizes a new DNA strand complementary
to a single-stranded nucleic acid template, starting in the sequences where the primers will
specifically bind. Primers are oligonucleotides (small sequences of specific base-pairs) that
serve as starter molecules, which are complementary to parts of the templates and defining the
sections of the template that will be amplified. When they bind specifically to the original region
that will be synthesized, they allow the DNA-polymerase to start amplification, following a
sequence of three main steps: denaturation, annealing and polymerisation.
In denaturation, usually using high temperature, the separation of complementary molecules of
the DNA chain occurs. The next step is annealing occurring at a low temperature and allowing
the primers to bind to the specific regions that will give the order to start the following step,
polymerisation. This last step occurs at a specific temperature in order to allow the polymers to
make a copy of the template sequences (normal and complementary, 5’ and 3’), from the first
(forward) primer until the second (reverse) one.
This sequence of steps will be repeated several times, duplicating the material at the end of
each cycle. This means that after the first cycle, there will be two copies of the template
molecule, for the second cycles it will duplicate, making it four, for the third cycle it will make 8
and so on, progressing in an exponential manner (2x), where x represents the number of cycles
that will be performed. Each cycle will run for a specific time, accordingly to the protocol used.
This is the crucial principle of PCR, where the cyclic repetition of the reaction steps allows the
DNA-strand to be exponentially amplified.
3.5. Reverse Transcriptase - Quantitative Polymerase Chain Reaction
(RT-qPCR) with SybrGreen
3.5.1. Principle of RT-qPCR
The expression of endogenous genes is verified and demonstrated through RT-qPCR using
cDNA as a template.
RT-qPCR is based on the principle that after each amplification cycle the fluorescence of the
sample is measured. The more cDNA is amplified, the stronger the fluorescence signal. The dye
SYBR Green intercalates with the double stranded cDNA and fluoresces. The signal rises
22
Tissue samples were used as a control to differential gene expression. Cardiac, epicardial,
fibroblast and other genes, such as GATA4/5/6; TBX5/18/20; CD90/105; VIM; WT1; TCF21
DDR2; POSTN and PDGRFA were tested. The whole heart control gene expression is
presented in the results.
At the end of the program, quantification of the fluorescence signal is applied over the number
of cycles. The threshold value defines the number of cycles, after which the fluorescent signal
exceeds the background signal (i.e., the CT value). The threshold value was set to 0.2 in all
evaluations.
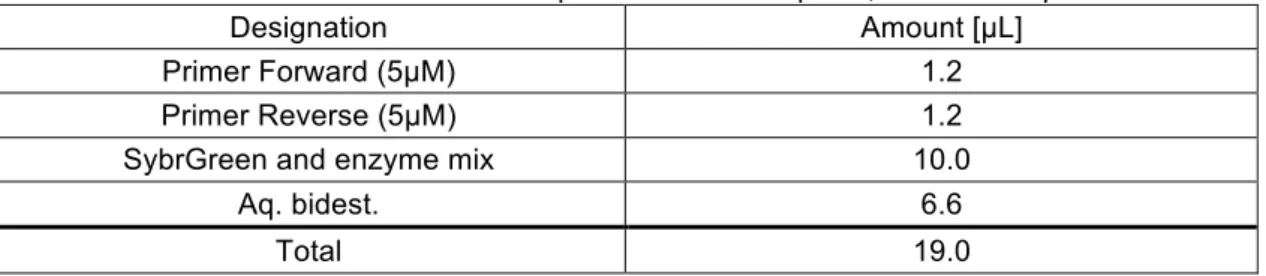
Concerning the preparation of the plate for RT-qPCR, firstly a master mix is prepared, which
contains all the reagents for a RT-qPCR run. The used amounts are demonstrated in table 3.3.
Table 3-3 - Mastermix composition for a RT-qPCR, for one sample.
Designation Amount [µL]
Primer Forward (5µM) 1.2
Primer Reverse (5µM) 1.2
SybrGreen and enzyme mix 10.0
Aq. bidest. 6.6
Total 19.0
The master mix was vortexed and briefly centrifuged.
One µL of cDNA sample was pipetted in a 96 Multiwell Plates well followed by 19µL of the
master mix. As a negative control, instead of the template, 1µL aq. bidest was used.
The plates were centrifuged and the RT-qPCR is performed on an ABI Prism 7000, with the
conditions described in table 3.4. The 2-step program cycles between 95°C and 60°C with a
total number of 40 cycles.
Table 3-4- RT-qPCR Operating conditions
Temperature Duration
50°C 2min
95°C 10min
95°C 15sec
60°C 60sec
At the end of each run, after the amplification, a melting curve analysis is conducted, to verify if
the product in the sample is clean or if eventually primer dimers or other products have
23
3.5.2. Quantification of RT-qPCR samples by means of Standard Curves
Regarding quantification of relative gene expression, in the respective RT-qPCR sample,
standard curves are generated for the target genes. Therefore, from a positive sample, which
contains the target gene, a dilution series is accomplished. The value of undiluted samples is
arbitrarily set to 106 arbitrary units (AU), the further log (10)-dilutions correspondingly less, as
presented on table 3.5.
Table 3-5 - Dilution series for a standard curve
Sample Dilution Arbitrary Units (AU) per µL
1 Not diluted (1:1) 1x10⁶
2 1:10 1x10⁵
3 1:100 1x10⁴
4 1:1.000 1x10³
5 1:10.000 1x10²
6 1:100.000 1x101
7 1:1.000.000 1x100
Each sample will be measured as a duplicate in the RT-qPCR. The standard curves result from
the Ct-values of the measured samples plotted against the logarithm of the arbitrary units.
From the slope and the intersection with the y-axis of the standard curve the relative number of
amplified PCR-products can be determined as indicated in equation 3.2.
𝐴𝑈 = 𝑒
BCDEFCGHIGJCKLF MKCN ODPQKI IRLSG
Equation 3-2 - Amplified PCR-products
In attachment B, an example of a standard curve is exemplified for CD90 gene.
3.5.3. Normalisation with housekeeping gene b-Actin
Gene expression is the process by which information from a gene used in synthesis of a
functional gene product, often a protein. Some specific genes, for each cell type, have a
constant expression, designated housekeeping genes. Others are up-regulated (i.e. become
expressed, switched on, or productive) in particular cellular conditions - normal physiological
(development, aging, fertilization) or pathological (apoptosis, inflammation, mutations, etc).
Gene expression, of a gene of interest, is usually compared toward the expression (or