Functional Relationship between Sucrose and
a Cariogenic Biofilm Formation
Jian-Na Cai1, Ji-Eun Jung1, Minh-Huy Dang1, Mi-Ah Kim1, Ho-Keun Yi2, Jae-Gyu Jeon1*
1Department of Preventive Dentistry, School of Dentistry, Institute of Oral Bioscience, Chonbuk National University, Jeonju, Republic of Korea,2Department of Oral Biochemistry, School of Dentistry, Institute of Oral Bioscience, Chonbuk National University, Jeonju, Republic of Korea
Abstract
Sucrose is an important dietary factor in cariogenic biofilm formation and subsequent initiation of dental caries. This study investigated the functional relationships between sucrose concen-tration andStreptococcus mutansadherence and biofilm formation. Changes in morphologi-cal characteristics of the biofilms with increasing sucrose concentration were also evaluated. S.mutansbiofilms were formed on saliva-coated hydroxyapatite discs in culture medium con-taining 0, 0.05, 0.1, 0.5, 1, 2, 5, 10, 20, or 40% (w/v) sucrose. The adherence (in 4-hour bio-films) and biofilm composition (in 46-hour biobio-films) of the biofilms were analyzed using microbiological, biochemical, laser scanning confocal fluorescence microscopic, and scan-ning electron microscopic methods. To determine the relationships, 2ndorder polynomial
curve fitting was performed. In this study, the influence of sucrose on bacterial adhesion, biofilm composition (dry weight, bacterial counts, and water-insoluble extracellular polysac-charide (EPS) content), and acidogenicity followed a 2ndorder polynomial curve with
concen-tration dependence, and the maximum effective concenconcen-trations (MECs) of sucrose ranged from 0.45 to 2.4%. The bacterial and EPS bio-volume and thickness in the biofilms also grad-ually increased and then decreased as sucrose concentration increased. Furthermore, the size and shape of the micro-colonies of the biofilms depended on the sucrose concentration. Around the MECs, the micro-colonies were bigger and more homogeneous than those at 0 and 40%, and were surrounded by enough EPSs to support their structure. These results suggest that the relationship between sucrose concentration and cariogenic biofilm formation in the oral cavity could be described by a functional relationship.
Introduction
Dental caries, a biofilm-related disease, is associated with the presence of cariogenic bacteria and high consumption of dietary carbohydrates [1,2]. Among dietary carbohydrates, sucrose can cause major biochemical and physiological changes during dental biofilm formation and is considered one of the most cariogenic carbohydrates [1,3]. Sucrose fermentation by oral bacte-ria can rapidly reduce the pH in dental biofilms, which results in a shift in the balance of resi-dent plaque microflora to become more cariogenic [4]. Sucrose also serves as a substrate for the a11111
OPEN ACCESS
Citation:Cai J-N, Jung J-E, Dang M-H, Kim M-A, Yi H-K, Jeon J-G (2016) Functional Relationship between Sucrose and a Cariogenic Biofilm Formation. PLoS ONE 11(6): e0157184. doi:10.1371/ journal.pone.0157184
Editor:Abdelwahab Omri, Laurentian, CANADA
Received:March 15, 2016
Accepted:May 25, 2016
Published:June 8, 2016
Copyright:© 2016 Cai et al. This is an open access article distributed under the terms of theCreative Commons Attribution License, which permits unrestricted use, distribution, and reproduction in any medium, provided the original author and source are credited.
Data Availability Statement:All relevant data are within the paper.
Funding:This work was supported by the National Research Foundation of Korea (NRF) grant funded by the Korea government (MSIP)
(2014R1A4A1005309). The funders had no role in study design, data collection and analysis, decision to publish, or preparation of the manuscript.
Competing Interests:The authors have declared
synthesis of polysaccharides in dental biofilms, especially extracellular polysaccharides (EPSs) [5]. In addition, recent studies have demonstrated that sucrose can reduce the concentrations of calcium (Ca), inorganic phosphorus (Pi), and fluoride (F) in the dental biofilms; these are critical ions involved in the demineralization and remineralization of enamel and dentin in the oral environment [6,7].
Among cariogenic bacteria,Streptococcus mutansis generally regarded as a primary etio-logic agent of dental caries [8,9]. This bacterium can produce large amounts of acid and sur-vive in a low pH environment. Furthermore,S.mutanscan utilize dietary sucrose to synthesize EPSs, which are mostly glucans synthesized by glucosyltransferases (GTFs) [10–12]. The bacte-rium produces at least three GTFs (GTFB, GTFC, and GTFD), and synthesizes a mixture ofα (1!3)-linked insoluble andα(1!6)-linked soluble EPSs [13,14]. The EPSs, especially water-insoluble EPS, can promote selective adherence and accumulation of large numbers of cario-genic streptococci on the tooth surface, which contribute to the cariocario-genic biofilm formation [15,16].
Many epidemiological and experimental studies have been performed to reveal the relation-ship between sucrose and dental caries development [17–20]. Recent studies have demon-strated that the cariogenicity of sucrose is related to the concentration and frequency of exposure [21,22]. Furthermore, severalin vivostudies have shown that there is a strong rela-tionship between sucrose concentration in the diet and the incidence of smooth surface and fis-sure caries [23], and that sucrose concentration also can influence pH in dental plaquein vivo
[24]. However, few studies have been performed to investigate the precise relationship between sucrose concentration and dental caries development. Furthermore, little has been reported on the functional relationship between sucrose concentration and cariogenic biofilm formation, in particular forS.mutans.
Therefore, the aim of this study was to evaluate the functional relationships between sucrose concentration andS.mutansadherence and biofilm formation. We also investigated the changes in morphological characteristics of the biofilms according to sucrose concentration.
Materials and Methods
S
.
mutans
biofilm preparation and sucrose
S.mutansUA159 (ATCC 700610; serotype c) biofilms were formed on saliva-coated hydroxy-apatite (sHA) discs (2.93 cm2; Clarkson Chromatography Products, Inc., South Williamsport, PA, USA) placed in a vertical position in 24-well plates, as detailed elsewhere [25]. Briefly, sHA discs were generated by incubation with filter-sterilized (0.22-μm low protein-binding filter) human whole saliva for 1 h at 37°C. For biofilm formation, the sHA discs were transferred to a 24-well plate containing brain heart infusion (BHI; Difco, Detroit, MI, USA) broth with 0, 0.05, 0.1, 0.5, 1, 2, 5, 10, 20, or 40% (w/v) sucrose andS.mutansUA159 (2–5×10⁶ colony-form-ing unit (CFU)/ml). The biofilms were grown at 37°C with 5% CO2for 4 h or 46 h. For 46-h biofilm formation, the biofilms were grown undisturbed for 22 h to allow initial biofilm growth and then the culture medium (0, 0.05, 0.1, 0.5, 1, 2, 5, 10, 20, or 40% sucrose BHI broth) was changed twice, at 22 and 31 h.
Microbiological and biochemical studies
the dispersed solution was serially diluted and plated on BHI agar plates for determination of CFU as detailed elsewhere [26].
Biofilm formation analysis. The 46-h biofilms were analyzed to determine the change in
S.mutansbiofilm formation according to the concentration of sucrose. The 46-h biofilms were detached and sonicated to analyze CFU count as described above. The dry weight and the amount of water-insoluble EPSs were determined as described elsewhere [26]. Briefly, the remaining solution (4.9 ml) was centrifuged (3000 g) for 20 min at 4°C. The biofilm pellet was re-suspended and washed twice in an equivalent volume of water. The washed biofilm pellet was lyophilized and weighed to determine the biofilm biomass. In addition, the water-insoluble EPSs were extracted from the dry pellet using 1 N sodium hydroxide before determination of the polysaccharide amount using a phenol-sulfuric acid assay. The final pH values of the old culture media were also determined during the experimental period using a glass electrode (Beckman Coulter Inc., Brea, CA, USA) and the H+production rate (μM/h) was calculated by the pH values (from 22 to 31 h) to investigate the change in acidogenicity of the biofilms.
Confocal laser scanning microscopy
Confocal laser scanning microscopy (CLSM) was performed as described by Jeon et al. [25] to confirm the results of microbiological and biochemical studies. The concentrations of sucrose tested in the CLSM study were 0, 1, 10, and 40% (w/v). To determine the change inS.mutans
adhesion and biofilm formation, 1μM of Alexa Fluor1647-labeled dextran conjugate (10,000 MW; absorbance/fluorescence emission maxima 647/668 nm; Molecular Probes Inc., Eugene, OR, USA) was added to 0, 1, 10, or 40% sucrose BHI broth withS.mutansUA159 (2–5 × 10⁶ CFU/ml) at 0, 22, and 31 h. The fluorescence-labeled dextran serves as a primer for GTFs and can be simultaneously incorporated during the extracellular polysaccharide matrix synthesis over the course of the biofilm development, but does not stain the bacterial cells at concentra-tions used in this study [25]. After 4 or 46 h, the bacterial cells in the biofilms were labeled by incubation with 2.5μM SYTO 9 green fluorescent nucleic acid stain (480/500 nm; Molecular Probes Inc.) for 30 min. CLSM imaging of the biofilms was performed using a LSM 510 META (Carl Zeiss, Jena, Germany) microscope equipped with argon ion and helium-neon lasers. Four independent experiments were performed and five image stacks per experiment were collected (n = 20). The bio-volume (μm3/μm2), mean thickness (μm), roughness coefficient, and surface to volume ratio (μm2/μm3) of bacterial micro-colonies and EPSs were quantified from the con-focal stacks using COMSTAT [27]. The bio-volume is defined as the volume of the biomass (μm3) divided by the surface area of the substratum (HA discs) (μm2). The roughness coeffi-cient, which provides a measure of how much the thickness of the biofilm varies, is calculated from the thickness distribution of the biofilm. The surface to volume ratio is the surface area divided by the bio-volume. The roughness coefficient and surface to volume ratio reflect the degree of biofilm heterogeneity and nutrient exposure, respectively [27]. The three-dimen-sional architecture of the biofilms was visualized using Imaris 8.0.2 (Bitplane, Zurich, Switzerland).
Scanning electron microscopy
sputter coating with gold–palladium. The biofilm samples were analyzed by SEM (JSM-5900, Jeol, Japan).
Statistical analysis
To determine the relationships between sucrose concentration andS.mutansadherence or bio-film formation, 2ndorder polynomial fitting for sucrose concentration versus CFU count, dry weight, amount of water-insoluble EPSs, or final pH value was performed using a polynomial regression analysis program (Origin 7.0; Microcal, Inc., Northampton, MA, USA). The deter-mination coefficients (R2) of each fitted line were also calculated.
All experiments were performed in duplicate, and at least four different experiments were conducted. The data are presented as mean ± standard deviation. Intergroup differences were estimated using one-way analysis of variance, followed by a post hoc multiple comparison (Tukey) test to compare the multiple means. Values were considered statistically significant when thePvalue was<0.05.
Results
Relationship between sucrose concentration and
S
.
mutans
adhesion
As shown inFig 1A,S.mutansadhesion during 4-h biofilm formation gradually increased and then decreased as the sucrose concentration increased. Generally, the change inS.mutans
adhesion to sHA discs followed a 2ndorder polynomial curve with sucrose concentration dependence. The R2value of the polynomial curve was 0.75 (P<0.05). The maximum effective concentration (MEC) of sucrose for bacterial adhesion from the polynomial curve was 0.45%. In the CLSM study, the bacterial bio-volume of the 4-h biofilms also gradually increased and then decreased as the sucrose concentration increased (Fig 1B). The bacterial bio-volume at 1 and 10% was at least 1.5 times higher than that at 0 and 40% (P<0.05). However, the mean bacterial thickness did not change with increasing sucrose concentration (Fig 1C). The EPS bio-volume and mean thickness also showed no change according to sucrose concentration, except at 40% (Fig 1B and 1C). Representative bacterial and EPS CLSM images are shown in
Fig 1D and 1E, respectively, and show that bacterial micro-colonies were more prominent at 1 and 10% than those at 0 and 40%, but EPSs were barely detected at any of the concentrations tested.
Relationship between sucrose concentration and
S
.
mutans
biofilm
formation
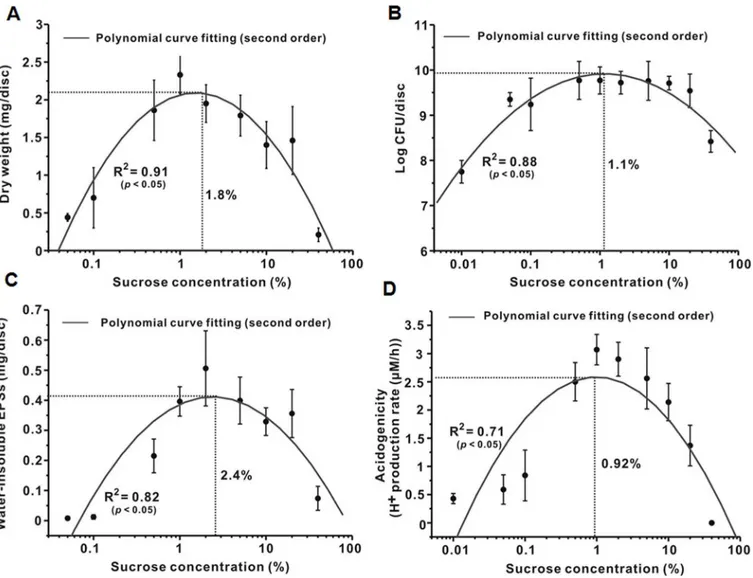
Relationship in microbiological and biochemical studies. As shown inFig 2A, the dry weight of the 46-h biofilms gradually increased and then decreased as sucrose concentration increased, which followed a 2ndorder polynomial curve with sucrose concentration depen-dence. The R2value of the polynomial curve was 0.91 (P<0.05). The MEC of sucrose for dry weight in the polynomial curve was 1.8%. The change in CFU counts, water-insoluble EPS amount, and acidogenicity of the 46-h biofilms also followed a 2ndorder polynomial curve with sucrose concentration dependence (Fig 2B–2D); the R2values were 0.88, 0.82, and 0.71 (P<0.05), respectively. The MECs ranged from 0.92 to 2.4%. Generally, the results showed that the change in the composition and virulence ofS.mutansbiofilms followed a 2ndorder polynomial curve with sucrose concentration dependence.
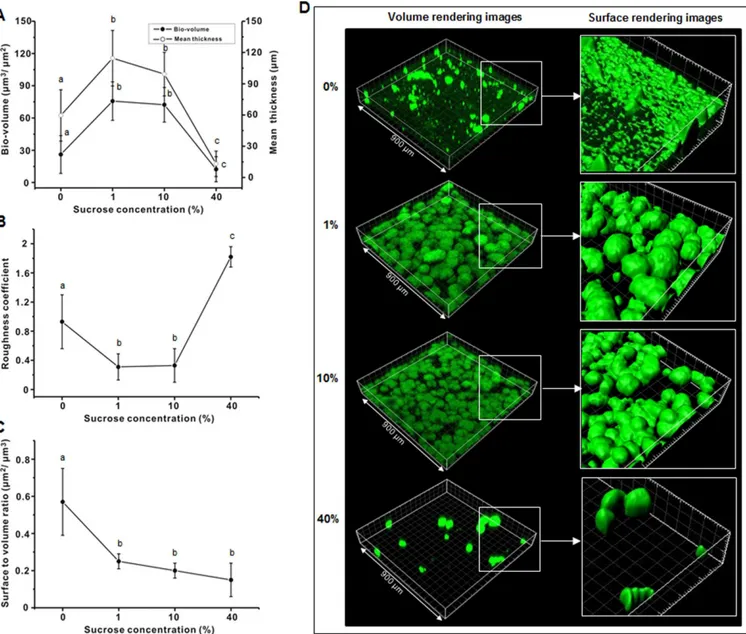
inFig 3A, the volume and mean thickness of the bacterial micro-colonies of the 46-h bio-films initially increased gradually and then decreased as the sucrose concentration increased. The bacterial bio-volume and mean thickness at 1 and 10% were at least 1.5 times higher than those at 0 and 40% (P<0.05). However, the roughness coefficient of the bacterial micro-colo-nies gradually decreased and then increased as sucrose concentration increased (Fig 3B); the roughness coefficient at 1 and 10% was at least 2.5 times lower than that at 0 and 40%. The sur-face to volume ratio of the bacterial micro-colonies at 0% was higher than that at 1, 10, and 40% (Fig 3C).Fig 3Dshows representative bacterial images from the CLSM study, in which the bacterial micro-colonies at 1 and 10% were bigger, more spherical, and more aggregated than that at 0%, whereas there were only scattered large micro-colonies at 40% (Fig 3D).
Fig 1. Relationship between sucrose concentration andS.mutansadhesion at 4 h.(A) Bacterial adhesion. (B) Bio-volume. (C) Mean thickness. (D) Representative confocal images of bacteria in the biofilms. (E) Representative confocal images of EPS in the biofilms. Values followed by the same letters are not significantly different from each other (P>0.05).
The bio-volume and mean thickness of the EPSs in the 46-h biofilms also gradually
increased and then decreased as sucrose concentration increased (Fig 4A). The bio-volume and mean thickness of the EPSs were minimal at 0 and 40%, but EPSs were strongly formed at 1 and 10%.Fig 4B and 4Cshow the roughness coefficient and surface to volume ratio of the EPSs, which showed an opposite pattern to that observed for bio-volume and mean thickness.
Fig 4Dshows representative EPS and total biofilm (EPSs + bacteria) surface rendering images, in which the EPSs were hardly detected at 0 and 40% and the bacterial micro-colonies were not covered by EPSs at these concentrations.
In addition,Fig 5shows representative SEM images (5,000×) of the 46-h biofilms in differ-ent concdiffer-entrations of sucrose. It was appardiffer-ent that the biofilms at 1 and 10% exhibited a larger amount of EPSs covering the micro-colonies than those at 0 or 40%, which was consistent with the results of the CLSM study (Figs3and4).
Fig 2. Relationship between sucrose concentration andS.mutansbiofilm formation.(A) Dry weight. (B) Bacterial viability. (C) Water-insoluble EPSs. (D) Acidogenicity. In A and C, the dry weight and amount of water-insoluble EPSs at 0% were not detected. In B and D, since x coordinates are plotted on a logarithmic scale, and since the log of 0 is undefined, we approximated 0 with an x coordinate of 0.01.
Discussion
Biofilm formation is a complex process that is affected by many factors such as growth envi-ronment, nutrition, bacterial vitality, and surface characteristics [29,30]. Sucrose, an important substrate for dental biofilm formation, has been studied in a series of epidemiologic and experi-mental studies, which confirmed that sucrose can cause major biochemical and physiological changes during the process of cariogenic biofilm formation, and that, in turn, enhance its car-ies-inducing properties [17–19,31,32]. However, limited studies have been performed to eval-uate the effects of sucrose level on cariogenic biofilm formation. Therefore, in the present study, we determined the relationship between sucrose concentration andS.mutansadherence and biofilm formation. Although the biofilm mode used in the present study could provide sig-nificant benefits of establishing the reproducibility of data and reducing variance [28],
Fig 3. Effect of sucrose concentration on bacteria (A) bio-volume and mean thickness (B) roughness coefficient, and (C) surface to volume ratio of 46-hS.mutansbiofilm. (D) Representative 3-D images (isosurface rendering) of bacterial cells. Values followed by the same letters are not significantly different from each other (P>0.05).
additional studies are required to confirm the relationships between sucrose concentration and its influence on cariogenic biofilmsin vivosinceS.mutansdoes not occur in a monoculturein vivoand the environmental conditions in the present study differ from those in the oral cavity.
In the present study, 2ndorder polynomial fitting was performed to determine the relation-ships between sucrose concentration andS.mutansadherence or biofilm formation. The coef-ficient of determination (R2) of the polynomial curves in the present study ranged from 0.64 to 0.91 (P<0.05). This result indicates that the polynomial curves appropriately describeS. mutansadherence or biofilm formation in relation to sucrose concentration, and that 64–91% of the variation inS.mutansadherence or biofilm formation can be explained by variation in sucrose concentration.
Fig 4. Effect of sucrose concentration on EPS (A) bio-volume and mean thickness (B) roughness coefficient, and (C) surface to volume ratio of 46-hS.mutansbiofilm. (D) Representative 3-D images (isosurface rendering) of bacterial cells (green) and EPS (red). Values followed by the same letters are not significantly different from each other (P>0.05).
Adhesion of bacteria to a surface is a prerequisite for biofilm formation, and contributes to both biofilm development and maturation [29]. In the present study, adhesion ofS.mutansto sHA discs followed a 2ndorder polynomial curve with sucrose concentration dependence (MEC: 0.45%) (Fig 1A). Our data on the bacterial bio-volume during 4-h incubation further confirmed this pattern (Fig 1B–1D). These findings suggest that increasing sucrose levels increaseS.mutansadhesion up to a certain concentration (turning concentration), after which bacterial adhesion decreases as sucrose concentration increases. In the present study, the turn-ing concentration forS.mutansadhesion was 0.45% (Fig 1A). Although the mechanism by whichS.mutansadhesion was reduced at high concentration of sucrose was not revealed in the present study, the reduction may be due to the inhibitory effect on bacterial growth in a plank-tonic state. According to a previous study, the growth ofListeria monocytogenes, a gram-posi-tive bacterium, was also strongly affected at 20–60% sucrose [33], suggesting that the total number of gram-positive bacteria that can adhere to a surface might be reduced at high con-centrations of sucrose. In addition, the EPS bio-volume and thickness that formed during the bacterial adhesion stage were not affected by sucrose concentration in the present study (Fig 1B and 1C). This result may reflect the amount of EPSs synthesized during the experiment. As shown inFig 1B and 1E, the EPS bio-volume formation during 4-h incubation was too low to allow precise comparisons using CLSM images.
After adhesion to the surface, bacterial cells will accumulate and subsequently form micro-colonies through an EPS-mediated process, leading to biofilm formation [13]. As shown inFig 2, sucrose influences the dry weight, CFU counts, water-insoluble EPSs, and acidogenicity of the 46-h biofilms in a 2ndorder polynomial curve with concentration dependence. These find-ings suggest that sucrose can increase the accumulation and virulence ofS.mutansbiofilms up to a certain concentration (turning concentration), but the accumulation and virulence decrease as sucrose concentration further increases. In addition, in the present study, the maxi-mum effective concentrations of sucrose forS.mutansbiofilm formation ranged from 0.45 to 2.4% (Figs1and2). Interestingly, however, a previous study reported that the threshold of sucrose concentration for the formation of a cariogenic biofilm is 5%, in which 1–40% sucrose was treated 8 times (5 min/time) per day for 14 days [21]. The difference between the present and previous study can be attributed to differences in treatment duration, suggesting that the effect of sucrose on cariogenic biofilm formation is closely related to both concentration and treatment duration. Therefore, further studies will be needed to reveal the precise relationship between sucrose treatment duration and cariogenic biofilm formation.
In the present study, the appearance of the micro-colonies of the 46-h biofilms was also closely related to sucrose concentration (Fig 3D). As shown inFig 3B, the roughness coefficient of the micro-colonies at 1 and 10% was at least 2.5 times lower than that at 0 and 40%,
Fig 5. Representative SEM images (5000×) of 46-hS.mutansbiofilms in different concentrations of sucrose (0, 1, 10, 40%).
indicating that the micro-colonies at 1 and 10% were more homogeneous than that at 0 and 40%. However, interestingly, the surface to volume ratio at 40% was lower than that at 0% (Fig 3B and 3C), meaning that the exposure of the micro-colonies to nutrient flow was lower at 40% than at 0%. This result suggests that the exposure to nutrient flow at 40% was very limited even though the sucrose concentration was the highest tested. In general, although our findings con-firm the crucial role of sucrose in micro-colony development and in maintaining the three-dimensional structure of biofilms [13], they suggest an adverse effect on homogeneity and exposure to nutrient flow of biofilm micro-colonies at very high sucrose concentrations.
It is well documented that EPSs contribute to the bulk and physical integrity and stability of the biofilm matrix [15,34]. The change in EPSs also closely related to sucrose concentration (Fig 4). In the 46-h biofilms, the bio-volume and mean thickness of the EPSs at 1 and 10% were significantly higher than those at 0 and 40% (P<0.05) (Fig 4A), confirming the data from the biochemical study and SEM images (Figs2Cand5). Furthermore, the EPSs produced at 1 and 10% could cover the micro-colonies (Fig 4D). This result suggests that the micro-environment of the biofilms at 1 and 10% is different from that at 0 and 40% since the EPSs surrounding the micro-colonies may create chemical gradients due to differential diffusion of nutrients and metabolic products throughout the biofilm matrix [13].
Collectively, the results of the present study revealed that the effect of sucrose onS.mutans
adhesion and biofilm formation followed a 2ndorder polynomial curve with concentration dependence and the turning concentration ranged from 0.45 to 2.4%. These results can provide a fundamental basis for a more precise study on cariogenic biofilm development in relation to sucrose concentration. However, additional studies are required to confirm the statistical rela-tionships between sucrose concentration and its influence on cariogenic biofilmsin vivo.
Author Contributions
Conceived and designed the experiments: JGJ HKY JNC. Performed the experiments: JNC. Analyzed the data: JGJ JNC JEJ MHD MAK. Wrote the paper: JGJ JNC JEJ MHD MAK.
References
1. Bowen WH. Do we need to be concerned about dental caries in the coming millennium? Crit Rev Oral Biol Med. 2002; 13(2): 126–131. PMID:12097355
2. Marsh PD. Are dental diseases examples of ecological catastrophes? Microbiology. 2003; 149(2): 279–294.
3. Paes Leme AF, Koo H, Bellato CM, Bedi G, Cury JA. The role of sucrose in cariogenic dental biofilm for-mation–new insight. J Dent Res. 2006; 85(10): 878–887. PMID:16998125
4. Marsh PD. Controlling the oral biofilm with antimicrobials. J Dent. 2010; 38(Suppl 1): S11–S15. doi:10. 1016/S0300-5712(10)70005-1PMID:20621238
5. Kreth J, Zhu L, Merritt J, Shi W, Qi F. Role of sucrose in the fitness ofStreptococcus mutans. Oral Microbiol Immunol. 2008; 23(3): 213–219. doi:10.1111/j.1399-302X.2007.00413.xPMID:18402607 6. Tenuta LM, Del Bel Cury AA, Bortolin MC, Vogel GL, Cury JA. Ca, Pi, and F in the fluid of biofilm formed
under sucrose. J Dent Res. 2006; 85(9): 834–838. PMID:16931867
7. Paes Leme AF, Dalcico R, Tabchoury CP, Del Bel Cury AA, Rosalen PL, Cury JA. In situ effect of fre-quent sucrose exposure on enamel demineralization and on plaque composition after APF application and F dentifrice use. J Dent Res. 2004; 83(1): 71–75. PMID:14691117
8. Loesche WJ. Role ofStreptococcus mutansin human dental decay. Microbiol Rev. 1986; 50(4): 353– 380 PMID:3540569
9. Mogen AB, Chen F, Ahn SJ, Burne RA, Wang D, Rice KC. Pluronics Formulated Farnesol Promotes Efficient Killing and Demonstrates Novel Interactions with Streptococcus mutans Biofilms. PLoS One. 2015; 10(7): e0133886. doi:10.1371/journal.pone.0133886PMID:26222384
10. Bowen WH, Koo H. Biology ofStreptococcus mutans-derived glucosyltransferases: role in extracellular matrix formation of cariogenic biofilms. Caries Res. 2011; 45(1): 69–86. doi:10.1159/000324598
11. Sendamangalam V, Choi OK, Kim D, Seo Y. The anti-biofouling effect of polyphenols against Strepto-coccus mutans. Biofouling. 2011; 27(1): 13–19. doi:10.1080/08927014.2010.535897PMID:21104475 12. de Sousa DL, Lima RA, Zanin IC, Klein MI, Janal MN, Duarte S. Effect of Twice-Daily Blue Light
Treat-ment on Matrix-Rich Biofilm DevelopTreat-ment. PLoS One. 2015; 10(7): e0131941. doi:10.1371/journal. pone.0131941PMID:26230333
13. Koo H, Xiao J, Klein MI, Jeon JG. Exopolysaccharides produced byStreptococcus mutans glucosyl-transferases modulate the establishment of microcolonies within multispecies biofilms. J Bacteriol. 2010; 192(12): 3024–3032. doi:10.1128/JB.01649-09PMID:20233920
14. Kim D, Hwang G, Liu Y, Wang Y, Singh AP, Vorsa N, et al. Cranberry Flavonoids Modulate Cariogenic Properties of Mixed-Species Biofilm through Exopolysaccharides-Matrix Disruption. PLoS One. 2015; 10(12): e0145844. doi:10.1371/journal.pone.0145844PMID:26713438
15. Schilling KM, Bowen WH. Glucans synthesized in situ in experimental salivary pellicle function as spe-cific binding sites forStreptococcus mutans. Infect Immun. 1992; 60(1): 284–295. PMID:1530843 16. Vacca-Smith AM, Bowen WH. Binding properties of streptococcal glucosyltransferases for
hydroxyapa-tite, saliva-coated hydroxyapahydroxyapa-tite, and bacterial surfaces. Arch Oral Biol. 1998; 43(2): 103–110. PMID:
9602288
17. Cury JA, Rebello MA, Del Bel Cury AA. In situ relationship between sucrose exposure and the composi-tion of dental plaque. Caries Res. 1997; 31(5): 356–360. PMID:9286518
18. Cury JA, Rebelo MA, Del Bel Cury AA, Derbyshire MT, Tabchoury CP. Biochemical composition and cariogenicity of dental plaque formed in the presence of sucrose or glucose and fructose. Caries Res. 2000; 34(6): 491–497. PMID:11093024
19. Cury JA, Francisco SB, Del Bel Cury AA, Tabchoury CP. In situ study of sucrose exposure, mutans streptococci in dental plaque and dental caries. Braz Dent J. 2001; 12(2): 101–104. PMID:11445910
20. Mattos-Graner RO, Smith DJ, King WF, Mayer MP. Water-insoluble glucan synthesis by mutans strep-tococcal strains correlates with caries incidence in 12- to 30-month-old children. J Dent Res. 2000; 79 (6): 1371–1377. PMID:10890715
21. Aires CP, Tabchoury CP, Del Bel Cury AA, Koo H, Cury JA. Effect of sucrose concentration on dental biofilm formed in situ and on enamel demineralization. Caries Res. 2006; 40(1): 28–32. PMID:
16352877
22. Ccahuana-Vásquez RA, Tabchoury CP, Tenuta LM, Del Bel Cury AA, Vale GC, Cury JA. Effect of fre-quency of sucrose exposure on dental biofilm composition and enamel demineralization in the pres-ence of fluoride. Caries Res. 2007; 41(1): 9–15. PMID:17167254
23. Hefti A, Schmid R. Effect on caries incidence in rats of increasing dietary sucrose levels. Caries Res. 1979; 13(5): 298–300. PMID:288513
24. Imfeld TN. Identification of low caries risk dietary components. Monogr Oral Sci. 1983; 11: 1–198. PMID:6575251
25. Jeon JG, Klein MI, Xiao J, Gregoire S, Rosalen PL, Koo H. 2009; Influences of naturally occurring agents in combination with fluoride on gene expression and structural organization ofStreptococcus mutansin biofilms. BMC Microbiology. 2009; 9: 228. doi:10.1186/1471-2180-9-228PMID:19863808 26. Pandit S, Cai JN, Song KY, Jeon JG. Identification of anti-biofilm components inWithania somnifera
and their effect on virulence ofStreptococcus mutansbiofilms. J Appl Microbiol. 2015; 119(2): 571– 581. doi:10.1111/jam.12851PMID:25976122
27. Heydorn A, Nielsen AT, Hentzer M, Sternberg C, Givskov M, Ersbøll BK, et al. Quantification of biofilm structures by the novel computer program COMSTAT. Microbiology. 2000; 146(10): 2395–2407.
28. Pandit S, Kim JE, Jung KH, Chang KW, Jeon JG. Effect of sodium fluoride on the virulence factors and composition of Streptococcus mutans biofilms. Arch Oral Biol. 2011; 56(7): 643–649. doi:10.1016/j.
archoralbio.2010.12.012PMID:21241981
29. Marsh PD. Dental plaque as a biofilm and a microbial community-implications for health and disease. BMC Oral Health. 2006; 6(Suppl 1): S14. PMID:16934115
30. Chau NP, Pandit S, Jung JE, Jeon JG. Evaluation ofStreptococcus mutansadhesion to fluoride var-nishes and subsequent change in biofilm accumulation and acidogenicity. J Dent. 2014; 42(6): 726– 734. doi:10.1016/j.jdent.2014.03.009PMID:24694978
31. Nobre dos Santos M, Melo dos Santos L, Francisco SB, Cury JA. Relationship among dental plaque composition, daily sugar exposure and caries in the primary dentition. Caries Res. 2002; 36(5): 347– 352. PMID:12399695
33. Meldrum RJ, Brocklehurst TF, Wilson DR, Wilson PDG. The effects of cell immobilization, pH and sucrose on the growth of Listeria monocytogenes Scott A at 10°C. Food Microbiology. 2003; 20: 97– 103