COMPUTATIONAL FLUID DYNAMICS
OF WINDTURBINE BLADE AT VARIOUS
ANGLES OF ATTACK AND LOW
REYNOLDS NUMBER
S. RAJAKUMAR*, Dr.D.RAVINDRAN**
*AssistantProfessor, Department of Mechanical Engineering, Anna University of Technology, Tirunelveli, Tamilnadu, India
**Prof & Head, Department of Mechanical Engineering, National Engineering College, Kovilpatti, Tamilnadu, India
ABSTRACT
Lift and Drag forces along with the angle of attack are the important parameters in a wind turbine system. These parameters decide the efficiency of the wind turbine. In this paper an attempt is made to study the Lift and Drag forces in a wind turbine blade at various sections and the effect of angle of attack on these forces. In this paper NACA 4420 airfoil profile is considered for analysis of wind turbine blade. The wind turbine blade is modeled and several sections are created from root to tip. The Lift and Drag forces are calculated at different sections for angle of attack from 0o to 12o for low Reynolds number. The analysis showed that angle of attack of 5o has high Lift/Drag ratio. The CFD analysis is also carried out at various sections of blade at angle of attack of 5o. The pressure and velocity distributions are also plotted. The airfoil NACA 4420 is analyzed based on computational fluid dynamics to identify its suitability for its application on wind turbine blades and good agreement is made between results. Keywords: Lift, Drag, NACA, CFD
NOMENCLATURE
C Blade chord
CD Drag coefficient
CL Lift coefficient
r Local blade radius
Vo Mean wind velocity at hub height
Vrel Resultant wind velocity
α Angle of attack ρ Air density θ Twist angle φ Inflow angle
ω Blade angular velocity
1. INTRODUCTION
tools, 3-D blade element and momentum (BEM) theory, in which the unsteady flow effects are either ignored, or modeled using a synthesis of 2-D data.
Aerodynamic studies are quite mature for flows with Reynolds number greater than 106. However, there are not many analytical or numerical or experimental studies available for flows at very low Reynolds numbers. Consideration of 2D geometries, i.e., airfoils, for such studies seems to be a good starting point to improve our understanding of low Reynolds number flows. Some experimental studies are reported in [1, 2, 3]. Numerical studies, for analysis as well as for design and experimental validations of airfoils at ultralow Reynolds number are presented in [4, 5].
1.1.Lift and Drag
Lift on a body is defined as the force on the body in a direction normal to the flow direction. Lift will only be present if the fluid incorporates a circulatory flow about the body such as that which exists about a spinning cylinder. The velocity above the body is increased and so the static pressure is reduced. The velocity beneath is slowed down, giving an increase in static pressure. So, there is a normal force upwards called the lift force.
The drag on a body in an oncoming flow is defined as the force on the body in a direction parallel to the flow direction. For a windmill to operate efficiently the lift force should be high and drag force should be low. For small angles of attack, lift force is high and drag force is low. If the angles of attack (α) increases beyond a certain value, the lift force decreases and the drag force increases. So, the angle of attack plays a vital role.
2. METHOD OF ANALYSIS
The aerofoil NACA 4420 is chosen for blade modeling as shown in fig.1. NACA 4420 profiles are obtained from Design Foil Workshop for various chords [6]. The modeling is done with Solid Works. The blade is modeled for the specification given in Table.1.
Table.1.Blade specification
Profile NACA 4420
Root chord length 1651 mm Tip chord length 650 mm
Length of blade 10700 mm Hub diameter 337.5 mm
Hub length 1465 mm
Hub to blade(neck) 1475 mm
Fig.1. NACA 4420 Airfoil
The velocity triangle of airfoil profile is used to calculate lift and drag forces shown in fig.2. The value of φ is found by the following formula. The wind velocity is taken as 8m/s and the speed is taken as 45 r.p.m.
φ = tan -1 (8/ (2πr (45/60)))
The angle of attack (AOA) α is found by the following formula α = φ- θ
The angle of attack value is given as input in the Design Foil Workshop software and the values of CL and CD are
found out.
The lift and drag forces are calculated by the following formula and the lift to drag ratio (L/D ratio) is also found out.
Lift = (1/2)*ρ* CL*c*L*Vrel2
Drag = (1/2)*ρ* CD*c*L*Vrel2
Where ρ – density of air - 1.225 kg/m3 c – Chord length in meter – 1m
L – Length of the blade element - 1m
Vrel – relative velocity of air in m/s = ((Vo)2 + (rω)2)0.5
The values of CL and CD were found out for various angles of attack.
Lift = (0.5*ρ*c*L* CL*Vrel2)
Drag = (0.5*ρ*c*L* CD*Vrel2)
The Lift and Drag forces are calculated for the angle of attack from 0 to 12 degree. The Lift/Drag ratio is calculated for different angle of attack ranges from 0o to 12o for the velocity ranges from 3 to 12 m/sec. The lift/drag ratio for different angle of attack is shown in Table.2.
The L/D ratio for the different angle of attack and different velocity is plotted in Fig.3. The correlation between coefficient of lift and coefficient of drag is shown in
Fig.4.Table.2. Lift/Drag Ratio
Angle of attack
L/D RATIO
Vo=5 m/s Vo=6m/s Vo=7 m/s Vo=9 m/s Vo=10 m/s Vo=11 m/s Vo=12 m/s
0 50.7 53.60 55.60 56.2 57.9 59.10 60.30
1 59.7 62.40 64.70 68.5 69.9 71.30 72.80
2 67.2 70.80 73.50 75 76.5 78.00 80.40
3 70 73.00 76.30 80.6 82.2 84.70 86.50
4 75.4 78.70 78.80 83.9 86.3 88.00 88.10
5 74.3 77.80 81.10 82.6 84.9 85.70 88.00
6 72.3 75.50 78.40 83.6 85 83.20 85.30
7 69.2 72.50 75.10 79.7 81.5 83.50 85.00
8 65.8 68.70 71.40 75.5 77.1 78.80 80.10
9 64.4 64.50 66.80 70.7 72.1 74.00 75.10
10 59.6 62.20 61.60 65.2 66.7 68.00 69.30
11 54.6 56.70 58.80 61.9 63.4 64.80 63.60
Fig.3. Correlation between L/D ratio and angle of attack
Fig.4. correlation between CL and CD
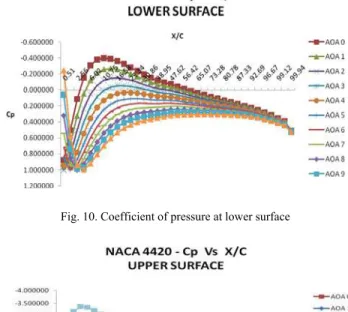
The cross sections of the blade are created at different sections from root to tip as shown in Fig.5. At this sections lift and drag forces are determined. The lift and drag forces at different distance from hub are calculated for various angles of attack shown in Fig.6 and Fig.7. Increase in lift and drag forces for various angles of attack also calculated and shown in Fig.8 and fig.9. The coefficient of pressure is calculated at the upper and lower surface is calculated and presented in fig.10 and fig.11.
Fig.6.lift forces at various length
Fig.7.Drag forces at various length
Fig.8. Increase in lift for various AOA
Fig. 10. Coefficient of pressure at lower surface
Fig. 11. Coefficient of pressure at upper surface
3. NUMERICAL METHOD
The numerical method utilized for the simulation had a density based solver with implicit formulation, 2-D domain geometry, absolute velocity formulation, and superficial velocity for porous formulation. For this test, a simple solver and an external compressible flow model for the turbulence was utilized. The green-gauss cell based was used for the gradient option. There are different equations used for flow, turbulence, species, and energy [7]. A simple method was used for the pressure-velocity coupling. For the discretization, a standard pressure was used, and density, momentum and turbulent kinetic energy were set to second order upwind. [8, 9].
3.1. Flow Analysis
The computational flow analysis is also performed for NACA 4420 profile. The four sections are considered for flow analysis at the blade from root to tip show in Table.3.
Table.3. Sections from hub
Section Distance from hub (m) Chord length (m) 1 2 3 4 2.95 5.275 8.375 10.7 1.651 1.348 0.9469 0.65
3.2. Geometry and Boundary conditions
Inlet velocity for the experiments and simulations is 10 m/sec and turbulence viscosity ratio is 10. A fully turbulent flow solution was used in ANSYS FLUENT, where Spalart-Allmaras equation was used for turbulent viscosity. A simple solver was utilized and the operating pressure was set to zero. Calculations were done for the “linear” region, i.e. for angles of attack 5 degrees, due to greater reliability of both experimental and computed values in this region [10, 11]. The airfoil profile and boundary conditions are all created. The airfoil consists of 71 vertices and two edges (upper and lower edge) as shown in Fig.12.
Fig.12.Meshing
Fig.13.Velocity Plot – 0o Angle of attack
Fig.15.Velocity plot –5o Angle of attack
Fig.16.Pressure plot –5o Angle of attack
Fig.18.Velocity plot –10o Angle of attack
Fig.19. Pressure plot –10o Angle of attack
Fig.21.Pressure plot –15o Angle of attack
4. RESULTS AND DISCUSSION
In this paper a Horizontal axis wind turbine blade with NACA 4420 is designed and analyzed for different angle of attack and at various sections.
The blade with constant angle of attack throughout the length is analyzed to find the maximum L/D ratio. This is done at angle of attack ranging from 0° to 12° for the velocity varies from 3 -12 m/sec. The maximum L/D ratio is achieved at 5° of angle of attack, for the average velocity of 8 m/sec. It is found that blade with 5° angle of attack has the maximum L/D ratio.
The coefficient of Lift and drag is calculated for this NACA 4420 series for the angle of attack 0° to 20°. The coefficient of Lift increases with increase in Angle of attack up to 14o. After 14o, the coefficient of lift decreases and stall occurs at this angle of attack.
The coefficient of pressure is analyzed in the upper and lower surface of the airfoil for the angle of attack varies from 0° to 10°. The results showed that the upper surface has lower negative coefficient of pressure at higher angle of attack and lower surface has lower negative coefficient of pressure at lower angle of attack.
The lift force at various lengths from hub to tip is analyzed and it is cleared that lift force increases from hub to tip for all range of angle of attack. The lift force increases with increase in angle of attack up to 14o and it starts to decrease after 14o. The drag forces begin of dominate beyond this angle of attack. The rate of increase in lift is more for angle of attack from 0o to 10o and between 10o to 15o the rise in lift force is less.
But the drag force increases with increase in angle of attack from hub to tip. The rate of increase in drag increase gradually unlike the rate of increase in lift from 0o to 16o of angle of attack and between 10o to 15o the rise in lift force is less.
The CFD analysis also carried out using ANSYS FLUENT software. The velocity and pressure distribution at various angles of attack of the blade is shown in Fig. 13-21. These results are coinciding with the wind tunnel experimental values. Hence the results are validated with the experimental work.
It could be observed that the upper surface on the airfoil experiences a higher velocity compared to the lower surface. By increasing the velocity at higher Mach numbers there would be a shock wave on the upper surface that could cause discontinuity.
5. REFERENCES
[1] Schmitz, F. W., Aerodynamics of the model airplane. Part I. Airfoil measurements, NACA TM X-60976, 1967.
[2] Sunada, S., Sakaguchi, A., Kawachi, K.,Airfoil section characteristics at a low Reynolds number, Journal of Fluids Engineering, Vol.119, pp.129-135, 1997.
[3] Sunada, S., Yasuda, T., Yasuda, K., Kawachi, K.,Comparison of wing characteristics at an ultralow Reynolds number, Journal of Aircraft, Vol.39, pp.331-338, 2002.
[4] Kroo, I., Kunz, P. J.,Meso-scale ight and miniature rotorcraft development, Proceedings of the Conference on Fised, Flapping and Rotary Vehicles at very Low Reynolds Numbers, edited by T. J. Mueller, Univ. of Notre Dame, Notre Dame, IN, pp.184-196, 2000.
[5] Kunz, P. J., Kroo, I.,Analysis, design and testing of airfoils for use at ultra-low Reynolds numbers, Proceedings of the Conference on Fised, Flapping and Rotary Vehicles at very Low Reynolds Numbers, edited by T. J. Mueller, Univ. of Notre Dame, Notre Dame, IN, pp.349-372, 2000. [6] H. Abbott, A.E. von Doenhoff, L. Stivers, NACA Report No. 824 – Summary of Airfoil Data, National Advisory Committee for Aeronautics. [7] Thumthae C, Chitsomboon T. Numerical simulation of flow over twisted-blade, horizontal axis wind turbine. The 20th conference of mechanical engineering network of Thailand; October 2006.
[8] Kim B, Kim J, Kikuyama K, Rooij V, Lee Y. 3-D numerical predictions of horizontal axis wind turbine power characteristics of the scales delft university T40/500 model. The fifth JSME-KSME fluids engineering conference, Japan; 2002.
[9] Mandas N, Cambuli F, Carcangiu CE. Numerical prediction of horizontal axis wind turbine flow. European wind energy conference, Athens, Greece; 2006.
[10] Laursen J, Enevoldsen P, Hjort S. 3D CFD rotor computations of a multimegawatt HAWT rotor. European wind energy conference, Milan, Italy; 2007.