www.biogeosciences.net/13/6049/2016/ doi:10.5194/bg-13-6049-2016
© Author(s) 2016. CC Attribution 3.0 License.
Unveiling the Si cycle using isotopes in an iron-fertilized zone of
the Southern Ocean: from mixed-layer supply to export
Ivia Closset1, Damien Cardinal1, Mathieu Rembauville2, François Thil3, and Stéphane Blain2
1Sorbonne Universités (UPMC, Univ Paris 06)-CNRS-IRD-MNHN, LOCEAN Laboratory, 4 place Jussieu,
75005 Paris, France
2Sorbonne Universités (UPMC, Univ Paris 06)-CNRS, Laboratoire d’Océanographie Microbienne (LOMIC),
Observatoire Océanologique, 66650 Banyuls/mer, France
3Laboratoire des Sciences du Climat et de l’Environnement, CNRS 91190 Gif-sur-Yvette, France
Correspondence to:Ivia Closset ([email protected])
Received: 1 June 2016 – Published in Biogeosciences Discuss.: 8 June 2016
Revised: 14 September 2016 – Accepted: 28 September 2016 – Published: 3 November 2016
Abstract. A massive diatom bloom forms annually in the surface waters of the naturally iron-fertilized Kerguelen Plateau (Southern Ocean). In this study, silicon isotopic sig-natures (δ30Si) of silicic acid (DSi) and suspended
bio-genic silica (BSi) were investigated through the whole wa-ter column with unprecedented spatial resolution, during the KEOPS-2 experiment (spring 2011). We used δ30Si mea-surements to track the sources of silicon that fuelled the bloom, and investigated the seasonal evolution of the Si bio-geochemical cycle in the iron-fertilized area. We compared the results from stations with various degrees of iron enrich-ment and bloom conditions to an HNLC reference station. Dissolved and particulateδ30Si signatures were highly vari-able in the upper 500 m, reflecting the effect of intense silicon utilization in spring, while they were quite homogeneous in deeper waters. The Si isotopic and mass balance identified a unique Winter Water (WW) Si source for the iron-fertilized area that originated from southeast of the Kerguelen Plateau and spread northward. When the WW reached a retroflec-tion of the Polar Front (PF), the δ30Si composition of the silicic acid pool became progressively heavier. This would result from sequential diapycnal and isopycnal mixings be-tween the initial WW and ML water masses, highlighting the strong circulation of surface waters that defined this zone. When comparing the results from the two KEOPS expedi-tions, the relationship between DSi depletion, BSi produc-tion, and their isotopic composition appears decoupled in the iron-fertilized area. This seasonal decoupling could help to explain the low apparent fractionation factor observed in the
ML at the end of summer. Taking into account these consid-erations, we refined the seasonal net BSi production in the ML of the iron-fertilized area to 3.0±0.3 mol Si m−2yr−1,
which was exclusively sustained by surface water phyto-plankton populations. These insights confirm that the iso-topic composition of dissolved and particulate silicon is a promising tool to improve our understanding of the Si bio-geochemical cycle since the isotopic and mass balance al-lows resolution of processes in the Si cycle (i.e. uptake, dis-solution, mixing).
1 Introduction
The Southern Ocean plays a crucial role in the regulation of the global climate as it contributes significantly to the world’s ocean primary production and represents a major carbon sink (Takahashi et al., 2009). In the Southern Ocean, diatoms, a phytoplankton group that produces an opaline cell wall called a frustule (amorphous SiO2nH2O), are responsible for more
as the “opal belt” (Tréguer and De la Rocha, 2013; Rague-neau et al., 2000).
Since diatoms preferentially take up light silicon isotopes (28Si), their biological activity leaves a clear imprint on the isotopic composition of both silicic acid (H4SiO4, hereafter
referred to as DSi) and BSi, enriching the DSi pool with the heavy 30Si isotope (De la Rocha et al., 1997). While a re-cent in vitro study has pointed out that this preferential up-take may vary among diatom species (ranging from−0.54 to −2.09 ‰, Sutton et al., 2013), field studies have reported a
constant Si isotopic fractionation factor (30ε)for the
Antarc-tic Circumpolar Current, ACC (e.g. De la Rocha et al., 2000; Cardinal et al., 2005), estimated to −1.2±0.2 ‰ on aver-age (Fripiat et al., 2011a). In the reverse reaction, it is not clear whether BSi dissolution fractionates silicon isotopes. Two studies based on laboratory experiments provide contra-dictory results. Wetzel et al. (2014) performed alkaline diges-tion of diatom opal in sediment cores and reported no pref-erential release of a given isotope. Conversely, Demarest et al. (2009) placed fresh siliceous particles in undersaturated seawater and reported a fractionation factor of−0.55 ‰
as-sociated with the dissolution process. The fractionation of dissolution opposes the one occurring during Si uptake (BSi dissolution preferentially releases28Si) which would reduce the overall (or net) fractionation factor. Thus, information on the silicon isotopic composition (δ30Si) potentially enables
to identify DSi sources, and discriminate and quantify differ-ent processes such as Si uptake, BSi dissolution, or physical mixing (e.g. Fripiat et al., 2011a).
Diatoms generate the largest latitudinal gradient of DSi in the world in the Southern Ocean because of their absolute requirement for silicic acid, from replete conditions south of the PF, in the Antarctic Zone (AZ), to depleted condi-tions in the Sub-Antarctic Zone (SAZ; e.g. Brzezinski et al., 2001; Sarmiento et al., 2004). This contrasts strongly with the high nutrient low chlorophyll (HNLC) characteristics of the Southern Ocean, which could be more specifically de-fined as a high nitrate low silicon low chlorophyll area (HNL-SiLC, Dugdale et al., 1995). Several studies based on in vitro and artificial Fe enrichments have shown that Fe stress is partly responsible for the HNLSiLC status of the ACC (see the review in De Baar et al., 2005; Boyd et al., 2007). In par-allel, several field studies have investigated the effect of nat-ural iron delivery on the biogeochemical cycles (e.g. Blain et al., 2007; Pollard et al., 2009).
The KEOPS project consisted of two expeditions (late summer 2005 and early spring 2011) conducted in a nat-urally iron-fertilized area in the vicinity of the Kerguelen Plateau where a massive phytoplankton bloom is observed annually (Mongin et al., 2008). The first KEOPS expedition (January–February 2005) has highlighted that this bloom is sustained by iron supply originating from iron-rich deep wa-ters through winter mixing and vertical diffusion in summer (Blain et al., 2007). The second expedition also revealed that episodic deepening of the mixed layer (ML) could also
con-tribute to the vertical supply of Fe (Bowie et al., 2015). Sili-con isotopes studied during the first cruise highlighted impor-tant aspects of the Si biogeochemical cycle in both the HNLC and the fertilized area (Fripiat et al., 2011a). It was suggested that the decline of the bloom was strongly controlled by sili-cic acid and iron co-limitations (Mosseri et al., 2008). Re-sults from KEOPS-2 (October–November 2011) have shown that the Kerguelen bloom was characterized by a complex and heterogeneous distribution of phytoplankton communi-ties (e.g. Lasbleiz et al., 2014), constrained by a mosaic of biogeochemical conditions (Park et al., 2014).
Isotopic variations induced by biological Si utilization in the Southern Ocean ML can be described in a first approxi-mation using two different models for closed and open sys-tems. In the closed system (also referred to as the Rayleigh model) the surface ocean is considered to have a finite pool of DSi that is not replenished by any external sources. In this case, the reaction progresses in a sequential mode over time: the initial substrate (here silicic acid) is consumed in the ML, which exponentially increases theδ30Si of the remain-ing substrate (Eq. 1). The isotopic composition of the short-term or instantaneous product (here exported BSi, Eq. 2) dif-fers from the long-term product that accumulates (here BSi in the ML) which holds the same signature as the initial sub-strate when everything is consumed in the system (Eq. 3): δ30Sisub=δ30Siinit−30εln(1−f ), (1)
δ30Siinst=δ30Sisub+30ε, (2)
δ30Siacc=δ30Siinit−30ε
f×lnf 1−f
, (3)
where30εis the isotopic fractionation factor of the reaction, f is the fraction of the remaining substrate, and the subscripts “sub”, “init”, “acc”, and “inst” refer to the remaining sub-strate, the initial subsub-strate, the accumulated product, and the instantaneous product respectively.
A distinct system is an open, flow-through system (also re-ferred to as a steady-state model) where a continuous supply of substrate balances the export of product. In this model, the DSi supply equals the sum of the BSi produced and immedi-ately exported and the residual DSi stock leaving the system. Only one product forms from substrate and bothδ30SiDSiand
δ30SiBSisignatures display linear changes (Eqs. 4 and 5):
δ30Sisub=δ30Siinit−30ε(1−f ), (4)
δ30Siprod=δ30Siinit+30ε×f. (5)
In these two ideal situations, the130Si, i.e. the difference betweenδ30SiDSiandδ30SiBSi, is considered constant.
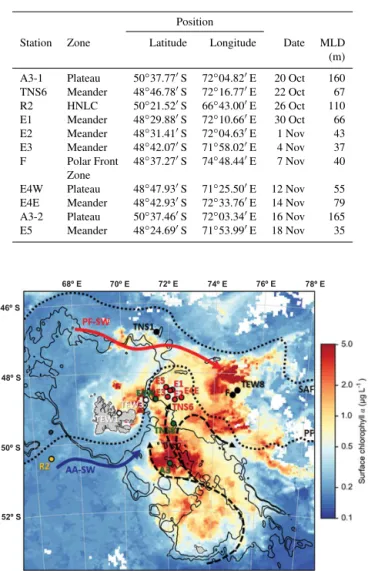
Table 1. Characteristics of the stations sampled during KEOPS-2 and discussed in this study. MLD represents the mixed-layer depth (from Park et al., 2014).
Position
Station Zone Latitude Longitude Date MLD (m) A3-1 Plateau 50◦37.77′S 72◦04.82′E 20 Oct 160 TNS6 Meander 48◦46.78′S 72◦16.77′E 22 Oct 67
R2 HNLC 50◦21.52′S 66◦43.00′E 26 Oct 110 E1 Meander 48◦29.88′S 72◦10.66′E 30 Oct 66
E2 Meander 48◦31.41′S 72◦04.63′E 1 Nov 43 E3 Meander 48◦42.07′S 71◦58.02′E 4 Nov 37
F Polar Front 48◦37.27′S 74◦48.44′E 7 Nov 40 Zone
E4W Plateau 48◦47.93′S 71◦25.50′E 12 Nov 55 E4E Meander 48◦42.93′S 72◦33.76′E 14 Nov 79
A3-2 Plateau 50◦37.46′S 72◦03.34′E 16 Nov 165 E5 Meander 48◦24.69′S 71◦53.99′E 18 Nov 35
46º S
48º S
50º S
52º S
68º E 70º E 72º E 74º E 76º E 78º E
Figure 1.Map of the KEOPS-2 cruise area (Indian sector of the Southern Ocean) showing the locations of the stations. Coloured dots represent the different regions discussed in this study: yellow for HNLC, green for plateau, red for meander, black for polar front, and white for coastal stations. The general surface circulation (from Park et al., 2014) is shown with arrows; the blue arrow is the Antarc-tic Surface Waters, and the red arrow is the Polar Front Surface Wa-ter. The Polar Front and the Sub-Antarctic Front are represented by black dotted lines. The colour represents the detailed map of the satellite-derived surface chlorophyllaconcentration (MODIS level 3 product) averaged over the cruise period, and black lines are 500 and 1000 m isobaths.
trend lying between the two curves and depending on the Si-uptake : Si-supply ratio occurring in the system (Fry, 2006). This could be particularly the case in the Southern Ocean, where large nutrient consumption was observed in regions characterized by intense mixing events that strongly deepen the ML and bring DSi in surface waters (e.g. Brzezinski et al., 2001; Nelson et al., 2001).
In this paper, we investigate the spatial and seasonal variability of silicon isotopic composition of both seawater (δ30SiDSi)and siliceous particles (δ30SiBSi)in deep and
sur-face waters of the Kerguelen area during the spring period. Our specific objectives are the following.
– Describe the early-spring spatial distribution of silicon isotopes across the range of productivity observed near the Kerguelen Islands.
– Discuss the potential role of iron in regulating the Si biogeochemical cycle and isotope dynamics in the Southern Ocean surface and subsurface waters. – Refine the net BSi production estimated by Fripiat et
al. (2011a) using the appropriate spring biogeochemical conditions (DSi concentration andδ30Si).
– Finally, identify and track the Si sources that fuel the phytoplankton bloom above the plateau and character-ize the temporal evolution of the silicon biogeochemical cycle by combining our 2 results with KEOPS-1 data.
2 Material and methods 2.1 Sample collection
The cruise consisted of two transects north to south (TNS sta-tions) and east to west (TEW stasta-tions) aimed at documenting the spatial extension of the bloom and its coastal-offshore gradient, and 11 long-term stations devoted to process stud-ies (see Fig. 1 and Table 1):
– A HNLC reference station (R2) located upstream of the eastward ACC flow, south of the Kerguelen Islands, hereafter referred to as HNLC station.
– Two visits at the KEOPS-1 plateau bloom reference sta-tion (A3-1 and A3-2), and at a moderately productive station (E4W) located in the plume of chlorophyll north of A3, hereafter referred to as plateau stations.
– An open ocean station (F) influenced by warmer Sub-antarctic Surface Waters, located north of the PF, here-after referred to as the Polar Front Zone.
– Six stations (TNS6 and E1 to E5) constituting a pseudo-Lagrangian survey and located in the area of PF retroflection characterized by strong mesoscale activity (Zhou et al., 2014) and hereafter referred to as meander stations.
from in situ pumps (ISP). At all stations, seawater and parti-cles were collected using a CTD (conductivity–temperature– depth) rosette equipped with 12 L Niskin bottles. Seawater (approximately 5 L) was immediately filtered through poly-carbonate membranes (Nuclepore, 0.4 µm) using large vol-ume filtration units. Filtered water samples were stored in the dark in acid-cleaned polypropylene bottles and mem-branes were dried overnight at 50◦C and stored in polycar-bonate Petri dishes at room temperature. Since particle con-centration decreases with depth, deep-water particles were collected using in situ pumps at seven stations by filtering 70 to 1800 L of seawater through hydrophilic polyestersul-fone membranes (SUPOR, 0.8 µm). Approximately 1/8 of the SUPOR membranes were dedicated to silicon isotopic analysis and were dried overnight at 50◦C and stored in Petri
dishes at room temperature.
Sinking particles were collected from a moored sedi-ment trap (Technicap PPS3) that was deployed at station A3 over the central Kerguelen Plateau at 289 m (seafloor depth 527 m). The sediment trap carrousel was composed of 12 sampling cups (250 mL) collecting sinking particles from the 21 October 2011 to 7 September 2012. Sampling intervals were programmed to be short (10–14 days) in spring and summer and longer (99 days) in autumn and winter. A de-scription of the physical environment of the deployment to-gether with the detailed methods for sediment trap sample processing are reported in Rembauville et al. (2015). After the BSi extraction (Rembauville et al., 2015), samples were purified and analysed for the Si isotopic composition as de-scribed below.
2.2 Sample preparation
2.2.1 Particle digestion and BSi analyses
The membranes (Nuclepore and SUPOR) were subjected to a wet-alkaline digestion (adapted from Ragueneau et al., 2005). BSi was dissolved in Teflon tubes using a 0.2 mol L−1 NaOH solution (pH 13.3) at 100◦C for 40 min followed by neutralization with HCl (1 mol L−1). As this digestion can also solubilize some lithogenic silica (mainly clay minerals), a second and identical digestion was applied to the mem-branes that were then analysed for aluminium (Al, a tracer of lithogenic source) using an inductively coupled plasma mass spectrometer (ICP-MS; detection limit=3.18 ppb). Us-ing the Si : Al ratio measured in the second digestion, the lithogenic silicon dissolved in the first digestion can be es-timated (Ragueneau et al., 2005). Unfortunately, the poly-carbonate membranes used for silicon isotopic analysis were contaminated by Al during filtrations onboard. However, SU-POR filters as well as Al concentrations estimated on other filters (Lasbleiz et al., 2014) revealed negligible lithogenic silicon in the first leachate (on average 1.26 % for SU-POR filters). Such a lithogenic contribution should not bias significantly our δ30Si value. Indeed, using a light
end-memberδ30SiLSiof−2.3 ‰ reported in clays (Opfergelt and
Delmelle, 2012) and our maximumδ30SiBSi(2.06 ‰ station
R2, 2400 m) as extreme end-members, we calculated a max-imum interference in the isotopic signal of 0.05 ‰ which is similar to our analytical precision forδ30Si. BSi concentra-tions were determined with a colorimetric method accord-ing to Grasshoff et al. (1999) and by ICP-MS on the same samples used to measure Si isotopic composition. Every ISP sample was analysed in full duplicates (i.e. on a second frac-tion of the same membrane) with a pooled standard deviafrac-tion of 5.0±4.6 % (n=58), which corresponds to our average reproducibility of BSi measurements, and which is slightly better than the uncertainty estimated for this method (10 %, Ragueneau et al., 2005). Moreover, independent measure-ments of BSi concentration performed with Niskin bottles at the same stations and depths during KEOPS-2 by Lasbleiz et al. (2014) were similar to our results, suggesting that the ISP method was robust.
2.2.2 Seawater preconcentration and DSi analyses A two-step preconcentration procedure adapted from the MAGIC method (Karl and Tien, 1992; Reynolds et al., 2006) was performed on seawater samples to increase H4SiO4
con-centration and reduce the anionic matrix that could inter-fere with Si during isotopic analysis (e.g. sulfates, SO24−; Hughes et al., 2011). DSi was co-precipitated in two steps with brucite (Mg(OH)2)by adding 2 % (v/v), followed by
1 % (v/v) of 1 M NaOH to the seawater sample. This so-lution was shaken and left for 1 h and the precipitate was recovered by centrifugation and redissolved with 1 M HCl. The supernatant was removed and Si recovery was monitored by checking systematically that no detectable amount of sili-cic acid remained in the supernatant after co-precipitation and centrifugation. DSi concentrations in seawater samples were determined with a colorimetric method (Grasshoff et al., 1999) on the same samples as for Si isotopic composi-tion. The average reproducibility of DSi measurements was 6.7 % (calculated from 98 in-house silicon solution analyses at the±1 SD level).
2.3 Purification
originating from seawater can be neglected compared to Cl−
added as HCl to dissolve the brucite. Therefore the solutions dedicated to DSi isotopic measurements were analysed by anionic chromatography to control the concentration of sul-fates. Indeed, in these samples, SO24−concentrations could induce a significant shift in isotopic measurements (see the supplementary method and Van den Boorn et al., 2009, for rock digestion solutions). Thus, as proposed by Hughes et al. (2011), samples and standards used for DSi isotopic anal-yses were doped with sulfuric acid in large excess compared to the natural SO24− concentrations in order to control this sulfate matrix effect.
2.4 Isotopic measurements
The purified and sulfate doped Si solutions were analysed for isotopic measurements on a Thermo Neptune+ multicollec-tor inductively coupled plasma mass spectrometer (MC-ICP-MS; LSCE, Gif-sur-Yvette) in dry plasma mode using Mg external doping to correct for the mass bias (Cardinal et al., 2003; Abraham et at., 2008). Samples were injected into the plasma with an Apex desolvating nebulization system con-nected with a PFA nebulizer (100 µL min−1uptake rate) and
without additional gas. Silicon isotopic compositions (δ30Si) were calculated as the permil deviation from the quartz stan-dard NBS28 (RM8546). They were measured relative to an in-house standard Quartz Merck, which was not significantly different from NBS28 (Abraham et al., 2008), analysed im-mediately after and before the sample, and expressed as
δ30Si(‰)=
" 30
Si/28Si sample
30Si/28Si
standard−1 #
×1000. (6)
Blank levels were below 1 % of the main signal and were subtracted from each sample and standard analysis. All measurements were carried out in a matrix composed of HNO3 0.5 mol L−1, HCl 0.5 mol L−1, H2SO4 1 mmol L−1,
and medium-resolution mode (M/1M > 6000) to optimize the separation of 30Si peak and 14N16O interference and were performed on the interference-free left side of the peak (Abraham et al., 2008).δ29Si andδ30Si were compared to the mass-dependent fractionation line (Fig. S3) and samples falling outside of its analytical error were excluded from the final dataset. Typical analytical conditions are provided in Table S3.
Numerous analyses of a secondary reference material such as diatomite (δ30Si=1.26 ‰, Reynolds et al., 2007) gener-ated over the entire procedure indicgener-ated an average precision and a long-term analytical reproducibility (24 months) on δ30Si values of 1.28±0.05 ‰ (1 SD,n=128) and confirmed
that no uncorrected isotopic bias occurred. All BSi samples and some DSi samples were fully replicated and measured on separate days (chemical preparation plus isotopic measure-ments). In these cases, the average full external reproducibil-ity on full duplicates δ30Si is 0.06 ‰ (1 SD, n=108) and
0.04 ‰ (n=78) forδ30SiBSiandδ30SiDSirespectively. Error
bars shown in all figures correspond to the analytical repro-ducibility or to the full external reprorepro-ducibility if greater than 0.05 ‰.
3 Results and discussion
3.1 KEOPS-2 cruise, hydrological settings, and general considerations
The KEOPS-2 expedition was conducted in the Kerguelen Plateau region (Indian sector of the Southern Ocean) from 10 October to 20 November 2011 (austral spring) on board of the R/VMarion Dufresne. The plateau acts as a barrier to the ACC, 60 % of which passes north of the Kerguelen Islands, mostly associated with the SAF, while 40 % is trans-ported across the southern part of the plateau and forms the jet of the PF (Park et al., 2014). This PF current is then de-flected to the north following the eastern escarpment of the plateau and forms a permanent cyclonic meandering associ-ated with strong mesoscale activity (Park et al., 2014; Zhou et al., 2014). The circulation above the central Kerguelen Plateau is relatively weak (< 3 cm s−1, Park et al., 2008b), providing good conditions for elevated primary production (Mongin et al., 2008). These particular hydrographic fea-tures generate contrasted biogeochemical and physical en-vironments where phytoplankton communities will respond differently to iron availability. During KEOPS-2, the vertical distribution of water masses was characteristic of the Antarc-tic zone (AZ) in the vicinity of the PF (Park et al., 2014). Except for the first visit at over the plateau (A3) where they reached the surface, the remnant Winter Water (WW, gen-erally from 100 to 400 m) was capped by a homogeneous, warm, and fresh mixed layer (ML) or Antarctic Surface Wa-ter (AASW) induced by seasonal stratification. Below these subsurface waters, a subsurface temperature maximum be-tween 400 and 1400 m associated with the Upper Circumpo-lar Deep Waters (UCDW) followed the Lower CircumpoCircumpo-lar Deep Water (LCDW) in all of the out-plateau stations. The deeper Antarctic Bottom Waters (AABW) were found only at station F, north of the PF.
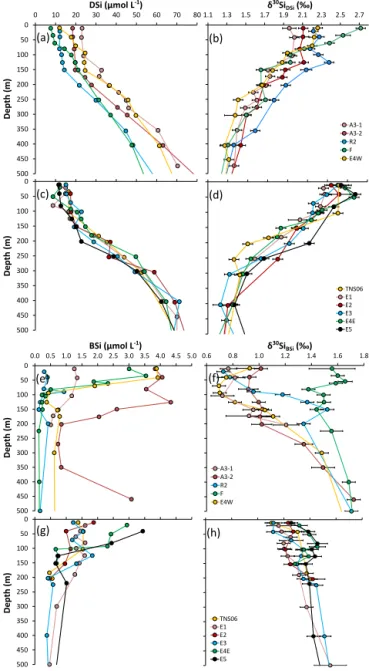
During KEOPS-2, δ30SiDSi displayed a clear inverse
re-lationship with silicic acid concentration, as commonly ob-served in the Southern Ocean (Fig. S4 in the Supplement and e.g. in Fripiat et al., 2012; De Souza et al., 2012). The wa-ter column profiles showed a general increase in DSi con-centrations (Fig. 2a, c). δ30SiDSi became gradually lighter
with depth (Fig. 2b, d). In the upper 500 m,δ30SiBSivalues
were systematically lighter thanδ30SiDSivalues (Fig. 2f, h),
in agreement with the preferential uptake of28Si by diatoms (De La Rocha et al., 1997). Below 500 m there was a slight increase inδ30SiBSi and a decrease inδ30SiDSi values,
thanδ30SiDSi(on average 1.74±0.13 and 1.20±0.17 ‰
re-spectively). This observation differs significantly from the one observed in the Atlantic sector in summer by Fripiat et al. (2012), where the isotopic signature of BSi exported to depth was directly comparable to theδ30SiBSi values of
particles in the ML. The surface KEOPS-2 δ30SiBSi
(rang-ing from 0.47 to 2.04 ‰) and δ30SiDSi (ranging from 1.96
to 2.79 ‰) encompassed nearly the full range of delta re-sults reported from previous Southern Ocean studies (−0.7
to 2.8 ‰ for BSi and 0.5 to 4.4 ‰ for DSi, e.g. De Souza et al., 2012; Fripiat et al., 2012). Recently, there have been some concerns regarding Si isotopic offsets among laborato-ries on North Atlantic data (see Brzezinski and Jones, 2015) as well as on the GEOTRACES intercalibration (Grasse et al., 2016). We have compared the deep KEOPS-2 samples, measured using a Neptune+MC-ICP-MS (this study) after a
chemical purification adapted from Hughes et al. (2011) with data from KEOPS-1, measured using a Nu Instrument MC-ICP-MS (Fripiat et al., 2011a) after a chemical purification adapted from De La Rocha et al. (1996). Despite the two dif-ferent sample processing methods and instrumentation, the two datasets show an offset of only 0.08 ‰ (Fig. S4), which is not analytically significant and allows the direct compari-son between KEOPS-1 and KEOPS-2 delta values.
In general, δ30SiDSi signatures in deep waters were
ho-mogeneous and did not show large changes with depth or between stations (on average 1.28±0.08 and 1.05±0.06 ‰ for UCDW and LCDW respectively). There was much higher variability inδ30SiDSiin the ML and WW between stations
(1.99 to 2.53 and 1.46 to 2.03 ‰ respectively; Table S4). Note that the WW exhibited systematically the largest dis-persion of delta values and was systematically associated with a strong isotopic gradient toward light δ30SiDSi with
depth (not shown). Consequently, the mean and median val-ues were probably not representative of the specific Si con-centration and isotopic composition of the WW. Usually, the temperature-minimum layer (Tminbetween 1.5 and 2◦C in
the Kerguelen area; Park et al., 2014) is the traditional defi-nition of the remnant surface winter water. However, in some stations, it was not possible to clearly determine Tmin(e.g.
R2 and E2) and/or there was a significant salinity gradient above theTmindepth (e.g. F). Trull et al. (2015) have
pro-posed that a shallower depth based on a threshold increase in salinity of 0.05 (Sthreshold depth) could better represent the WW characteristics. They ascribed undeterminableTmin
to weaker winter mixing compared to the previous year and, thus, the nutrient depletion between theTmin andS
thresh-old depths could not be associated with recent consumption. In the following we will use theSthreshold approach since it is the most appropriate reference to reflect the pre-bloom biogeochemical conditions. 0 50 100 150 200 250 300 350 400 450 500 0 50 100 150 200 250 300 350 400 450 500
0 10 20 30 40 50 60 70 80
0 50 100 150 200 250 300 350 400 450 500
0.0 0.5 1.0 1.5 2.0 2.5 3.0 3.5 4.0 4.5 5.0
0 50 100 150 200 250 300 350 400 450 500
0.6 0.8 1.0 1.2 1.4 1.6 1.8 DSi (µmol L-1
)
BSi (µmol L-1)
δ30 SiDSi (‰)
δ30SiBSi (‰)
Dep th ( m) Dep th ( m) Dep th ( m) Dep th ( m) A3-1 A3-2 R2 F E4W TNS06 E1 E2 E3 E4E E5
1.1 1.3 1.5 1.7 1.9 2.1 2.3 2.5 2.7
A3-1 A3-2 R2 F E4W TNS06 E1 E2 E3 E4E E5 (a) (b) (c) (d) (e) (f) (g) (h)
Figure 2.Vertical profiles of biogenic silica and silicic acid con-centration (µmol L−1)and isotopic composition (‰) of dissolved (panelsatod) and particulate silicon (paneletoh) for the main contrasted KEOPS-2 stations (A3, R2, E4W and F-L) and for the meander stations (TNS6, E1, E2, E3, E4E and E5).
3.2 Distribution of Si isotopes vs. source and supply of iron
3.2.1 The HNLC reference station
non-siliceous organisms (see details in Lasbleiz et al., 2014, and Closset et al., 2014). In surface waters of the HNLC area, the concentration of biogenic silica was the lowest mea-sured in the surface during KEOPS-2 (0.30±0.03 µmol L−1) and its silicon isotopic composition was low (0.73±0.04 ‰)
and similar to A3-1 (Fig. 2e, f). This is typical of non-bloom conditions and in the same range as those measured in HNLC waters of the Southern Ocean (e.g. Fripiat et al., 2011a, b; Mosseri et al., 2008). However, the HNLC sta-tion displayed unexpectedly low silicic acid concentrasta-tion and heavy δ30SiDSi in the ML (12.94±0.49 µmol L−1 and
2.21±0.06 ‰ respectively; Fig. 2a, b). This latter one is sig-nificantly heavier than the Si isotopic composition of the fer-tilized area measured a few days before (1.99±0.03 ‰, A3-1). As already proposed by Closset et al. (2014) and Las-bleiz et al. (2014), this suggests that a development of di-atoms could have occurred before our sampling, consum-ing a fraction of the DSi standconsum-ing stock and increasconsum-ing the δ30SiDSi of surface waters. The same evidence of surface
production has also been deduced by Dehairs et al. (2015), who observed a slight nitrate depletion and enrichment of δ15N–NO−3. The low iron concentration that prevails at this station in early spring might have been sufficient to trigger a short phytoplankton growth (dominated by nanophytoplank-ton; Lasbleiz et al., 2014) as soon as light conditions be-came favourable. Then, both the high silica dissolution to production ratio (D:P> 1) observed in the ML (Closset et al., 2014) and the high barium excess measured between 200 and 400 m (Jacquet et al., 2015) suggest that this material was exported and remineralized by the time we visited the station. This could be confirmed by the clearδ30SiBSi
max-imum observed between 100 and 200 m (Fig. 2f) that could result from the dissolution isotopically light diatoms initially produced from lighter DSi.
By contrast, all other KEOPS-2 stations outside of the HNLC were characterized by the development of large spring blooms that were not homogeneous in time and space de-pending on the degree, the mode, and the timing of their iron fertilization (Bowie et al., 2015; Trull et al., 2015). These blooms were organized in three main clusters related to their different iron supplies and are discussed separately in the fol-lowing.
3.2.2 The Kerguelen Plateau zone
This area was characterized by large and recurrent blooms located southeast of the islands, mainly above the Kerguelen Plateau and delimited northward by the Polar Front (Blain et al., 2001, 2007). During our first visit to A3 (A3-1), low δ30SiDSi and δ30SiBSi (1.99±0.03 and 0.77±0.05 ‰
re-spectively; Fig. 2b, f) were measured in the ML, indicating that biogeochemical conditions prevailing there were char-acteristics of a pre-bloom or early-bloom period. Indeed, low chlorophylla and BSi concentrations were observed despite high nutrients standing stocks (H4SiO4and NO−3; see Blain
et al., 2015 for NO−3)and relatively high iron concentrations (Bowie et al., 2015).
The largest phytoplankton development was observed dur-ing the second visit to A3, where chlorophyll a and BSi concentrations increased more than 2-fold over 1 month. This growth was reflected by the significant increase in both δ30SiDSi andδ30SiBSi (from 1.99±0.03 to 2.10±0.05 and
from 0.77±0.05 to 0.96±0.08 ‰ respectively; Fig. 2b, f).
There, the supply of nutrients and iron to the ML coming from the WW both in winter and during the productive period allowed a spring biogenic silica production comparable to the most productive regions in the world, such as upwelling sys-tems or river plumes (up to 43.4±0.4 mmol m−2d−1for net
opal production integrated over the euphotic zone, Fripiat et al., 2011a; Closset et al., 2014).
3.2.3 The recirculation zone in the Polar Front meander
The central part of the meander was characterized by a com-plex and slowly flowing water circulation associated with low to moderate dissolved iron concentrations (Bowie et al., 2015; Quéroué et al., 2015). Here, surface waters displayed generally higherδ30SiDSisignatures and lower DSi
concen-trations compared to above the plateau (TNS6, E1 to E5; Fig. 2d), supporting the idea of a northward surface circula-tion with progressive consumpcircula-tion and enrichment in the30Si
of the dissolved pool. According to Park et al. (2014), this zone could correspond to the latest arrival of water originat-ing from the shallow plateau located south of these stations. This would explain the delay observed between the initia-tion of producinitia-tion here and the southernmost bloom located above the plateau and in the PF plume (Fig. 1). Moreover, the radium isotope signature (Sanial et al., 2015) suggested that the southward transport of chemical elements (such as iron) across the PF could also occur and significantly fuel the phy-toplankton bloom in this area, mixing the Si-poor PF ASW with heavyδ30SiDSiand Si-rich AASW with lightδ30SiDSi.
The moderate iron fertilization occurring in the mean-der should have increased both the BSi production rate and biomass, with a larger increase at the two last visits (E4E and E5, Closset et al., 2014; Lasbleiz et al., 2014). However, no clear trend was identified in the ML values ofδ30SiDSi
and δ30SiBSi since these two parameters were not
signifi-cantly different from TNS6 to E4E (Table S4). This obser-vation is strengthened by the homogeneousδ30SiDSiprofiles
1 1.5 2 2.5 0
50 100 150 200 250 300 350 400 450 500
Dep
th
(
m)
δ30Si
DSi (‰)
0.5 1.0 1.5 2.0 2.5
δ30 SiBSi (‰)
0 50 100 150 200 250 300 350 400 450 500
Dep
th
(
m)
0 20 40 60 80
DSi (µmol L-1
)
BSi (µmol L-1
)
0 2 4 6 8 10
C11 KEOPS-1 A3 KEOPS-1 A3-1 A3-2 R2
(a) (b)
(c) (d)
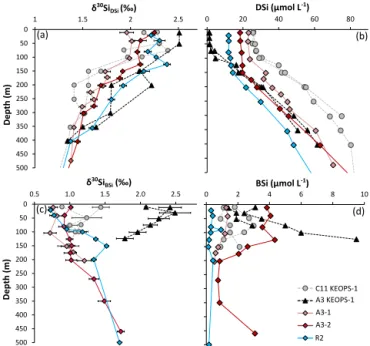
Figure 3.Seasonal evolution of the dissolved and particulate sili-con isotope composition (aandc) and concentration (bandd) in the upper 500 m of the iron-fertilized (A3) and HNLC (C11 or R2) reference stations. Summer isotopic signatures (KEOPS-1, Fripiat et al., 2011a) are in grey and black colours; results from the spring period (this study) are in red and blue colour.
we observed slightly in Fig. 2d), and diatoms would produce lighter BSi at the top of the ML.
3.2.4 The Polar Front Zone
A plume of chlorophyll a was present in the Polar Front Zone (station F, Fig. 1), extending eastward of the Kergue-len Plateau and showing strong mesoscale activity associated with the temporal and spatial variability of the Polar Front (Park et al., 2014). There, the productive waters were char-acterized by a shallow and relatively warm ML (> 4◦C) as-sociated with moderate to high iron concentration (Quéroué et al., 2015; Bowie et al., 2015), providing favourable con-ditions for phytoplankton development. These waters were characterized by distinctly different phytoplankton commu-nities (mostly small diatoms and nanoflagellates) than those found above the plateau (Lasbleiz et al., 2014). The Si iso-topic composition of ML seawater and particles measured at F were the heaviest of the KEOPS-2 stations coinciding with strong Si depletion in surface water (Fig. 2b, f). These δ30SiDSisignatures fall in the range of previous reported
val-ues in the PFZ ML, from 2.05±0.03 ‰ in spring
(Cardi-nal et al., 2005) to 2.77±0.23 ‰ in late summer (Fripiat
et al., 2011a) in the Australian and Atlantic sectors of the Southern Ocean respectively. In the PFZ, heavierδ30Si sig-natures can be attributed to a higher utilization of silicic acid by diatoms leading to high net BSi production (Closset et al.,
2014). Note that higherδ30SiDSivalues were also measured
in the PFZ WW (on average 2.14±0.08 ‰ for all stations lo-cated north of the PF, Fig. 2b). This confirms that the source of Si is different in the PFZ than in the AZ. These PFZ wa-ters can be advected by mixing with wawa-ters north of the Polar Front, including coastal waters, bearing higherδ30SiDSidue
to the progressive export of lowδ30SiBSialong their eastward
advection (Bowie et al., 2015; Park et al., 2014).
3.3 Spatio-temporal variability of Si mass and isotopic balance in the iron fertilized area
By comparing the present dataset with the one collected dur-ing KEOPS-1 (summer 2005), the seasonality of the Si iso-topic composition can be described, helping to refine the Si biogeochemical cycle in this area (Fripiat et al., 2011a; De Brauwere et al., 2012). For this purpose, the short-term tem-poral evolution of the bloom initiation (two visits at A3) was examined by several visits in the meander that constituted a pseudo-Lagrangian time series (covering 27 days, Table 1). The silicon isotopic properties measured in the ML during the austral spring (KEOPS-2) were significantly lighter than those measured by Fripiat et al. (2011a) at the end of sum-mer (Fig. 3) as expected from the seasonal progression of the preferential light Si isotope consumption (De la Rocha et al., 1997). Temporally, the bloom above the plateau usu-ally peaks in late November and declines graduusu-ally until Jan-uary as nutrients (mainly iron and silicic acid) became limit-ing (Blain et al., 2007; Mongin et al., 2008). Then, a sec-ond and smaller bloom could persist at steady state until May, when the light level started to be insufficient to main-tain photosynthetic activity (Blain et al., 2013). The first visit to A3 revealed relatively high DSi concentrations and low BSi and chlorophylla stocks in the ML and WW that can be associated with the initial conditions prevailing be-fore the summer stratification (Park et al., 2014; Blain et al., 2015), whereas concentrations andδ30Si measured at A3 during KEOPS-1 represent the conditions at the end of the season (Fig. 3). These initial conditions (31.6±2.2 µmol L−1
and 1.76±0.03 ‰ for A3-1 WW DSi concentration and
iso-topic composition respectively) differ from the HNLC WW chosen by Fripiat et al. (2011a) as the ultimate Si source fuelling the bloom above the plateau (52.5±3.3 µmol L−1
and 1.5±0.0 ‰ for DSi concentration andδ30SiDSi
respec-tively), but were not significantly different from the A3 WW reported by Fripiat et al. (2011a). Indeed, ML δ30SiDSi in
the early spring was clearly off the steady-state fractionation trend (not shown) when using the same initial Si pool con-ditions as in Fripiat et al. (2011a). Thus, it appears that the WW Si pool isotopic and content properties of the HNLC KEOPS-1 or KEOPS-2 reference stations could not be ap-plied as a common Si source for ML over the plateau. In the meander, the initial conditions were represented by the Si properties of TNS6 WW (31.3 µmol L−1and 1.71±0.02 ‰
0.0 1.0 2.0 3.0 4.0
0.0 0.2
0.4 0.6
0.8 1.0
δ
30Si ‰
f Source
TNS6 E2
E3 E4E
K1
E1 K1
E5
E4W
A3-1
E5 E3
E2 E1 A3-2
E4E TNS6
A3-2 E4W A3-1
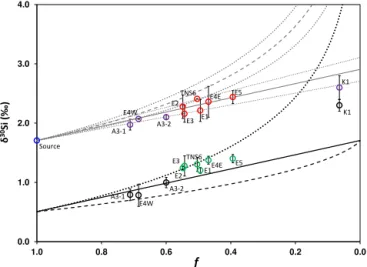
Figure 4. Silicon isotopic composition vs. remaining silicic acid (f) for the different ML Si reservoirs in the iron-fertilized areas of the Kerguelen Plateau. A unique source (averaged plateau WW, blue dot, 32.9±2.2 µmol Si L−1and 1.71±0.03 ‰) was used for all plateau and meander stations. ML dissolved Si pools above the plateau (purple dots) and in the meander (red dots) fit well with a steady-state fractionation law (grey straight line) but not with a Rayleigh distillation law (grey broken line). The grey dotted line represents the 0.2 ‰ SD of the fractionation factor. Note that given the small uncertainty of the source DSi andδ30Si characteristics, we have neglected this uncertainty, which is minor compared to the SD on30ε. ML particulate Si pools above the plateau (black dots) and in the meander (green dots) lie between the instantaneous and accu-mulated products predicted by a Rayleigh distillation model (dotted and broken lines respectively). The straight black line represents the products in the steady-state model. Summer isotopic signatures (K1 for A3 KEOPS-1) are from Fripiat et al. (2011a).
similar to those used for the plateau. This strengthens the idea of a unique Si source originating from the south and that flows northward above the shallow Kerguelen Plateau to finally reach the PF retroflection area. Thus, using the mean ACC30εvalue of−1.2±0.2 ‰ compiled by Fripiat
et al. (2011a) and the averaged plateau WW as initial con-ditions, we will attempt to describe the seasonal dynamic of the Si biogeochemical cycle in the fertilized area off the Ker-guelen Islands.
3.3.1 Mixed-layer dissolved Si pool
The seasonal evolution of δ30SiDSi in the fertilized area
is best described by steady-state fractionation equations (Fig. 4). The steady-state model assumes a continuous supply of substrate and thus no change in concentration with time. It should only represent a final snapshot and cannot reflect any temporal evolution. However, when steady-state equa-tions are used in a sequential time step, they allow consump-tion of substrate (Fry, 2006). In the case of the Kerguelen Plateau, Fripiat et al. (2011a) have already shown that the steady-state model better describes the seasonality of the
sil-icon isotopes in the ML, and it seems that our data confirm this observation. Indeed, in Fig. 4, most of the plateau and meander MLδ30SiDSistations were clearly off the Rayleigh
fractionation trend. In contrast, all MLδ30SiDSi data align
along a steady-state trend with decreasing f (i.e. increasing Si utilization): A3-1, A3-2, E1 to E4E meander stations, E5 and finally A3 KEOPS-1 representing the end of the growth season. These open system equations are thus appropriate to describe the Si utilization that occurred above the Kerguelen Plateau where deep and regular mixing events are expected to supply nutrients in surface waters (Park et al., 2008b). Sur-prisingly, in this model, meander stations exhibit higher iso-topic signatures and higher DSi depletion compared to the productive plateau stations A3-2 and E4W, while they were sampled several days before these two stations. This situa-tion was not due to a higher Si uptake in the meander ML as the net BSi production at A3-2 was twice that measured at E5 (Closset et al., 2014), but could be explained by a strong mixing event that occurred just before our second visit to A3. This vertical mixing was induced by strong temporary winds that supplied water with high silicic acid content and light δ30Si to the euphotic zone. This would thus decrease the ap-parent Si utilization (f) and lighten the isotopic signature of seawater. Note that, as previously mentioned, no clear tem-poral evolution can be shown in the meander MLδ30SiDSi
signatures. The hydrological conditions that lead to ML in-stabilities and regular mixing of the water masses were likely the reason for this situation, as we will discuss in the follow-ing.
Using KEOPS-1 HNLC WW characteristics (52.5±3.3 µmol Si L−1 and 1.5±0.0 ‰) to represent
the initial conditions of WW in the fertilized area and assuming that the system behaves following an open mode, Fripiat et al. (2011a) estimated a seasonal depletion in the ML at 5.0±0.3 mol Si m−2yr−1. By identifying a more
appropriate Si source for the plateau ML-averaged plateau WW (32.9±2.2 µmol Si L−1and 1.71±0.03 ‰) and using
the same equations, we can refine this calculation and reduce the seasonal net BSi production in the upper 100 m to 3.0±0.3 mol Si m−2yr−1. This flux is 40 % lower than
the previous estimate, but corresponds well to the range of published net BSi production values for the AZ (2.4 to 3.3 mol Si m−2yr−1; Pondaven et al., 2000; Nelson et al.,
2002; Pollard et al., 2006) and still balances the total Si sup-ply estimated for the plateau ML (4.0±0.7 mol Si m−2yr−1,
Fripiat et al., 2011a). The mean net BSi production occurring during the 27 days that separate the two samplings at A3 can also be estimated at 10.7 mmol m−2d−1 using the
Figure 5.Potential mixing curves between TNS6-WW and the dif-ferent meander ML water masses; WW is in blue and the ML is in red. The two end-members are identified by black curves. The two grey dashed lines represent the mixing curves between TNS6-WW and TNS6-ML and between TNS6-WW and E1-ML, which may explain the Si properties of E1-WW and E2-WW respectively. The ML averages and error bars were calculated based on the median values and interquartile range for each station, while the “central value” was defined using the salinity threshold method for WW.
3.3.2 Winter waters dissolved Si pool
By comparing WW DSi properties from KEOPS-1 HNLC and fertilized area (52.5±3.3 and 34.2±1.9 µmol Si L−1),
Fripiat et al. (2011a) estimated a seasonal depletion in the 100 to 400 m layer of 5.5±0.3 mol Si m−2yr−1and ascribe
it to a net BSi production by a subsurface diatom population since a deep BSi and chlorophyll maximum was observed here in January (Mosseri et al., 2008; Uitz et al., 2009). The WW characteristics measured during our first visit at A3 (31.5±2.2 µmol Si L−1; 1.76±0.03 ‰) were similar to the
one observed at the end of the productive season by Frip-iat et al. (2011a), suggesting that, contrary to what was pre-viously proposed, WW did not undergo seasonal Si uptake above the plateau. This conclusion is not contradictory to the development of a subsurface diatom community that could partly explain the deep BSi accumulation observed here dur-ing KEOPS-1. Indeed, in such communities, the BSi produc-tion may likely be sustained by a regenerated source of Si (highD:P ratio; see Closset et al., 2014, and Fripiat et al., 2011c, at the same station and in the Australian sector of the Southern Ocean respectively) or may benefit from high dif-fusive fluxes (> 1 mmol m−2d−1, Rembauville et al., 2016)
that characterize these transition layers and would not finally consume the DSi standing stock.
In contrast to the ML, the WWδ30SiDSisignatures of the
fertilized area (Table S4) display significant variations (from 1.71±0.02 at TNS6 to 2.21±0.02 ‰ at E4E). It seems
un-likely that such shift of WW toward higherδ30Si values could be explained by the progressive consumption of silicic acid by a secondary diatom community just below the ML. In-deed, although deep silica maximum are common features in
the Southern Ocean (Parslow et al., 2001), the Si uptake rates measured below the euphotic layer during KEOPS-2 were very low (Closset et al., 2014). Since this area has strong mesoscale physical activity (Zhou et al., 2014; Park et al., 2014), an alternative process that could decrease the WW DSi pool and increase the WWδ30SiDSimay be the vertical
mixing between initial WW and several sequential surface ML water masses (Fig. 5). Such a process is similar to what was observed forδ30SiDSiacross the major ACC meridional
overturning circulation and could result here from (i) the deepening of the MLD induced by wind stress and followed by the stratification of the water column; (ii) mesoscale activ-ity that generates negative vertical velocities of water masses. In this case, the resulting water mass should lie on a the-oretical mixing curve involving the TNS6 WW and differ-ent ML water masses with Si properties located between the initial and final ML end-members (TNS6 ML and E5 ML). For example, E1 WW could be fully explained by the ing of TNS6 WW and TNS6 ML, and E2 WW by the mix-ing between TNS6 WW and E1 ML. Although this hypoth-esis seems valuable for these two examples, the large vari-ability of the Si isotopic properties of WW water masses prevents us from identifying, with sufficient precision, the exact end-members of these mixings. Moreover, isopycnal mixings through mesoscale eddy activity could also explain this complexity. Indeed, the intense mesoscale activity asso-ciated with the meanders of the Polar Front and with major topographic obstacles such as the Kerguelen region, allows the transport of tracers and nutrients laterally through the PF (Dufour et al., 2015). Consequently, only a range of potential mixing curves has been identified in Fig. 5, but all the mean-der WW falls between these two extreme situations. Thus, when the water masses joined the meander, mixing between WW and ML as well as lateral advection led to an enrich-ment of the Si isotopic signature and a dilution of the DSi pool of this source.
3.3.3 Mixed-layer particulate Si pool
While the open system model seems appropriate to describe the evolution of DSi isotopic composition, it is arguable when considering theδ30SiBSi, since this model
which is impacted by the bloom maturity and/or the hydro-dynamical conditions of the surface waters. The instability of the ML depth at TNS6, “bloom-initiation” stations (E1, E2, and E3) and at E4E impacted the phytoplankton growth as discussed previously and may have led to important biomass export through detrainment. In these systems, diatoms did not accumulate in the ML but settled toward deeper layers, exporting carbon and BSi (Laurenceau-Cornec et al., 2015; Planchon et al., 2015). The Si isotopic properties at these stations felt close to the instantaneous product curve of the Rayleigh fractionation law (Fig. 4). Considering the early stage of the season during the KEOPS-2 expedition and since Si uptake rates above the plateau were among the highest reported so far for the Southern Ocean, it appears that BSi and C export was very low at A3 and E4W (Jacquet et al., 2015; Planchon et al., 2015; Rembauville et al., 2015). At A3 and E4W BSi accumulated in the ML, resulting in Si isotopic properties that seemed to be better described by the accumulated product curve of the Rayleigh model. The last two stations (E5, KEOPS-2, and A3, KEOPS-1) lay between the two curves since they combined the two biogeochemical processes (BSi accumulation and export). Indeed, the high Si uptake rates observed at E5 (20.5±0.2 mmol m−2d−1;
Closset et al., 2014) associated with the strengthening of the summer stratification would progressively reduce vertical Si supply and would support higher phytoplankton retention in the ML. KEOPS-1 expedition occurred during the decaying phase of the bloom. Thus, the biological material present in the ML at the end of summer was likely composed of old and detrital diatoms that were partly exported in December (Rembauville et al., 2015) and living cells that were pro-duced from regenerated Si sources (Closset et al., 2014). The δ30SiBSi observed in the late-summer surface waters would
be a combination of old particles that remained in the ML, with a lighter isotopic signature, and new and isotopically heavier diatoms that would increase the delta value. This sit-uation is consistent with the strong seasonality of primary and export production that characterizes the Southern Ocean and leads to a temporal decoupling between these two pro-cesses in the ML (see e.g. Rembauville et al., 2015a).
The contrasted seasonal evolution ofδ30SiDSiandδ30SiBSi
(following an open or a closed system respectively) is simi-lar to BSi and DSi isotopic offsets previously reported (e.g. Varela et al., 2004; Fripiat et al., 2012) leading to spatio-temporal variations of the ML 130Si (130Si=δ30SiBSi
-δ30SiDSi), with low 130Si at the end of summer when the
ML silicic acid pool was highly depleted. Fripiat et al. (2012) attributed such offsets to modifications of the uptake : Si-supply ratio in surface waters due to spatial variability of the biogeochemical conditions among the different zones of the ACC (AZ vs. PFZ). Our results point out an alternative: the change in130Si can be obtained when the BSi pool in the system switches between the Rayleigh instantaneous or ac-cumulated product depending on the BSi accumulation : BSi
export ratio. Indeed, the processes that can affect the isotopic dynamics in this region are complex.
Thus, several explanations are possible to describe the variations of130Si we observed (Fig. 4); however, it is diffi-cult to discriminate which one is the most relevant.
– The fractionation factor of diatoms (30ε) may vary over the season. Since there is no study that so far has fo-cused on30ε seasonal variations, we have considered the fractionation factor constant. Note that this may not reflect the reality in the ocean and that the constancy of the fractionation factor can be discussed. Moreover, one in vitro study has reported inter-specific variations of the fractionation factor (Sutton et al., 2013). This could yield to seasonal variation of the mean30εdue to the succession of diatoms species during the bloom (Las-bleiz et al., 2014).
– In the ocean, the distinction between steady-state and Rayleigh models can be tricky. Many situations, such as the Kerguelen bloom, can switch between charac-teristics of both closed and open system dynamics, re-sulting in changes in the apparent fractionation factor (130Si). As already proposed by Fripiat et al. (2012), we suggest that these variations are mainly controlled by the Si-uptake : Si-supply ratio of the system. When the Si-uptake : Si-supply ratio is high (during the bloom period), the system roughly follows a Rayleigh frac-tionation model. However, when the DSi pool limits Si uptake (at the end of the productive period), the Si-uptake : Si-supply ratio decreases and the supply of iso-topically light DSi into the ML by vertical mixing sig-nificantly decreases the δ30SiDSi. The δ30SiBSi is
af-fected differently since the BSi pool is composed of a mix of newly formed (and light) diatoms and isotopi-cally heavy diatoms that have been produced previously in the ML. Such a process would explain why we ob-serve late summer high δ30SiBSi associated with low
δ30Si of the DSi pool.
OCT NOV DEC JAN FEB MAR APR MAY JUN JUL AUG SEP 0
0.5 1 1.5 2 2.5 3
B
S
i(fl
u
x(c
mmo
l(m
‰2(d ‰1e
S
u
rfa
ce(Ch
l(
(c
µ
g(L
‰1e
δ
3
0S
i(c
‰
e
a
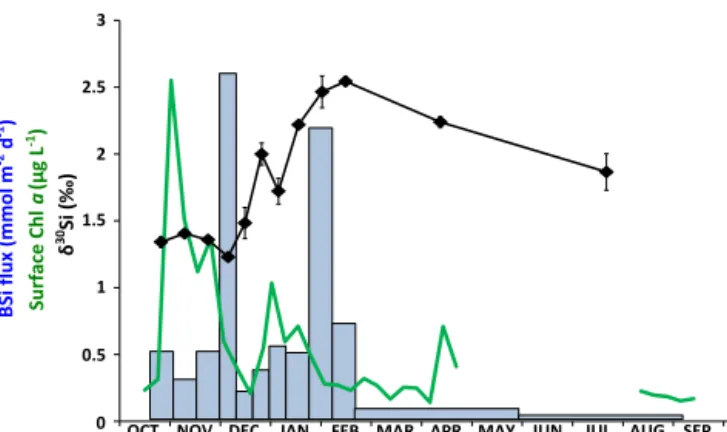
Figure 6.Surface chlorophyllaconcentration measured by satellite (green line), BSi fluxes collected in the sediment trap at 289 m (blue bars), and silicon isotopic composition of settling diatoms (black diamonds) at the A3 station.
3.3.4 Deep particulate Si fluxes
BSi export flux collected in the sediment trap located above the plateau shows two summer maxima (> 2 mmol m−2d−1
in early December 2011 and early January 2012) separated by a period of reduced flux (Fig. 6). In contrast, export dur-ing austral winter exhibited a long period of very low particle flux (< 0.2 mmol m−2d−1, from March to September 2012). These seasonal variations are associated with the evolution of surface chlorophyll a concentrations with a delay of ap-proximately 1 month, and were described in detail in Rem-bauville et al. (2015). This sediment trap dataset allows us to investigate the variations of exported opal δ30Si and subse-quently the mechanisms governing the seasonal variations of Si stocks and fluxes in the ML. Recent studies have suggested that the seasonal variations of the isotopic composition of ex-ported BSi may reflect the evolution ofδ30SiBSi in the ML
(Varela et al., 2004; Closset et al., 2015). In Fig. 6, we can identify five key periods in the seasonal Si biogeochemical cycle above the Kerguelen Plateau.
i. Early spring: the relatively lowδ30Si (1.34 in October to 1.23 ‰ in December) did not directly relate to the isotopic signature of diatoms in the ML at the same station for the same period (0.79±0.1 ‰ late Octo-ber, and 1.00±0.09 ‰ mid-November), but did corre-spond to the signature of particles collected between 200 and 450 m (1.21±0.1 ‰ late October, A3-1, and 1.34±0.07 ‰ mid-November, A3-2; Fig. 2f). Although Demarest et al. (2009) estimated a fractionation fac-tor of−0.55 ‰ during the dissolution of BSi, it seems
unlikely that this process would be responsible for the heavy isotopic signature of the deep particles since dis-solution rates are low during early spring (the disso-lution to production ratio measured in the ML during KEOPS-2 was very low above the plateau, less than 0.1, Closset et al., 2014). Moreover, recent studies have
pointed out that the isotopic signature of particles is well conserved through the water column and can be closely related to the DSi consumption in surface wa-ters (Fripiat et al., 2012; Closset et al., 2015). There-fore, assuming that theδ30Si of exported BSi followed either the accumulated Rayleigh or steady-state equa-tions, the 1.23 ‰ signature measured during the first export event corresponds to a DSi consumption ranging between 45 and 60 % of the winter DSi standing stock in the ML respectively and results in a DSi concentration remaining in the ML ranging between 18 (Rayleigh) and 13 µmol L−1(steady state) in November 2011 (1-month
delay between when the signal was produced in the ML and recorded in the trap). The remaining DSi concen-tration calculated from Rayleigh accumulated product equation is consistent with the DSi concentration mea-sured in the ML during the second visit to A3 in Novem-ber (19.7±0.3 µmol L−1, Fig. 2a) and confirms that, in
early spring, the BSi production in the ML follows more closely to the closed system mode.
ii. Early summer: during December, theδ30Si of settling particles increased from 1.23 to 1.99 ‰ as a result of diatom activity in the ML. These high values cannot be explained by the steady-state model. Applying the Rayleigh equations, we estimate a consumption of 71 % of the winter DSi standing stock. The assumptions be-hind this estimation are the following.
– The fractionation factor30εis constant.
– There is no significant BSi export during this period so the BSi accumulation : BSi export ratio is very high.
– There is no significant DSi supply during this pe-riod so the Si-supply : Si-uptake ratio is very low. These two last assumptions are consistent with the situa-tion encountered early summer, i.e. when the bloom has just started and when diatoms accumulates in the ML and have not consumed all the DSi stock. The remain-ing DSi concentration in the ML would be 9.5 µmol L−1
in November 2011 which is half of concentration mea-sured at A3 mid-November but which is close to the 12 µmol L−1 measured mid-November at E5. Such an
increase between the two BSi delta values corresponds to a net BSi production of 22.8 mmol m−2d−1
the whole of December. Additionally, DSi supply also occurs in summer (Fripiat et al., 2011a; Closset et al., 2014), a process that is not included in Rayleigh equa-tions but causes an underestimate BSi production. iii. Mid-summer. The sharp decrease in δ30Si of
set-tling particles observed in January 2012 (from 1.99 to 1.72 ‰) can be associated with a strong vertical mix-ing event that brmix-ings new and isotopically light DSi into the ML. This phenomenon has already been observed in open ocean sediment trap time series in the Antarc-tic Zone (Varela et al., 2004; Closset et al., 2015). As-suming that at this time of vertical mixing, the system behaves following an open mode (Fig. 4), this 0.27 ‰ δ30SiBSidecrease would correspond to the same change
in δ30SiDSi and to an increase of 7.6 µmol L−1 in the
DSi concentration in the ML (1.99 and 1.72 ‰ corre-spond to a DSi concentration of 32.5 and 25.0 µmol L−1 respectively). The assumptions behind this calculation are the following.
– The fractionation factor30εis constant.
– The DSi supplied into the system has the same iso-topic signature as the source. This assumption is re-alistic since the mixing event brings DSi from WW (source) into the ML.
– All the BSi and the remaining DSi should be re-moved from the system. We cannot verify this last assumption, but we can expect that a large fraction of the BSi was exported out of the ML mid-summer. This might be supported by the deep silica maxi-mum observed late summer below the ML (150 m) by Mosseri et al. (2008) at the same station. The subsequent DSi stock in the ML would be 17.1 µmol L−1 in December 2011. Using a simplistic approach (see the supplementary method) we estimate that such Si supply would require a ML deepening of ca. 37 m, which is consistent with the order of magnitude of ML variation in this area (Park et al., 2008b). High wind events could induce vertical mixing of the upper ocean, entraining cold water into the ML and bringing DSi into the euphotic zone. Integrating the DSi increase of 7.56 µmol L−1over this new ML (80 m+37 m)
sug-gests a supply of 884 mmol m−2. Such a mixing event
would represent approximately 74 % of the total sum-mer supply (1200 mmol m−2; Closset et al., 2014) and
would allow the second bloom to appear as observed in January 2012 (Rembauville et al., 2015). Sporadic up-welling through Ekman pumping above the plateau (see Gille et al., 2014) could also bring DSi into the ML, but considering its low intensity, it is unlikely that it could sustain the needed flux of DSi. Note that if the closed model is considered, the δ30SiBSi signal would
correspond to a consumption of 64 % of the winter DSi
stock and thus an increase in the DSi concentration of 2.3 µmol L−1in the ML. This value would imply a
deep-ening of the ML by only 8.75 m and a summer supply of 204 mmol m−2which does not correspond to the one estimated by Closset et al. (2014). This highlights, as proposed previously, the fact that BSi isotopic and mass balance can follow either a closed or an open mode depending on physical and biogeochemical conditions which vary during the growing season.
iv. Late summer: theδ30Si increased from 1.72 to 2.54 ‰ due to a second episode of enhanced biological activity in the ML. Using the Rayleigh equations (Fig. 4), this highest value corresponds to a consumption of 82 % of the winter DSi standing stock which results in a ML DSi concentration of 6.05 µmol L−1and thus a consumption
of 10.9 µmol L−1 of the DSi concentration in the ML
between December 2011 and the end of January 2012 (52 days). Integrated over a 80 m ML, this value cor-responds to a net BSi production of 16 mmol m−2d−1. This production is consistent with the mean net BSi pro-duction of 10 mmol m−2d−1estimated for the same pe-riod by Closset et al. (2014) which decreases progres-sively to values lower than 1 mmol m−2d−1.
v. Winter: from March to September, theδ30Si of settling particles remained relatively heavy but decreased grad-ually toward lower values as winter deep convection progressively took place above the plateau (Blain et al., 2013).
4 Conclusions
The spatial distribution of δ30Si of seawater and particu-late matter in the ML was strongly impacted by the com-plex structure of water masses generated by the interac-tion between the PF and the bathymetry. In contrast, in deeper layers (> 500 m),δ30SiDSi was remarkably
homoge-neous (on average 1.28±0.08 and 1.05±0.06 ‰ for UCDW
and LCDW respectively) and deepδ30SiBSi exhibited
con-stant values in all out-plateau KEOPS-2 stations (on average 1.74±0.13 ‰), suggesting that dissolution of opal did not have any significant isotopic effect during this early season.
application as a non-productive reference station for the sil-icon biogeochemical cycle. The iron flux in the ML above the plateau strongly stimulated diatom production, increasing significantly itsδ30SiBSi(from 0.77±0.05 to 0.96±0.08 ‰
over 27 days during KEOPS-2) and simultaneously enrich-ing the ML in 30Si (up to 2.10±0.05 ‰). North of the PF,
stocks and Si isotopic composition of seawater and particles were respectively lower and heavier than above the plateau, in accordance with its PFZ characteristics as already reported by Cardinal et al. (2007, 2005), Varela et al. (2004), and Frip-iat et al. (2011b) in other sectors of the Southern Ocean. The situation was different in the meander since these stations re-ceived only moderate and sporadic iron supplies. There, non-optimal light-mixing regime and nutrient availability (includ-ing iron) delayed the bloom development and led the system to behave near steady state with low DSi utilization. Indeed, both Si isotopic signatures and mass balance did not evolve significantly in the meander ML.
Our Si isotopic data allow identification of the ini-tial conditions before diatom growth, Si sources, and the connections between different water masses through lo-cal circulation. The same Si source (WW plateau and not WW HNLC as initially thought) can be used for both the plateau and meander stations, suggesting that water masses and the ML bloom originated from the south-eastern part of the Kerguelen Plateau and spread northward. The Si properties of this source (32.9±2.2 µmol Si L−1 and
1.71±0.03 ‰) allow us to refine the seasonal net BSi pro-duction at 3.0±0.3 mol Si m−2yr−1 above the plateau
(in-stead of the 10.5±1.3 mol Si m−2yr−1estimated by Fripiat
et al., 2011a), which is more consistent with the published values for the AZ (2.4 to 3.3 mol Si m−2yr−1; e.g. Pondaven
et al., 2000; Nelson et al., 2002). This suggests that, even if the iron fertilization in some regions of the Southern Ocean stimulates the uptake of C and N and the production of or-ganic matter compared to non-fertilized area, it does not nec-essary enhance consumption of silicic acid and production of BSi. This observation can be explained by the decoupling between the biogeochemical cycles of Si, C, and N of diatom communities living under different biogeochemical condi-tions. These distinctive local communities may induce varia-tions of the efficiency of the silicon pump (Dugdale et al., 1995) that preferentially recycles organic matter over bio-genic silica in surface waters and thus leads to moderate net BSi production despite high primary production. Indeed, other recent studies in the Southern Ocean have highlighted the fact that diatom community composition could better ex-plain differences in silicification than physiological response to iron enrichment (see Baines et al., 2010; Assmy et al., 2013). Moreover, the isotope characteristics of the WW were similar through the whole season, meaning there was no net BSi production above the plateau. In contrast, in the meander the variation of the WW Si characteristics (concentration and isotopic composition) can be explained by successive mix-ings between the ML and WW or by lateral advection.
In the naturally iron-fertilized area of Kerguelen, we have shown that the dissolved and particulate Si pools were tem-porally decoupled. In this highly productive area, strong ac-tivity that promoted vertical and lateral nutrient exchanges, drove the evolution of δ30SiDSi to follow the steady-state
equations, while theδ30SiBSiseemed to follow more closely
the Rayleigh equations. Depending on the regime of BSi ex-port (e.g. BSi accumulation in the ML in early spring vs. the massive export event at the end of the productive season), the MLδ30SiBSican be described by the accumulation or
instan-taneous product, or could lie between these two ideal situa-tions. If confirmed in other productive regions of the South-ern Ocean, this observation could have great implications for paleoceanographic studies. Indeed, theδ30SiBSiof sediments
is currently used as a proxy for past reconstructions of sur-face Si utilization (e.g. De la Rocha et al., 1998; Ehlert et al., 2013). In these studies, the isotopic signature of sedimentary opal is used to calculate theδ30SiDSiand the extent of DSi
consumption in surface waters using either the Rayleigh or steady-state equations without taking into account the pos-sible decoupling betweenδ30SiDSiandδ30SiBSiand its
sea-sonal variability.
Finally, we have identified and quantified the processes that control the biogeochemical cycle of silicon in the ML over nearly 1 complete year. We show that theδ30Si of set-tling diatoms collected in sediment traps is a powerful proxy to quantify Si fluxes in the ML, such as silicic acid consump-tion in spring and summer or Si supply to the ML during mixing events.
5 Data availability
All original data from this paper are available in the Sup-plement section. Si isotope data are also available from the GEOTRACES International Data Assembly Centre http: //www.bodc.ac.uk/geotraces/. Moreover, all KEOPS-2 data are available from the French CYBER data centre: http: //keops2.obs-vlfr.fr/.
The Supplement related to this article is available online at doi:10.5194/bg-13-6049-2016-supplement.
Acknowledgements. The authors would like to thank B. Quéguiner
as the KEOPS-2 chief scientist, the captain, and the crew of the
R/VMarion-Dufresne IIfor assistance on board; Mustapha