BGD
6, 1091–1119, 2009Riverine silica flux to the ocean – a model
study
C. Y. Bernard et al.
Title Page
Abstract Introduction
Conclusions References
Tables Figures
◭ ◮
◭ ◮
Back Close
Full Screen / Esc
Printer-friendly Version
Interactive Discussion
Biogeosciences Discuss., 6, 1091–1119, 2009 www.biogeosciences-discuss.net/6/1091/2009/ © Author(s) 2009. This work is distributed under the Creative Commons Attribution 3.0 License.
Biogeosciences Discussions
Biogeosciences Discussionsis the access reviewed discussion forum ofBiogeosciences
Contribution of riverine nutrients to the
silicon biogeochemistry of the global
ocean – a model study
C. Y. Bernard1, H. H. D ¨urr2, C. Heinze1, J. Segschneider3, and E. Maier-Reimer3
1
Bjerknes Centre for Climate Research, Geophysical Institute, University of Bergen, All ´egaten 70, 5007 Bergen, Norway
2
Department of Physical Geography, Faculty of Geosciences, Utrecht University, The Netherlands
3
Max-Planck-Institute for Meteorology, 20146 Hamburg, Germany
Received: 3 November 2008 – Accepted: 5 December 2008 – Published: 21 January 2009 Correspondence to: C. Y. Bernard ([email protected])
BGD
6, 1091–1119, 2009Riverine silica flux to the ocean – a model
study
C. Y. Bernard et al.
Title Page
Abstract Introduction
Conclusions References
Tables Figures
◭ ◮
◭ ◮
Back Close
Full Screen / Esc
Printer-friendly Version
Interactive Discussion
Abstract
Continental shelf seas are known to support a large fraction of the global primary pro-duction. Yet, continental shelf areas are mostly ignored or neglected in global biogeo-chemical models. A number of processes that control the transfer of dissolved nutrients from river to the open ocean remain poorly understood. This applies in particular to 5
dissolved silica which drives the growth of diatoms that form a large part of the phyto-plankton biomass and are thus an important contributor to export production of carbon. Here, the representation of the biogeochemical state along continents is improved by coupling a high resolution database of riverine fluxes of nutrients to the global biogeo-chemical ocean general circulation model MPI-OM/HAMOCC5. Focusing on silicon 10
(Si), but including the whole suite of nutrients – carbon (C), nitrogen (N) and phos-phorus (P) in various forms – inputs are implemented in the model at coastal coupling points using the COSCAT global database of 156 mega-river-ensemble catchments from Meybeck et al. (2006). The catchments connect to the ocean through coastal segments according to three sets of criteria: natural limits, continental shelf topogra-15
phy, and geophysical dynamics.
According to the model the largest effects on nutrient concentrations occur in hot spots such as the Amazon plume, the Arctic – with high nutrient inputs in relation to its total volume, and areas that encounter the largest increase in human activity, e.g., Southern Asia.
20
1 Introduction
Continental shelf seas play a crucial role in biogeochemical fluxes from the continents to the open ocean; they are known to support a large part of the global primary pro-duction (Conley et al., 1993; Rabouille et al., 2001), only 8% of the ocean surface but 25% of the ocean primary production (Ver et al., 1999). They are also highly sensitive 25
BGD
6, 1091–1119, 2009Riverine silica flux to the ocean – a model
study
C. Y. Bernard et al.
Title Page
Abstract Introduction
Conclusions References
Tables Figures
◭ ◮
◭ ◮
Back Close
Full Screen / Esc
Printer-friendly Version
Interactive Discussion
complex dynamics including interplay of riverine supply of nutrients with coastal pro-cesses such as tidal currents or upwelling. Our perception of the functioning of the biogeochemical cycles in the global ocean requires a better understanding of the pro-cesses taking place on the continental margins. Global biogeochemical models partly fail to integrate processes taking place on the continental margins; they reproduce only 5
crudely the nutrient enrichment supported by coastal upwelling.
The riverine contribution is in the best case represented by a couple of main rivers, in most cases riverine inputs are ignored, neglected or distributed along the conti-nental limits as one uniform mean global value. However, riverine inputs to coastal zones show a high diversity and range over several orders of magnitude (Meybeck et 10
al., 2006). Often, relatively small proportions of the continental area draining to the oceans (i.e. exorheic parts) contribute major parts of material fluxes. As shown by D ¨urr et al. (2008, this volume) for the example case of dissolved silica (DSi), yields ex-ceeding 6.6 t km−2y−1, i.e.>2
×the global average, correspond to 17.4% of the global continental ice-free exorheic area but contribute 56.0% of DSi fluxes from the conti-15
nents to the coastal zones. Pacific catchments hold most of the hyper-active areas (>5× global average), probably due to a close connection between tectonic activity and DSi fluxes resulting from silicate weathering.
Taking into account this context, continental margins should be considered as a com-plex but essential interface between land and ocean, a contributor to global oceanic 20
biogeochemical cycles and not just as passive boundaries.
In the open ocean, biogeochemical cycles follow a relatively simple scheme: plank-ton takes up nutrients, dies and sinks to the deep ocean. The sinking organic matter is progressively remineralised and only a very small fraction reaches the sea floor and is buried in the sediments. The euphotic layer where plankton growth takes place is 25
up-BGD
6, 1091–1119, 2009Riverine silica flux to the ocean – a model
study
C. Y. Bernard et al.
Title Page
Abstract Introduction
Conclusions References
Tables Figures
◭ ◮
◭ ◮
Back Close
Full Screen / Esc
Printer-friendly Version
Interactive Discussion
welling that brings nutrient rich waters rapidly back to the surface. Furthermore, many coastal waters receive continuous fluxes of nutrients from the rivers. The riverine inputs are difficult to take into account in models because of the lack of data for thousands of smaller rivers, which, however in total contribute a significant amount of nutrients. and it is not reasonable to expect data for each river in the world. A comprehensive work of 5
data integration is necessary to build up a database covering the entire world, and not only limited to the major rivers. This new generation of database is now made avail-able: D ¨urr et al. (2008), Meybeck et al. (2006), the Global-NEWS project (Seitzinger et al., 2005).
Detailed regional models succeed in describing the progressive transfer of nutrients 10
from estuarine areas to the adjacent sea (Rabalais et al., 1996; Kroeze and Seitzinger, 1998), but only little effort, mostly through global box modelling (Ver et al., 1999), has been made to study the land/ocean coupling at the global scale (Da Cunha et al., 2007). Satellite derived estimates of the chlorophyll concentration give evidence of high primary production in coastal areas, while global models still fail to reproduce the 15
belts of high chlorophyll concentration along the continents. Regional studies have tried to show the link between the reduction/increase of primary production and changes in nutrient ratios as for example in the East China Sea after the Three Gorges Dam across the Yangtze River was built (Gong et al., 2006). An increasing number of regions of the world (e.g. Chesapeake Bay, northern Adriatic Sea, Gulf of Mexico) have seen 20
their jellyfish biomass increased, supported by an increasing riverine nutrient load due to human activity (crops fertilization and urban sewage) (Graham, 2001;Purcell et al., 1999).
As shown by Humborg et al. (2000), changes in N:Si and P:Si alter biogeochemistry and aquatic food webs in coastal marine environments since diatoms need silica to 25
build up their siliceous frustules, and, in many coastal ecosystems, diatoms are the dominant phytoplankton species and the basic element of the food web.
BGD
6, 1091–1119, 2009Riverine silica flux to the ocean – a model
study
C. Y. Bernard et al.
Title Page
Abstract Introduction
Conclusions References
Tables Figures
◭ ◮
◭ ◮
Back Close
Full Screen / Esc
Printer-friendly Version
Interactive Discussion
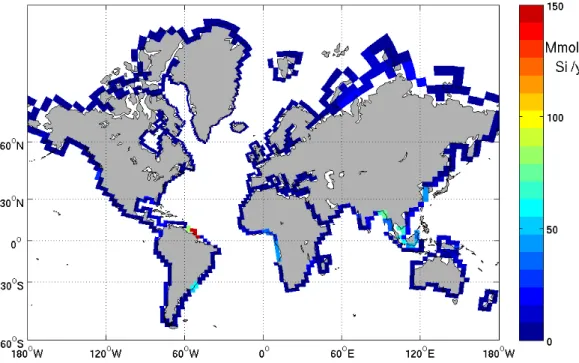
riverine inputs of dSi to the global biogeochemical cycles on the global scale by adding the riverine fluxes of nutrients to a global scale BGCM. The regionalized inputs allow showing the importance of dynamics in the export of the nutrients to the open ocean and how long these nutrients are available to support the plankton production before being exported out of the system. The riverine inputs of silica are necessary to balance 5
the burial of opal in the sediments (Treguer et al., 1995) the high resolution database (Fig. 1) of riverine fluxes illustrates the spatial heterogeneity of the riverine contribution to the marine silca cycle.
2 Model and data base
2.1 Model and forcing 10
This work is based on simulations with two numerical models, the ocean model MPI-OM (Marsland et al., 2003) and the biogeochemical model HAMOCC5 (Maier-Reimer, 1993; Maier-Reimer et al., 2005). The two models are coupled on-line and are running with the same vertical and horizontal resolution and the same time step.
The general circulation model MPI-OM grid is an orthogonal curvilinear C-grid with 15
an average resolution of 3◦. To optimize calculations, the North Pole is artificially lo-cated over Greenland and the South Pole over Antarctica. The resulting resolution is from 29 km in the Arctic to about 390 km in the Tropics. The water column is divided vertically into 40 vertical levels whose thickness gradually increases with depth, from 12 m in the surface layer to a maximum of 600 m in the deep ocean. The time step of 20
the calculations is 0.1 day.
The biogeochemical model HAMOCC5 is based on the work of Maier-Reimer (1993) Six and Maier-Reimer (1996). The version used here is essentially identical with the one used by Wetzel et al. (2005) and Wetzel’s PhD thesis (2004). We will only dis-cuss the features relevant for the study presented here, a complete description of 25
BGD
6, 1091–1119, 2009Riverine silica flux to the ocean – a model
study
C. Y. Bernard et al.
Title Page
Abstract Introduction
Conclusions References
Tables Figures
◭ ◮
◭ ◮
Back Close
Full Screen / Esc
Printer-friendly Version
Interactive Discussion
Technical description of the HAMburg Ocean Carbon Cycle model (Maier-Reimer et al., 2005).
HAMOCC5 is a NPZD (Nutrient Plankton Zooplankton Detritus) model with one phy-toplankton and one zooplankton box, photosynthesis is co-limited by N, P and Fe (Au-mont et al., 2003), and is driven by the same radiation values as the MPI-OM. Tem-5
perature and salinity from MPI-OM are used to calculate chemical transformation rates and constants. HAMOCC5 simulates processes of denitrification and N-fixation, forma-tion of calcium carbonate due to coccolithophorides as well as foraminifera and opaline shells from diatom growth, sinking of detritus and marine snow, uptake and release of dissolved iron by biogenic particles, as well as atmospheric dust deposition and 10
sinking (Maier-Reimer et al., 2005). It is assumed here that there is no aeolian input of dissolved silica (only iron and clay). The atmospheric compartments allowed the computation of gases such as CO2, O2and N2 and their fluxes at the air-sea surface
interface. In this version atmospheric carbon concentration is set to its preindustrial concentration.
15
Phytoplankton growth depends on the availability of light and nutrients. The local light supply is calculated from the temporally and spatially varying solar radiation at the sea surface. Beneath the surface, light intensity decreases with depth due to attenuation by sea water and chlorophyll.
Nitrate (NO3) in the surface layer is computed simply following the phosphate dy-20
namics, multiplied by a constant stoichiometric ratio,RN:P. There is no variation of the internal N:P ratio of particulate or dissolved constituents from surface layer processes. The phytoplankton growth is assimilated to an amount of organic phosphorous (P) and is driven by the light availability and the limiting nutrient, Eqs. (1) and (2), which is defined as the least available nutrient (phosphate, nitrate, or iron). Assuming that 25
BGD
6, 1091–1119, 2009Riverine silica flux to the ocean – a model
study
C. Y. Bernard et al.
Title Page
Abstract Introduction
Conclusions References
Tables Figures
◭ ◮
◭ ◮
Back Close
Full Screen / Esc
Printer-friendly Version
Interactive Discussion
each nutrient multiplied by a stoichiometric coefficient: 1/RN:Pand 1/RFe:P, Eq. (2).
Photosynthesis=Phy∗L(z, t)∗ X
KPO4
Phy +X
(1)
With
L(z;t) : light availabilityX =min
[PO4],
[NO3]
RN:P ,
[Fe]
RFe:P
(2)
The predation of zooplankton on the phytoplankton transfers a part of the organic mat-5
ter produced by the photosynthesis into the zooplankton biomass. During the ingestion of this organic matter, a fraction is immediately release in water (as faecal pellets) and forms the detritus fraction (det). The remaining fraction supports zooplankton growth. The metabolism of zooplankton and phytoplankton produces waste that is excreted in the form of dissolved organic matter (DOM). The zooplankton and phytoplankton mor-10
tality returns organic matter to the water column and forms the detritus fraction that will sink to the deep ocean. To summarise, the detritus originates from dead phytoplankton, dead zooplankton and faecal pellets from the zooplankton predation on phytoplankton. At this step the model calculates the opal and the calcium carbonate production as the two fractions of the non living part of the detritus, the shells.
15
It is assumed that phytoplankton consists of diatoms, coccolithophorids, and flagel-lates. As diatoms are known to be the fastest competitors (Egge and Aksnes, 1992), opal production by diatoms is computed first in the time loop if silica is available.
The siliceous fraction of the detritus is computed as:
∆sil=min ∆det ∆t RSi:P
[SI (OH)4]
K
SI(OH)4
Phy +[SI (OH)4],0.5 [SI (OH)4]
!
(3) 20
Where:
BGD
6, 1091–1119, 2009Riverine silica flux to the ocean – a model
study
C. Y. Bernard et al.
Title Page
Abstract Introduction
Conclusions References
Tables Figures
◭ ◮
◭ ◮
Back Close
Full Screen / Esc
Printer-friendly Version
Interactive Discussion
The calcium carbonate fraction is computed after as shown in Eq. (4).
∆car=RCa:P∆det
∆t
KSI(OH)4
PHY
KSI(OH)4
PHY +SI (OH)4
(4)
Opal production (∆sil) consumes silica (Si(OH)4). Dissolution of opal is temperature (T) dependant with a constant ratio,λopal;Si(OH)
4.
∆opal
∆t = ∆sil−λopal:Si(OH)4∗0.1∗(T +3)∗Opal (5) 5
∆SI(OH)4
∆t =−∆sil+λopal:Si(OH)4∗0,1∗(T +3)∗Opal (6) The flux of particles through the water column redistributes phosphorous, silica and associated tracers along the sinking part enriching the deep waters in nutrients. In the default version of the code, particles have constant sinking speeds,wDET,wCaCO,
wOpal and wDust for organic detritus, CaCO3, opal and clay respectively. The export 10
production is computed as the material leaving the euphotic layer, i.e. 90 m depth of the surface ocean, separately for opal and CaCO3. Remineralisation of opal and CaCO3
occurs all along the sinking of particles after they left the euphotic layer. Fluxes from the bottom layer in each grid cell provide the boundary condition for the sediment module that includes 4 sediment weight fractions and 12 layers following Heinze et al. (1999). 15
The sediment module computes the accumulation of the deposited material on the sea floor as well as processes of remineralization in the sediments and the release of redissolved tracers to the lowest level of the water column.
The model is forced with NCEP based climatology (National Centers for Environmen-tal Prediction). Dust deposition was generated by the National Center for Atmospheric 20
BGD
6, 1091–1119, 2009Riverine silica flux to the ocean – a model
study
C. Y. Bernard et al.
Title Page
Abstract Introduction
Conclusions References
Tables Figures
◭ ◮
◭ ◮
Back Close
Full Screen / Esc
Printer-friendly Version
Interactive Discussion
2.2 Initial conditions and model spin-up
The model was run for a 2400 years spin-up from a homogeneous distribution of the 18 tracers in the water column after 600 years of spin-up of the global circulation model. After 2400 years the simulated distribution of tracers is consistent with observed sur-face map concentrations and cross sections of the Pacific, Atlantic and Indian Oceans. 5
The coupling of the riverine fluxes of nutrients to the HAMOCC5 model is then inte-grated on a 100 years time period (900 CPU h per run). The MPI mode of the model currently runs on a distributed shared-memory system of IBM p575+nodes intercon-nected with a high-bandwidth low-latency switch network (HPS). Each simulated year takes 35 min running on 16 processors for a total of 9 CPU h per simulated year. 10
2.3 River nutrient databases
Here we take into account the current state-of-the-art datasets for riverine nutrient ex-ports in different forms (Table 1), as established for the reference year 1995 (for C, N, P except DIC) by the Global-NEWS project (Seitzinger et al., 2005); we used the merged and slightly adapted dataset as made available to us by the group in January 2008), 15
and for pre-industrial conditions for silica as established by D ¨urr et al. (2008, this vol-ume). For DIC, we used the alkalinity flux data as calculated by Suchet (2003). Global-NEWS established the datasets at a 0.5 degree resolution for the∼6200 river basins available from the STN-30 dataset of V ¨or ¨osmarty et al. (2000a, b). They have been aggregated here to the resolution of ∼140 mega-river-catchments (COSCATs) corre-20
sponding to homogeneous coastal segments with fixed segment boundaries as estab-lished by Meybeck et al. (2006). These segments have a median length of∼2000 km and were specifically designed for standardized spatial analysis and reporting of ma-terial fluxes – water, dissolved and particulate mama-terial such as nutrients and carbon species – from the exorheic (i.e. draining to the oceans, as opposed to the endorheic 25
BGD
6, 1091–1119, 2009Riverine silica flux to the ocean – a model
study
C. Y. Bernard et al.
Title Page
Abstract Introduction
Conclusions References
Tables Figures
◭ ◮
◭ ◮
Back Close
Full Screen / Esc
Printer-friendly Version
Interactive Discussion
is directly available at the COSCAT resolution. The DIC data has also been directly calculated summing up the 1 degree original data set to the COSCAT resolution. Injec-tion points are calculated as the central coastal point for each COSCAT, and adapted to the ocean model resolution (see Fig. 1).
2.4 Coupling 5
The coastal segments (COSCATs) are defined as the coastline between two geograph-ical locations. The riverine fluxes of nutrients are released in the near-shore model grid cells located in between both ends of a given segment. Due to the low resolution of the model grid, some of the 156 original segments were merged, resulting in 129 seg-ments used here. Coupling of the database, fluxes of nutrients are computed at each 10
time step; 10 times a day (Si, N, P and C). The flux is released homogeneously all along the coast line in the corresponding grid cells in the upper layer (first 12 m). The fluxes are assumed to be constant over time; the river discharge does not yet take into account the seasonal cycle or interannual variability. However, such information progressively becomes available and will be incorporated in later versions of the model. 15
The model code relies on the Redfield Ratio, i.e. nutrient uptake occurs according to a 122:16:1 C:N:P ratio. The same applies to the remineralisation process.
The data of riverine nutrient fluxes included dissolved organic nitrogen, phosphorous and carbon (DON, DOP and DOC). The dissolved organic matter (DOM) was regarded as the least available organic element (either phosphate or carbon):
20
DOM=min
DOP,DON
16 , DOC
122
(7)
The dissolved organic element in excess with regard to the Redfield ratio was added under its inorganic form, for example in the case P is the least available nutrient (either phosphate or nitrate, see Eqs. 7 and 8).
FDIN=DIN+(DON−16∗DOP) (8)
BGD
6, 1091–1119, 2009Riverine silica flux to the ocean – a model
study
C. Y. Bernard et al.
Title Page
Abstract Introduction
Conclusions References
Tables Figures
◭ ◮
◭ ◮
Back Close
Full Screen / Esc
Printer-friendly Version
Interactive Discussion
While,
FDIC=DIC+(DOC−122∗DOP) (9)
The same approach was applied to particulate matter.
3 Global results, silicic acid concentration
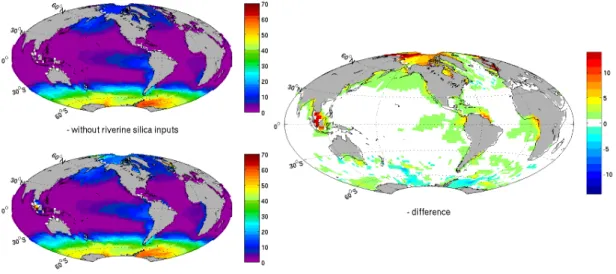
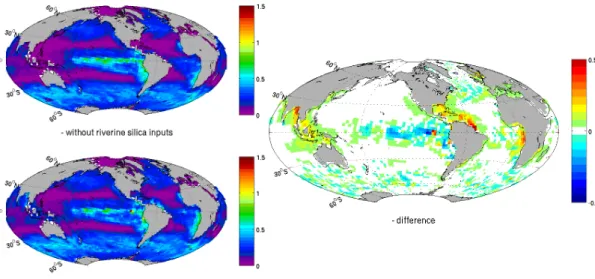
Mapping the silicic acid concentration of the ocean surface shows four major hotspots 5
when comparing the run with riverine silicon loads to the run without: the Arctic Ocean, the eastern Gulf of Guinea (coast of Cameroon, Gabon, Congo and Angola), the Amazon plume and South Eastern Asia (Fig. 2). The total flux is 6.2 teramoles of silicon per year (or 371 Mt SiO2 per year) is in agreement with earlier estimates of
6.1±2.0 teramoles of silicon per year (Treguer et al., 1995). 10
In the Arctic Ocean, the largest effect of the riverine silica occurs along the Siberian coast where rivers that drain the Siberian plateau annually release 0.25 teramoles Si (15 Mt SiO2), this results in a 15µmol l−
1
increase of the dissolved silica concentra-tion (Fig. 2). In the Eastern Gulf of Guinea, the largest river in Western Central Africa, the Congo River (21 Mt SiO2yr−
1
or 3.5 teramoles Si yr−1) contributes to a 5 15
to 10µmol l−1 increase of the silicic acid concentration all along the 1000 km coast-line from its mouth to the coast of Cameroon, extending the silica supply from the Benguela upwelling system. Across the Atlantic Ocean, at the same latitude, the Ama-zon releases 0.94 teramoles Si per year, more than 15% of the global land-ocean flux of silica, 1.1 teramoles Si per year with the Orinoco River (0.16 teramoles Si per year). 20
BGD
6, 1091–1119, 2009Riverine silica flux to the ocean – a model
study
C. Y. Bernard et al.
Title Page
Abstract Introduction
Conclusions References
Tables Figures
◭ ◮
◭ ◮
Back Close
Full Screen / Esc
Printer-friendly Version
Interactive Discussion
photosynthesis, opal and calcium carbonate production together with the carbon ex-port at a few hundreds kilometres from the Amazon mouth. Despite the distance from the coast, the comparison of the 2 runs with/without rivers clearly shows the shift in calcium carbonate production. The riverine silica input maintains the dissolved silica concentration higher than 8µmol/l, which sustains the opal production, as shown in 5
Figs. 2 and 4. If the riverine input of silica is switched off, the dissolved silica concen-tration drops below 1µmol l−1, promoting the calcium carbonate production by limiting diatom growth.
The calcium carbonate production benefits from the low dissolved silica concentra-tion through the silica limitaconcentra-tion of opal producconcentra-tion. Here only the Amazon plume is 10
represented as the other hot spots show the same scheme.
The major hotspot of dissolved silica release to the ocean is located in South Eastern Asia (Fig. 2). The Ganges River and its neighbouring smaller rivers support an annual input of 0.4 teramoles Si (or 23.32 Mt SiO2) to the Bay of Bengal. Not as strong, but on a larger spatial scale, the Indonesian archipelago’s coastline receives in total the equiv-15
alent of the Amazon’s load; with the Mekong River (21 Mt SiO2 or 0.35 teramoles Si
per year), Indonesia and Malaysia (21.4 Mt SiO2 or 0.36 teramoles Si per year). The dissolved silica concentration raises about 20µmol l−1Si in the Java Sea, between
In-donesia, Sumatra and Java, these numbers should be considered with caution as this sea basin doesn’t account for more than a few cells. Therefore a weak advection of 20
tracer could artificially increase the accumulation process locally.
The open ocean benefits as well from the riverine input of silica. The Fig. 2 shows an increased silicic acid concentration of a fewµmol l−1on large surface of the Equatorial East Pacific Ocean and in the North Pacific Ocean. The Congo raises the eastern South Atlantic surface silicic acid concentration by 2µmol l−1, which is significant for 25
such a low Si concentration area.
BGD
6, 1091–1119, 2009Riverine silica flux to the ocean – a model
study
C. Y. Bernard et al.
Title Page
Abstract Introduction
Conclusions References
Tables Figures
◭ ◮
◭ ◮
Back Close
Full Screen / Esc
Printer-friendly Version
Interactive Discussion
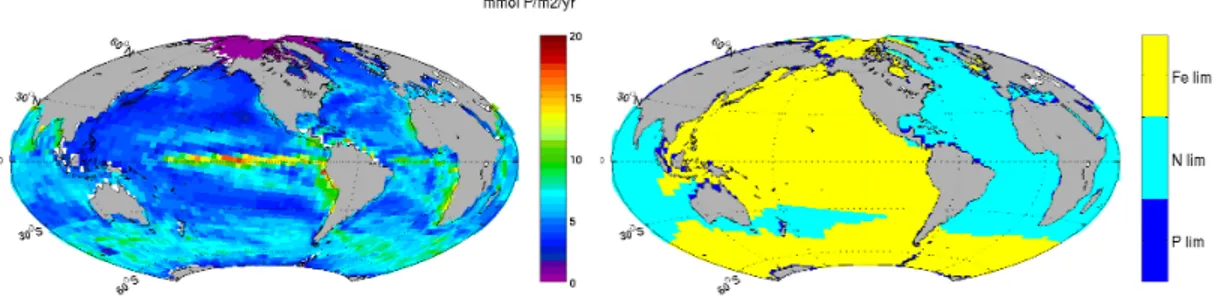
utilization decreases the concentration; where these two processes are not in balance there is either accumulation either depletion of the dissolved silica. As shown on Fig. 3, there is no photosynthesis in the Arctic Ocean because of sea ice. The photosynthe-sis is not responding to changes of the riverine inputs of silica for the simple reason that if diatom growth is limited by silica availability it is replaced by calcium carbonate 5
production which leaves the annual primary production unchanged. In the code, the photosynthesis only depends on light availability, phytoplankton and the limiting nutrient (phosphate, nitrate or iron). It is therefore interesting to note that hotspots of riverine silica inputs (Fig. 2) are mainly located in highly productive areas (Fig. 3) for two diff er-ent reasons; the nutrier-ent availability supplied by the river itself (Amazon plume, Fig. 4) 10
and in some cases the vicinity of coastal upwelling (Southwest coast of Africa). In this case the riverine silica mixes with the silica enriched waters of the upwelling, and both contributions work in synergy to maintain a high level of silica concentration. The sit-uation is slightly different in the Indonesian archipelago; despite a large riverine input of N and P, the iron limitation driving the photosynthesis of most of the Pacific Ocean 15
(Behrenfeld et al., 1996) maintains photosynthesis below a few moles of P m2yr−1. The opal export production is the flux of opal that exits the euphotic layer (set to 90 m depth in the code). Two main areas of the global oceans show a significant increase of the vertical export of silica via opal export; the Amazon plume including the Caribbean Sea and the Gulf of Mexico and South-eastern Asia. The strongest 20
increase of opal export production is the Amazon and Orinoco Rivers; these two rivers alone contribute to maintain an annual opal export of up to a 0.8 mol Si m−2 along the north coast of South America (Fig. 5). This large input of silica (1.1 teramoles Si per year) enhances Diatoms growth and opal export as far as the Caribbean Sea, and mixes its signal with the input of the Mississippi River in the Gulf of Mexico. The 25
BGD
6, 1091–1119, 2009Riverine silica flux to the ocean – a model
study
C. Y. Bernard et al.
Title Page
Abstract Introduction
Conclusions References
Tables Figures
◭ ◮
◭ ◮
Back Close
Full Screen / Esc
Printer-friendly Version
Interactive Discussion
opal export production locally increases by 0.5 mol Si m−2.
4 Discussion
Rivers are the most significant input of silicic acid for the global ocean (Treguer et al., 1995), thus also in our model and are assumed to balance the burial/redissolution of opal in the sediment. Atmospheric silica inputs such as dust deposition and dissolved 5
silicic acid in rain are here considered negligible. We assume here that deposited aeolian silica would be deposited as sand particle whose sinking speed wouldn’t allow any dissolution resulting in a significant input of silicic acid (Johnson et al., 2006). Riverine supply contributes to enrich the euphotic layer in addition to the upwelling systems. In a steady state ocean, rivers balance the burial of Silica into the sediments 10
(Treguer et al., 1995).
Riverine input of silicic acid occurs at the same time as the other limiting nutrients supporting a vigorous primary production (Figs. 2 and 3), except on the Pacific side of the South Eastern Asia witch is limited by iron. The conditions are then favourable to a local use of the available silicic acid that explains the relative low export of the 15
silica from the marginal seas. For that reason a large part of the opal is buried on the continental margins (Treguer et al., 1995). The situation is different for the Arctic region that receives a large flux of silicic acid in relation to the shallowness of the basin and its volume (D ¨urr et al., 2008) and where sea ice doesn’t allow the plankton growth as shown on Fig. 3. This combined factors lead to the accumulation of silicic acid in the 20
Arctic basin.
The maps of the surface silicic acid (Fig. 2) and opal export production (Fig. 5) point out the strong spatial heterogeneity of the riverine silica contribution to the oceanic biogeochemical cycle of silica. This is not surprising given the enormous heterogeneity in the spatial distribution of riverine silica inputs, indeed, 56% of Silica flux to the coastal 25
BGD
6, 1091–1119, 2009Riverine silica flux to the ocean – a model
study
C. Y. Bernard et al.
Title Page
Abstract Introduction
Conclusions References
Tables Figures
◭ ◮
◭ ◮
Back Close
Full Screen / Esc
Printer-friendly Version
Interactive Discussion
Riverine inputs of silica do have a stronger effect on the ocean distribution of silica as they often occur in areas that encounter no major input from upwelling (Amazon, South-eastern Asia, Arctic rivers as shown on Fig. 2). The silica delivery in these areas is dominated by riverine flux. Remobilisation of opal shelf sediments would not compensate for a large decrease of the riverine silica input. It is also interesting to point 5
at the general climate impact on the regionalization of total input of silica to the euphotic layer. Both riverine and upwelling supply depend on climate. The precipitation on the continents drives the weathering of rocks and the transport of silica to the ocean while winds drive the upwelling processes along the shore. Any changes in the atmospheric circulation could thus spatially redistribute the riverine silica inputs to the sea surface 10
of the ocean.
The effect on the surface silica concentration depends on the location of the river mouth; in fact the effect of the silica inputs from the Amazon appears to be small as compared to the Siberian Rivers. The Siberian COSCATs combined contribute to raise the surface silica concentration by 15µmol l−1 with an annual input of 0.26 teramoles 15
of Si. Despite the 1.1 teramoles Si per year released by the Amazon River and Orinoco River, the surface silica concentration just raises by 6–8µmol l−1. First, one must take
into consideration the size of the oceanic regional domain. Accordingly, the Arctic Ocean is the region of the global Ocean that encounters the highest silica input in re-lation to its size. Second, the depth of the oceanic regional domain determines the 20
efficiency of the removal of silicic acid by the silica pump described by Dugdale (1995). The Si export to the deep ocean has been shown to be more efficient than for N and P (Bidle and Azam, 1999), recycling of opal remains slower than for N and P. The narrowness of the continental shelf determines the efficiency of the opal export. The shallowness of the continental shelf shorter the sinking time of opal, most of which 25
BGD
6, 1091–1119, 2009Riverine silica flux to the ocean – a model
study
C. Y. Bernard et al.
Title Page
Abstract Introduction
Conclusions References
Tables Figures
◭ ◮
◭ ◮
Back Close
Full Screen / Esc
Printer-friendly Version
Interactive Discussion
the redissolved silica will sooner or later be reexported to the euphotic layer (by advec-tion or diffusion). This process is illustrated by the case of the Amazon contribution, whose large scale plume is correctly captured by the model if compared to the study of Nikiema (2007). As shown in Figs. 2 and 5, the north-westward Amazon plume input is so powerful that it exports its load up to a few hundreds of kilometres from the coast, 5
supporting opal production far outside the continental shelf. The silica taken up by di-atoms to build up their silicic shells is directly exported to the deep ocean after didi-atoms die. In the case of the Arctic Ocean, the sea ice prevents plankton growth and silica uptake, which causes an accumulation.
Riverine silica input shows high sensitivity to land use and human activity in general 10
(Conley et al., 1993; Humborg et al., 2000). River damming and artificial reservoirs trap part of the riverine silica and as DSi only originates from natural weathering of rocks (Meybeck, 1998), measurement have shown a decrease of the riverine DSi during the last decades (Justic et al., 1995b). In parallel, human activity had the opposite effect on N and P (agriculture, industry or urban sewage increased N and P emission. 15
The combined results is a general decrease of the riverine SI:N and Si:P ratio (Justic et al., 1995a, b). In addition, the increased input of N and P stimulates the primary production fuelling the silica pump. Sediment beneath the Mississippi River plume showed an increased accumulation of biogenic silica over the last decades (Rabalais et al., 1996). It is therefore interesting to note that South Eastern Asia, which receives one 20
of the most significant inputs of riverine silica, is the region of the world that encounters the strongest population growth, urbanization and development. It is therefore logical to expect a large change in the land/ocean nutrient flux. The expected shifts in the plankton population with an increase in the occurrence of and intensity of toxic algal blooms are the major problem the local fisheries will have to deal with in the future. 25
photosynthe-BGD
6, 1091–1119, 2009Riverine silica flux to the ocean – a model
study
C. Y. Bernard et al.
Title Page
Abstract Introduction
Conclusions References
Tables Figures
◭ ◮
◭ ◮
Back Close
Full Screen / Esc
Printer-friendly Version
Interactive Discussion
sis, the iron/nitrogen limitation boundary shifts after coupling of the complete set of river inputs. The model generates an iron limitation in the coastal zone due to the high use and export of the original iron caused by the high supply of nutrients. The model fails to reproduce the iron recycling from the shelf’s sediments. The primary source of iron in the continental shelf seas is resuspension of particles and redissolution of deposited 5
iron in the benthic boundary layer, followed by upwelling of this iron-rich water, rather than direct riverine input (Johnson et al., 1999). The generated artificial iron limitation masks part of the potential of the continental margins primary production potential. It probably artificially decreases the opal production of the marginal seas. In the model, iron is supplied by aeolian dust deposition.
10
The complex pattern of iron during its transfer to the ocean does not allow a direct flux from the rivers (Wells and Mayer, 1991; Poulton and Raiswell, 2002). Iron aggre-gates and sediments in the estuary when freshwater and sea waters mixes (Poulton and Raiswell, 2002). A large part remains trapped in the estuary. The input of iron is assumed to be mainly supported by dust deposition and remineralisation in the sedi-15
ment pore waters of the coastal sediments before advection to the surface (Johnson et al., 1999). The active recycling of iron on the continental margins prevents iron limitation on the continental margins but in coastal upwelling regimes (Hutchins and Bruland, 1998). To use riverine iron concentration from the literature would rather gen-erate an iron fertilization experiment than give a better picture of the marginal seas 20
productivity. A realistic approach would consist in getting a better simulation of the iron return from the coastal sediments to the surface on continental margins as suggested by Wells and Trick (2004). This might be the reason why the model fails to reproduce the high production belt along the continents even when riverine nutrient input is taken into account.
25
BGD
6, 1091–1119, 2009Riverine silica flux to the ocean – a model
study
C. Y. Bernard et al.
Title Page
Abstract Introduction
Conclusions References
Tables Figures
◭ ◮
◭ ◮
Back Close
Full Screen / Esc
Printer-friendly Version
Interactive Discussion
coastal segment of the COSCATs database, with a specific parameterisation for each segment.
The coupling of the model to the database of riverine nutrients will allow running scenarios with changes in the fluxes; it will be based on scenarios built by Global-NEWS models currently under development according to the Millennium Scenarios. 5
Ongoing projects of damming majors rivers such as the Three-Gorges Dam already shown changing nutrient concentrations and ratios in the coastal zone and the East China Sea (filling phase started in June 2003). Investigations carried out by Gong et al. (2006) have shown that the Si:N ratio in the river-affected region changed from 1.5 in 1998 to 0.4 in 2004. All over the world, all nutrients are expected to be impacted, 10
Kroeze’s model predicted that between 1990 and 2050 the dissolved inorganic nitrogen (DIN) export by rivers more than doubles to 47.2 Tg N in 2050 (Kroeze and Seitzinger, 1998). Whatsoever riverine N and P stabilized or not, all observations show a general decrease of the Si:N and Si:P ratio. The decreasing riverine DSi concentration is prob-ably due to enhanced reservoir retention effect similar to the Iron Gate (McGinnis et al., 15
2006). In addition Rabalais suggested that a larger amount of silica would be buried in the continental shelf due to an increased coastal primary production supported by the increased rinverine N and P input. The silica in sediments beneath the Mississippi River plume increased during the past two decades (Rabalais et al., 1996) despite a decrease of the Mississippi supply in silica.
20
The recent development of the river biogeochemical states is different depending on the regional level of economical development. In a few developed countries, due to a political will of reduction of eutrophication (wastewater treatment, denitrified and diphosphorilated) and sustainable land use changes, the riverine load of N and P sta-bilised. In some rare cases the load of N and P tends to decrease. For example, in 25
improve-BGD
6, 1091–1119, 2009Riverine silica flux to the ocean – a model
study
C. Y. Bernard et al.
Title Page
Abstract Introduction
Conclusions References
Tables Figures
◭ ◮
◭ ◮
Back Close
Full Screen / Esc
Printer-friendly Version
Interactive Discussion
ment is little compare to the global increase of river load in the rest of the world and its resulting decrease of the Si:N and Si:P ratio.
5 Conclusions
Regionalisation of silica inputs highlights the heterogeneity of land waters contribution to the marine cycle of silicon. The fate of the riverine silica input is largely depending 5
on the input location and local level of productivity. The hot spots are mainly located in areas where there is little support of the marine ecosystem through upwelling; it makes these areas dependant on the riverine fluxes and sensitive to the human activity that affect the riverine transport of nutrients. The uniform distribution of riverine silica at the surface of the ocean commonly used in global models to balance opal burial in the 10
sediments can no longer be used if one plans to properly describe the biogeochemical cycle of silica, especially for models taking into consideration the competition between calcifiers and diatoms. We take here the first steps to a full integration of nutrient cy-cling, including the continental shelf seas and land/ocean coupling, in an Earth System modelling context.
15
Acknowledgements. The work on this project was made possible by financial support from the Bjerknes Centre for Climate Research – University of Bergen, the EU (Si-WEBS, contract number HPRN-CT-2002-000218) and Utrecht University (High Potential project G-NUX). Sybil Seitzinger and Emilio Mayorga (Institute of Marine & Coastal Sciences, Rutgers University, USA) are acknowledged for the communication of the merged Global-NEWS data sets. Dis-20
BGD
6, 1091–1119, 2009Riverine silica flux to the ocean – a model
study
C. Y. Bernard et al.
Title Page
Abstract Introduction
Conclusions References
Tables Figures
◭ ◮
◭ ◮
Back Close
Full Screen / Esc
Printer-friendly Version
Interactive Discussion
References
Amiotte-Suchet, P. A., Probst, J. L., and Ludwig, W.: Worldwide distribution of continen-tal rock lithology: Implications for the atmospheric/soil CO2 uptake by continental weath-ering and alkalinity river transport to the oceans, Global Biogeochem. Cy., 17, 1038, doi:10.1029/2002GB001189, 2003.
5
Aumont, O., Maier-Reimer, E., Blain, S., and Monfray, P.: An ecosystem model of the global ocean including Fe, Si, P colimitations, Global Biogeochem. Cy., 17, 1060, doi:10.1029/2001GB001745, 2003.
Behrenfeld, M. J., Bale, A. J., Kolber, Z. S., Aiken, J., and Falkowski, P. G.: Confirmation of iron limitation of phytoplankton photosynthesis in the equatorial Pacific Ocean, Nature, 383, 10
508–511, 1996.
Beusen, A. H. W., Dekkers, A. L. M., Bouwman, A. F., Ludwig, W., and Harrison, J.: Estima-tion of global river transport of sediments and associated particulate C, N, and P, Global Biogeochem. Cy., 19, 2005.
Bidle, K. D. and Azam, F.: Accelerated dissolution of diatom silica by marine bacterial assem-15
blages, Nature, 397, 508–512, 1999.
Conley, D. J., Schelske, C. L., and Stoermer, E. F.: Modification of the Biogeochemical Cycle of Silica with Eutrophication, Mar. Ecol.-Prog. Ser., 101, 179–192, 1993.
Da Cunha, L. C., Buitenhuis, E. T., Le Quere, C., Giraud, X., and Ludwig, W.: Potential impact of changes in river nutrient supply on global ocean biogeochemistry, Global Biogeochem. 20
Cy., 21, 2007.
Dugdale, R. C., Wilkerson, F. P., and Minas, H. J.: The Role of a Silicate Pump in Driving New Production, Deep-Sea Research Pt. I-, 42, 697–719, 1995.
Dumont, E., Harrison, J. A., Kroeze, C., Bakker, E. J., and Seitzinger, S. P.: Global dis-tribution and sources of dissolved inorganic nitrogen export to the coastal zone: Re-25
sults from a spatially explicit, global model, Global Biogeochem. Cy., 19, GB4S02, doi:10.1029/2005GB002488 , 2005.
D ¨urr, H. H., Meybeck, M., Hartmann, J., Laruelle, G. G., and Roubeix, V.: Global spatial dis-tribution of natural river silica inputs to the coastal zone, Biogeosciences Discuss., 6, 1–57, 2009,
30
http://www.biogeosciences-discuss.net/6/1/2009/.
BGD
6, 1091–1119, 2009Riverine silica flux to the ocean – a model
study
C. Y. Bernard et al.
Title Page
Abstract Introduction
Conclusions References
Tables Figures
◭ ◮
◭ ◮
Back Close
Full Screen / Esc
Printer-friendly Version
Interactive Discussion
Mar. Ecol.-Prog. Ser., 83, 281–289, 1992.
Eriksson, H., Pastuszak, M., Lofgren, S., Morth, C. M., and Humborg, C.: Nitrogen budgets of the Polish agriculture 1960–2000: implications for riverine nitrogen loads to the Baltic Sea from transitional countries, Biogeochemistry, 85, 153–168, 2007.
Gong, G. C., Chang, J., Chiang, K. P., Hsiung, T. M., Hung, C. C., Duan, S. W., and 5
Codispoti, L. A.: Reduction of primary production and changing of nutrient ratio in the East China Sea: Effect of the Three Gorges Dam?, Geophys. Res. Lett., 33, L07610, doi:10.1029/2006GL025800, 2006.
Graham, W. M.: Numerical increases and distributional shifts of Chrysaora quinquecirrha (Desor) and Aurelia aurita (Linne) (Cnidaria : Scyphozoa) in the northern Gulf of Mexico, 10
Hydrobiologia, 451, 97–111, 2001.
Harrison, J. A., Caraco, N., and Seitzinger, S. P.: Global patterns and sources of dissolved organic matter export to the coastal zone: Results from a spatially explicit, global model, Global Biogeochem. Cy., 19, GB4S04, doi:10.1029/2005GB002480, 2005a.
Harrison, J. A., Seitzinger, S. P., Bouwman, A. F., Caraco, N. F., Beusen, A. H. W., 15
and Vorosmarty, C. J.: Dissolved inorganic phosphorus export to the coastal zone: Results from a spatially explicit, global model, Global Biogeochem. Cy., 19, GB4S03, doi:10.1029/2004GB002357, 2005b.
Heinze, C., Maier-Reimer, E., Winguth, A. M. E., and Archer, D.: A global oceanic sediment model for long-term climate studies, Global Biogeochem. Cy., 13, 221–250, 1999.
20
Humborg, C., Conley, D. J., Rahm, L., Wulff, F., Cociasu, A., and Ittekkot, V.: Silicon retention in river basins: Far-reaching effects on biogeochemistry and aquatic food webs in coastal marine environments, Ambio, 29, 45–50, 2000.
Hutchins, D. A. and Bruland, K. W.: Iron-limited diatom growth and Si : N uptake ratios in a coastal upwelling regime, Nature, 393, 561–564, 1998.
25
Johnson, H. P., Hautala, S. L., Bjorklund, T. A., and Zarnetske, M. R.: Quantifying the North Pacific silica plume, Geochem. Geophy. Geosy., 7, Q05011, doi:10.1029/2005GC001065, 2006.
Johnson, K. S., Chavez, F. P., and Friederich, G. E.: Continental-shelf sediment as a primary source of iron for coastal phytoplankton, Nature, 398, 697–700, 1999.
30
Justic, D., Rabalais, N. N., and Turner, R. E.: Stoichiometric nutrient balance and origin of coastal eutrophication, Mar. Pollut. Bull., 30, 41–46, 1995a.
river-BGD
6, 1091–1119, 2009Riverine silica flux to the ocean – a model
study
C. Y. Bernard et al.
Title Page
Abstract Introduction
Conclusions References
Tables Figures
◭ ◮
◭ ◮
Back Close
Full Screen / Esc
Printer-friendly Version
Interactive Discussion
dominated coastal waters : stoichiometric nutrient balance and its consequences, Estuar. Coast. Shelf S., 40, 339–356, 1995b.
Kroeze, C. and Seitzinger, S. P.: Nitrogen inputs to rivers, estuaries and continental shelves and related nitrous oxide emissions in 1990 and 2050: a global model, Nutr. Cycl. Agroecosys., 52, 195–212, 1998.
5
Mahowald, N. M., Muhs, D. R., Levis, S., Rasch, P. J., Yoshioka, M., Zender, C. S., and Luo, C.: Change in atmospheric mineral aerosols in response to climate: Last glacial period, preindustrial, modern, and doubled carbon dioxide climates, J. Geophys. Res.-Atmos., 111, D10202, doi:10.1029/2005JD006653, 2006.
Maier-Reimer, E.: Geochemical cycles in an ocean general circulation model. Preindustrial 10
tracer distributions, Global Biogeochem. Cy., 7, 645–677, 1993.
Maier-Reimer, E., Kriest, I., Segschneider, J., and Wetzel, P.: Technical description of the HAM-burg Ocean Carbon Cycle model, version 5.1 (HAMOCC5.1), and of its interface to MPI-OM, online: http://www.mpimet.mpg.de/wissenschaft/modelle/mpiom/mpiom-description. html, last access: 2008, 2005.
15
Marsland, S. J., Haak, H., Jungclaus, J. H., Latif, M., and Roske, F.: The Max-Planck-Institute global ocean/sea ice model with orthogonal curvilinear coordinates, Ocean Model., 5, 91– 127, 2003.
McGinnis, D. F., Bocaniov, S., Teodoru, C., Friedl, G., Lorke, A., and Wuest, A.: Silica retention in the Iron Gate I reservoir on the Danube River: The role of side bays as nutrient, River Res. 20
Appl., 22, 441–456, 2006.
Meybeck, M., Durr, H. H., and Vorosmarty, C. J.: Global coastal segmentation and its river catchment contributors: A new look at land-ocean linkage, Global Biogeochem. Cy., 20, 2006.
Nikiema, O., Devenon, J. L., and Baklouti, M.: Numerical modeling of the Amazon River plume, 25
Cont. Shelf Res., 27, 873–899, 2007.
Poulton, S. W. and Raiswell, R.: The low-temperature geochemical cycle of iron: From conti-nental fluxes to marine sediment deposition, Am. J. Sci., 302, 774–805, 2002.
Purcell, J. E., Malej, A., and Benovic, A.: Potential links of jellyfish to eutrophication and fish-eries, in: Ecosystems at the land-sea margin: drainage basin to coastal sea, edited by: 30
Malone, T. C., Malej, A., Harding Jr., L. W., Smodlaka, N. and Turner, R. E., Coastal and Estuarine Studies, 55, 241–263, 1999.
BGD
6, 1091–1119, 2009Riverine silica flux to the ocean – a model
study
C. Y. Bernard et al.
Title Page
Abstract Introduction
Conclusions References
Tables Figures
◭ ◮
◭ ◮
Back Close
Full Screen / Esc
Printer-friendly Version
Interactive Discussion
changes in the Mississippi River and system responses on the adjacent continental shelf, Estuaries, 19, 386–407, 1996.
Rabouille, C., Mackenzie, F. T., and Ver, L. M.: Influence of the human perturbation on car-bon, nitrogen, and oxygen biogeochemical cycles in the global coastal ocean, Geochim. Cosmochim. Ac., 65, 3615–3641, 2001.
5
Ragueneau, O., Chauvaud, L., Leynaert, A., Thouzeau, G., Paulet, Y. M., Bonnet, S., Lorrain, A., Grall, J., and Corvaisier, R.: Direct evidence of a biologically active coastal silicate pump: Ecological implications, Limnol. Oceanogr., 47, 1849–1854, 2002.
Seitzinger, S. P., Harrison, J. A., Dumont, E., Beusen, A. H. W., and Bouwman, A. F.: Sources and delivery of carbon, nitrogen, and phosphorus to the coastal zone: An overview of Global 10
Nutrient Export from Watersheds (NEWS) models and their application, Global Biogeochem. Cy., 19, GB4S01, doi:10.1029/2005GB002606, 2005.
Six, K. D. and MaierReimer, E.: Effects of plankton dynamics on seasonal carbon fluxes in an ocean general circulation model, Global Biogeochem. Cy., 10, 559–583, 1996.
Treguer, P., Nelson, D. M., Vanbennekom, A. J., Demaster, D. J., Leynaert, A., and Queguiner, 15
B.: The Silica Balance in the World Ocean – a Reestimate, Science, 268, 375–379, 1995. Ver, L. M. B., Mackenzie, F. T., and Lerman, A.: Carbon cycle in the coastal zone: effects of
global perturbations and change in the past three centuries, Chem. Geol., 159, 283–304, 1999.
Vorosmarty, C. J., Fekete, B. M., Meybeck, M., and Lammers, R. B.: Global system of rivers: 20
Its role in organizing continental land mass and defining land-to-ocean linkages, Global Bio-geochem. Cy., 14, 599–621, 2000a.
Vorosmarty, C. J., Fekete, B. M., Meybeck, M., and Lammers, R. B.: Geomorphometric at-tributes of the global system of rivers at 30-minute spatial resolution, J. Hydrol., 237, 17–39, 2000b.
25
Wells, M. L. and Mayer, L. M.: Variations in the Chemical Lability of Iron in Estuarine, Coastal and Shelf Waters and Its Implications for Phytoplankton, Mar. Chem., 32, 195–210, 1991. Wells, M. L. and Trick, C. G.: Controlling iron availability to phytoplankton in iron-replete coastal
waters, Mar. Chem., 86, 1–13, doi:10.1016/j.marchern.2003.10.003, 2004.
Wetzel, P.: Interannual and Decadal Variability in the Air-Sea Exchange of CO2 – a Model 30
Study, Ph.D. thesis, p. 127, 2004.
BGD
6, 1091–1119, 2009Riverine silica flux to the ocean – a model
study
C. Y. Bernard et al.
Title Page
Abstract Introduction
Conclusions References
Tables Figures
◭ ◮
◭ ◮
Back Close
Full Screen / Esc
Printer-friendly Version
Interactive Discussion Table 1.Data sources for nutrient forms used here as riverine inputs.
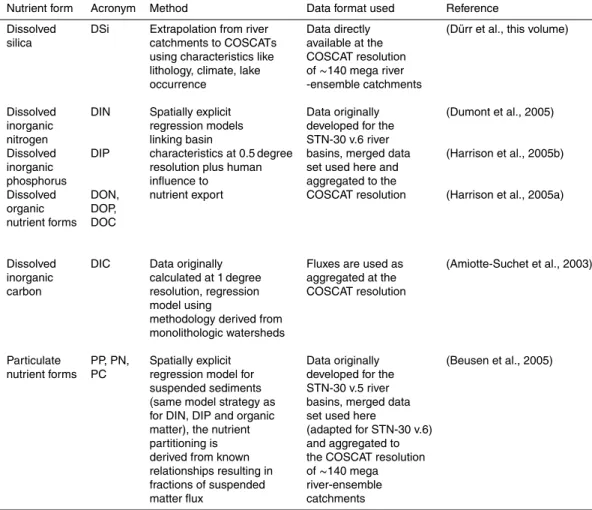
Nutrient form Acronym Method Data format used Reference
Dissolved DSi Extrapolation from river Data directly (D ¨urr et al., this volume) silica catchments to COSCATs available at the
using characteristics like COSCAT resolution lithology, climate, lake of∼140 mega river occurrence -ensemble catchments
Dissolved DIN Spatially explicit Data originally (Dumont et al., 2005) inorganic regression models developed for the
nitrogen linking basin STN-30 v.6 river
Dissolved DIP characteristics at 0.5 degree basins, merged data (Harrison et al., 2005b) inorganic resolution plus human set used here and
phosphorus influence to aggregated to the
Dissolved DON, nutrient export COSCAT resolution (Harrison et al., 2005a) organic DOP,
nutrient forms DOC
Dissolved DIC Data originally Fluxes are used as (Amiotte-Suchet et al., 2003) inorganic calculated at 1 degree aggregated at the
carbon resolution, regression COSCAT resolution model using
methodology derived from monolithologic watersheds
Particulate PP, PN, Spatially explicit Data originally (Beusen et al., 2005) nutrient forms PC regression model for developed for the
suspended sediments STN-30 v.5 river (same model strategy as basins, merged data for DIN, DIP and organic set used here
BGD
6, 1091–1119, 2009Riverine silica flux to the ocean – a model
study
C. Y. Bernard et al.
Title Page
Abstract Introduction
Conclusions References
Tables Figures
◭ ◮
◭ ◮
Back Close
Full Screen / Esc
Printer-friendly Version
Interactive Discussion Fig. 1.Integrated annual flux of silica as added in the model grid, according to the 129 coastal
BGD
6, 1091–1119, 2009Riverine silica flux to the ocean – a model
study
C. Y. Bernard et al.
Title Page
Abstract Introduction
Conclusions References
Tables Figures
◭ ◮
◭ ◮
Back Close
Full Screen / Esc
Printer-friendly Version
Interactive Discussion Fig. 2. River contribution to the surface silicic acid concentration. (Left) Sea surface map
concentration of the silicic acid inµmol l−1
BGD
6, 1091–1119, 2009Riverine silica flux to the ocean – a model
study
C. Y. Bernard et al.
Title Page
Abstract Introduction
Conclusions References
Tables Figures
◭ ◮
◭ ◮
Back Close
Full Screen / Esc
Printer-friendly Version
Interactive Discussion Fig. 3.Left, annually integrated photosynthesis in the euphotic ocean layer, the photosynthesis
is expressed in mmol P m2yr−1
BGD
6, 1091–1119, 2009Riverine silica flux to the ocean – a model
study
C. Y. Bernard et al.
Title Page
Abstract Introduction
Conclusions References
Tables Figures
◭ ◮
◭ ◮
Back Close
Full Screen / Esc
Printer-friendly Version
Interactive Discussion Fig. 4.The seasonal cycle of nutrient limitation (element equivalent phosphorous) in the
BGD
6, 1091–1119, 2009Riverine silica flux to the ocean – a model
study
C. Y. Bernard et al.
Title Page
Abstract Introduction
Conclusions References
Tables Figures
◭ ◮
◭ ◮
Back Close
Full Screen / Esc
Printer-friendly Version
Interactive Discussion Fig. 5. Rivers contribution to the Opal export production in mol Si m−2year−1 – without silica