120
THE NEED OF DASHBOARD IN SOCIAL RESEARCH NETWORK SITES FOR RESEARCHERS
Siti Hawa Apandi, Ruzaini Abdullah Arshah
Faculty of Computer Systems & Software Engineering, Universiti Malaysia Pahang, 26300 Gambang, Pahang, Malaysia
Email: [email protected], [email protected] Phone: +60139979560
ABSTRACT
Nowadays, dashboard has been widely used by organizations to display information based on their objectives such as monitoring business performance or checking the current trend in the niche market. There is a need to investigate whether the researchers also need the dashboard in assisting their research works. There are some issues facing by researchers while using Social Research Network Sites (SRNS) since they could not noticed with information related to research field that they might be interested in because they are huge amounts of information in the SRNS. The inclusion of dashboard in the SRNS has to be explored to understand its relevancy in supporting the researchers work. We review previous works regarding dashboard usage to find the purposes of having dashboard and find researcher needs by reviewing researchers use scenario in the social networking sites. Then, we analyze whether the dashboard purposes can satisfy the researcher needs. From the analysis, we found out that the dashboard is a significant tool in assisting the researchers on: measuring their own research performance, monitoring research trends and alerting them with upcoming events.
Keywords: Dashboard; Social Research Network Sites; researchers; awareness.
INTRODUCTION
Many people have uses social media such as social networking sites as a platform for communication in their everyday life. The social networking sites rapidly flourished because it can connect people from anywhere at any time. Researchers as a part of the global community have also use the social networking sites for their research works, as well as getting connected with their peers. There are specialized social networking sites for the researchers known as Social Research Network Sites (SRNS). The researchers use the SRNS in order to fulfill their needs such as to find other researchers with similar interests or expertise, to keep in touch with their peers and to share information (Giglia, 2011; Li & Gillet, 2013).
121
users” (Reinhardt, 2012; Reinhardt & Mletzko, 2011). In order to cope with huge amount of information in the SRNS, the researchers need the awareness support to be embedded in their research practice (Reinhardt, Kadam, et al., 2012; Reinhardt, Mletzko, Sloep, & Drachsler, 2012) because the awareness support improves the effectiveness of how information is spread in communities (Lövstrand, 1991) and positively influences social interactions taking place in those communities (Gross, Stary, & Totter, 2005). The researchers also need metrics to measure their research performance. The metric is a type of performance measurement (Fitz-Gibbon, 1990) and it appear as a measurable number that usually used to evaluate success of the organizations or individuals. The researcher reputation is important so that they can be recognized by the other researchers in their research field. Therefore, the researchers will need a tool that can provide awareness support and to measure the researcher performance.
In this study, we investigate how the dashboard can be used to help satisfy the researcher needs in using SRNS. The remainder of this paper is structured as follows. In the next section, we discuss previous works on use of social networking by researchers, conceptualization of dashboard and dashboard for researchers. Methodology used in this study is then presented. This is followed with the discussion on the relevance of dashboard to researcher needs. Finally is the conclusion and future work of the study.
PREVIOUS WORKS
Use of Social Networking Sites by Researchers
The use of social networking sites for research has become essential parts of research practices (Cann, Dimitriou, & Hooley, 2011; Reinhardt et al., 2014; Rowlands, Nicholas, Russell, Canty, & Watkinson, 2011). This can be seen by many of today’s researchers adopted more than one tool of social networking sites for research-related activities (Collins & Hide, 2010; Gruzd, Staves, & Wilk, 2012). The social networking sites being used by the researchers can be categorized into two which are general social networking sites and Social Research Network Sites (SRNS).
122
status updates appeared in news feeds as not every user use it to post status that related to the research work (Masud, Afrin, Choudhury, & Ahmed, 2012).
As an alternative, the researchers use platforms that are specifically designed for research communities which are Social Research Network Sites (SRNS) (Bullinger, Hallerstede, Renken, Soeldner, & Moeslein, 2010; Masud et al., 2012). The SRNS have been defined as a web-based service that allows individual researchers to: 1) construct a public or semi-public profile within a bounded system for identity purpose, 2) articulate a list of other researchers with whom they share a connection and communicate for communication purpose, 3) share information with other researchers within the system for information purpose and 4) collaborate with other researchers within the system for collaboration purpose (Bullinger et al., 2010). The SRNS can be categorized as one of the social networking sites based on the functionalities provided. There are four functionalities in the SRNS which are identity and network management, information management, communication and collaboration. The SRNS provide collaboration functionality, which is not included in the general social networking sites. These four functionalities in the SRNS has allows collaboration and interaction between the researchers. Research collaboration means any research activity that is carried out by multiple individuals overcoming institutional, disciplinary, and geographic boundaries (Masud et al., 2012). Most researchers collaborate with different reasons such as: share and expand knowledge, make new connections, increase possibility of getting funds, motivation, speedup the work or publish more (Alhoori & Furuta, 2011). Further, the researchers can update and share information about their work and interests in the SRNS (Bullinger et al., 2010; Masud et al., 2012). Examples of the SRNS that mostly used by the researchers are Academia.edu, ResearchGate and Mendeley (Gruzd et al., 2012; Nentwich & König, 2014; Reinhardt, Kadam, et al., 2012).
Based on the explanation above, we can differentiate between the general social networking sites and SRNS as shown in Table 1.
Table 1. Difference between general social networking sites and Social Research Network Sites.
General social networking sites Social Research Network Sites (SRNS)
Type of users
Wide range of users such as kids, teenagers and adult people
Users consist of people who are involved in research works Purpose Used to keep in touch with other
people, socialize and entertainment
Used to share research work and also keep in touch and collaborate with other researchers
It shows that the SRNS is more suitable platform to be used by the researchers for their research work, since the users consist of the researchers.
123
embedded in their research practice in order to handle the huge amount of information in the SRNS (Reinhardt, Kadam, et al., 2012; Reinhardt, Mletzko, et al., 2012). The awareness support can improves the effectiveness of how information is spread in communities (Lövstrand, 1991) and positively influences social interactions taking place in those communities (Gross et al., 2005). The dashboard can be used as a tool to provide awareness facility to the researchers because, from a user interface perspective, it is a facility in which users may find aggregated information about the system’s current state, personal notifications, news and other important transactions (Reinhardt et al., 2014).
Conceptualization of Dashboard
We need to understand about dashboard in order to include dashboard as a tool to provide awareness to the researchers in the SRNS. The term dashboard is always associated with the dashboard used in vehicles (Mahendrawathi, Pranantha, & Utomo, 2010; Pauwels et al., 2009; Yigitbasioglu & Velcu, 2012). For example, a car dashboard provides us important information about status of the car likes amount of gas, speed and temperature. This information is important for the driver to make sure that the car is in good condition to be used for driving (Corp, 2004; Malik, 2005).
There are several definitions about the dashboard in the field of information management. Malik (2005) has define the dashboard as “a computer interface with charts, reports, visual indicators and alert mechanisms that are consolidated into dynamic and relevant information platform”. Few (2006) state the dashboard as “a visual display of the most important information needed to achieve one or more objectives; consolidated and arranged on a single screen so the information can be monitored at a glance” (Few, 2006). Bose (2006) describe dashboard as “a software application that provides a single-screen display of relevant and critical business metrics and analytics to enable faster and more effective decision making”.
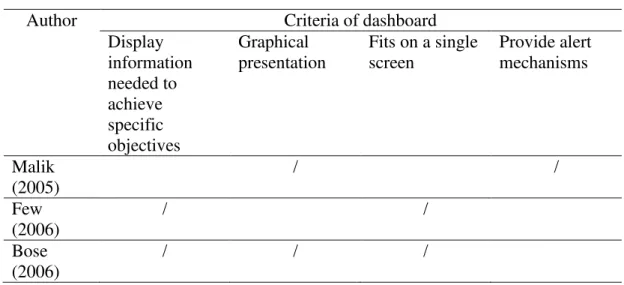
Based on the dashboard definitions, we can identify criteria of dashboard as shown in Table 2.
Table 2. Criteria of dashboard.
Author Criteria of dashboard
Display information needed to achieve specific objectives
Graphical presentation
Fits on a single screen
Provide alert mechanisms
Malik (2005)
/ /
Few (2006)
/ /
Bose (2006)
124
The explanation about criteria of the dashboard is as follows: i. Display information needed to achieve specific objectives
The right key metrics should be included in the dashboard to achieve specific objectives such as to indicate performance status (Few, 2006; Pauwels et al., 2009; West, 2012).
ii. Graphical presentation
The information should be presented in a form of visualizations such as gauges, charts, and tables, often color-coded for easy summarization (Bauer, 2004; Lehmann & Reibstein, 2006). It is the best way to “present the information so that human eyes can take in quickly and human brains can easily extract the correct and most important meanings from it” (Few, 2006; Yigitbasioglu & Velcu, 2012).
iii. Fits on a single screen
The information in the dashboard must fit on a single screen so that it is easy for the user to view the information at a glance (Few, 2006; Morton-Owens & Hanson, 2012). If the information needs to be scroll, it has surpassed limitless of the dashboard (Mahendrawathi et al., 2010). The dashboard has provide drill-downs capabilities to display more detailed of the information (Bateman, Teevan, & White, 2012; Mahendrawathi et al., 2010).
iv. Provide alert mechanisms
The alert mechanisms serve as a warning system when a key performance indicator (KPI) shows poor performance or an undesired trend. In order to attract user attention, the alert mechanisms accompanied by attention-capturing actions such as blinking (Malik, 2005).
We can conclude that the dashboard is a single screen interface with a graphical presentation that displays relevant information that needed to achieve particular objectives and accompanied with alert mechanisms.
Dashboard for Researchers
125
METHODOLOGY
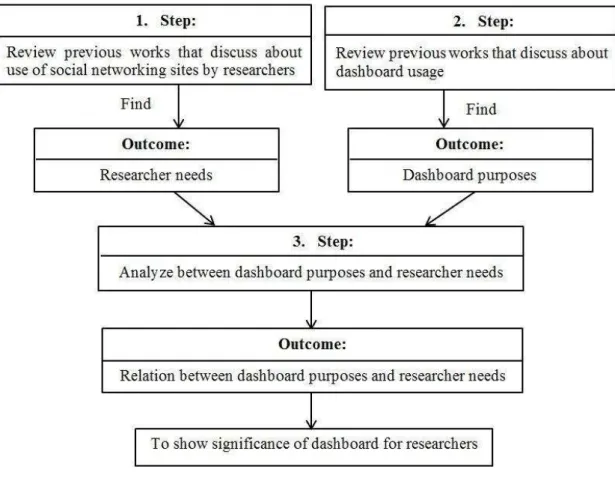
The purpose of this study is to find significance of dashboard for the researchers. In order to do that, we analyze previous works regarding the researchers’ reasons on using social networking sites in order to understand the researcher needs. Then, we have to investigate the dashboard usage to find its purposes. Further, we have to analyze the relevancy of the dashboard purposes with relation to the researcher needs. From the relationship relevancy, we can provide the justification on the significance of the dashboard for the researchers needs. Figure 1 shows the methodology used in this study.
Figure 1. Methodology used in this study.
RELEVANCE OF DASHBOARD TO RESEARCHER NEEDS
We used most widely academic search engine, Google Scholar (Osborne, Motta, & Mulholland, 2013) to find previous works that discuss about the researchers use of social networking sites and also the usage of the dashboard. The keywords that we used to find the previous works were “social networking sites”, “researchers”, “dashboard”, “performance measurement” and “awareness”. We filtered the articles that relevance to our study. This approach of review previous works also had been used in (Yigitbasioglu & Velcu, 2012). We used a concept matrix to extract important points from the previous works (Webster & Watson, 2002).
126
127
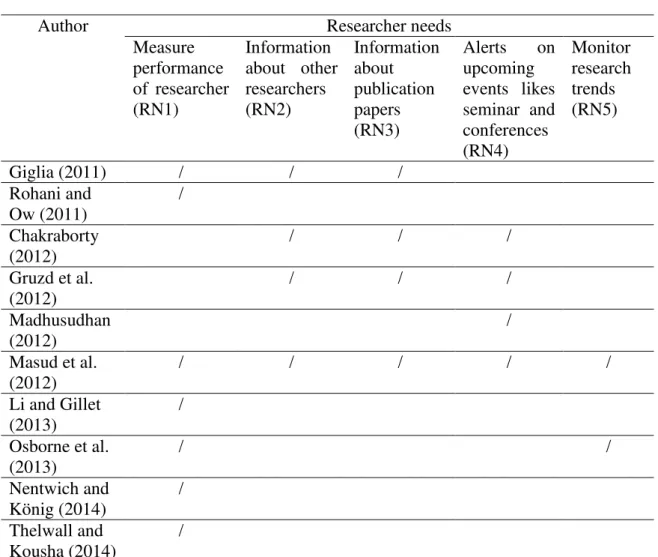
Table 3. Researcher needs.
Author Researcher needs
Measure performance of researcher (RN1)
Information about other researchers (RN2) Information about publication papers (RN3)
Alerts on upcoming events likes seminar and conferences (RN4) Monitor research trends (RN5)
Giglia (2011) / / /
Rohani and Ow (2011) / Chakraborty (2012) / / /
Gruzd et al. (2012)
/ / /
Madhusudhan (2012)
/
Masud et al. (2012)
/ / / / /
Li and Gillet (2013)
/
Osborne et al. (2013) / / Nentwich and König (2014) / Thelwall and Kousha (2014) /
128
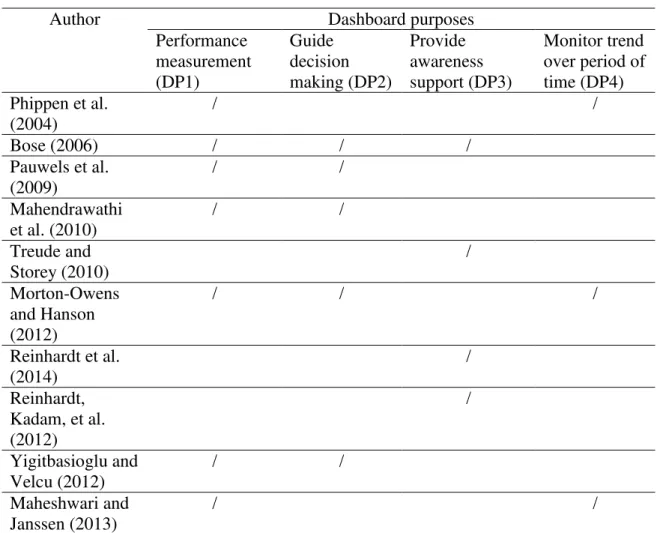
software development teams to provide awareness for project status. Bose (2006) state alert messages can be used to make the user aware of the information needed. Lastly, the dashboard also can be used to monitor trend over time (DP4) (Maheshwari & Janssen, 2013; Morton-Owens & Hanson, 2012; Phippen et al., 2004). By comparing current and past information, the dashboard can identify what trending up or down. Based on previous works of the dashboard usage, we have identified four points regarding the dashboard purposes; namely performance measurement (DP1), guide decision making (DP2), provide awareness support (DP3) and monitor trend over period of time (DP4) as presented in Table 4.
Table 4. Dashboard purposes.
Author Dashboard purposes
Performance measurement (DP1)
Guide decision making (DP2)
Provide awareness support (DP3)
Monitor trend over period of time (DP4) Phippen et al.
(2004)
/ /
Bose (2006) / / /
Pauwels et al. (2009)
/ /
Mahendrawathi et al. (2010)
/ /
Treude and Storey (2010)
/
Morton-Owens and Hanson (2012)
/ / /
Reinhardt et al. (2014)
/
Reinhardt, Kadam, et al. (2012)
/
Yigitbasioglu and Velcu (2012)
/ /
Maheshwari and Janssen (2013)
/ /
The purposes of the dashboard (DP1-DP4) are then analyzed to seek whether these purposes can satisfy the needs of researcher (RN1-RN5) in their research works. From the analysis, we can see the relevance of the dashboard to be used by the researchers to cater their needs.
Every day, each research field gets deeper with increasing number of publication papers. Thus, a research trends can be generated (RN5) such as by making comparison number of publication papers in various research fields versus years. From that, we can see which research fields are growing and shrinking. The dashboard can be used to monitor trend over period of time (DP4).
129
reputation (Li & Gillet, 2013). The impact factor can be example of the metric to measure the researcher performance which might help them to know their ranking in the research community. As stated by Rohani and Ow (2011), “ranking mechanism can create an enthusiasm for users to increase their rank and enhance their position in their university or colleges”. The dashboard can be used to measure performance of researcher (RN1) as the dashboard has been used by the company to measure their business performance (DP1).
Besides, the researchers want to be alerts on upcoming events likes seminar and conferences on a specific topic (RN4). Thus, the researchers can submit their publication paper to the event that related to their research interests (Chakraborty, 2012; Tang et al., 2008). The dashboard has ability to provide awareness support (DP3) (Reinhardt, Kadam, et al., 2012; Reinhardt et al., 2014; Treude & Storey, 2010) to make the researchers noticed information about the other researchers, publication papers and events related to their research interest.
Table 5 shows the relationship between the need of researchers with the dashboard purposes. From here, we can see relevance of the dashboard purposes to cater the researcher needs.
Table 5. Relationship between dashboard purposes and researcher needs.
Dashboard purposes Researcher needs
Monitor trend over period of time (DP4) Monitor research trends (RN5)
Performance measurement (DP1) Measure performance of researcher (RN1) Provide awareness support (DP3) Alerts on upcoming events likes seminar
and conferences (RN4)
Based on the analysis, the dashboard is identified as a significant tool in assisting the researcher needs on: 1) measuring their own research performance, 2) monitoring research trends and 3) alerting them with upcoming events.
CONCLUSION AND FUTURE WORK
The main contribution of this paper is to show significance of dashboard for researchers based on a relation between the dashboard purpose and the researcher needs. The dashboard has been identified to help the researchers to measure the researcher performance, to monitor research trends and alerts on upcoming events. Future work will be to identify dashboard items by reviewing features in the existing social networking sites. The dashboard items identification will be selected based on suitability to support the researcher needs on the dashboard. With these dashboard items, a proposed model of researchers’ dashboard in SRNS can be established.
REFERENCES
Alhoori, H., & Furuta, R. (2011). Understanding the dynamic scholarly research needs and behavior as applied to social reference management. Research and Advanced Technology for Digital Libraries, 169-178.
130
Bauer, K. (2004). The CPM dashboard: The visuals. Information Management, 14(5), 41.
Bose, R. (2006). Understanding management data systems for enterprise performance management. Industrial Management & Data Systems, 106(1), 43-59.
Bullinger, A. C., Hallerstede, S. H., Renken, U., Soeldner, J.-H., & Moeslein, K. M. (2010). Towards research collaboration – A taxonomy of Social Research Network Sites. AMCIS 2010 Proceedings, 1-9.
Cann, A., Dimitriou, K., & Hooley, T. (2011). Social media: A guide for researchers. London: Research Information Network.
Chakraborty, N. (2012). Activities and reasons for using social networking sites by research scholars in NEHU: A study on Facebook and ResearchGate. 8th Convention PLANNER-2012, 19-27.
Collins, E., & Hide, B. (2010). Use and relevance of Web 2.0 resources for researchers.
14th International Conference on Electronic Publishing, 271-289.
Corp, N. (2004). Dashboard development and deployment: A methodology for success. Dourish, P., & Bellotti, V. (1992). Awareness and coordination in shared workspaces.
Proceedings of the 1992 ACM conference on Computer-supported cooperative work, 107-114.
Ellison, N. B. (2007). Social network sites: Definition, history, and scholarship. Journal
of Computer‐Mediated Communication, 13(1), 210-230.
Few, S. (2006). Information dashboard design: O'Reilly.
Fitz-Gibbon, C. T. (1990). Performance indicators (Vol. 2): Multilingual Matters. Giglia, E. (2011). Academic social networks: It’s time to change the way we do
research. European journal of physical and rehabilitation medicine, 47(2), 345-349.
Gross, T., Stary, C., & Totter, A. (2005). User-centered awareness in computer-supported cooperative work-systems: Structured embedding of findings from social sciences. International Journal of Human-Computer Interaction, 18(3), 323-360.
Gruzd, A., & Goertzen, M. (2013). Wired Academia: Why social science scholars are using Social Media. 2013 46th Hawaii International Conference on System Sciences (HICSS), 3332-3341.
Gruzd, A., Staves, K., & Wilk, A. (2012). Connected scholars: Examining the role of social media in research practices of faculty using the UTAUT model.
Computers in Human Behavior, 28(6), 2340-2350.
Kumar, A., & Kumar, R. (2013). Use of Social Networking Sites (SNSs): A study of Maharishi Dayanand University, Rohtak, India. Library Philosophy and
Practice (e-journal).
Lehmann, D. R., & Reibstein, D. J. (2006). Marketing metrics and financial
performance: Marketing Science Inst.
Li, N., & Gillet, D. (2013). Identifying influential scholars in academic social media platforms. Proceedings of the 2013 IEEE/ACM International Conference on Advances in Social Networks Analysis and Mining, 608-614.
Lövstrand, L. (1991). Being selectively aware with the khronika system. Proceedings of the Second European Conference on Computer-Supported Cooperative Work, 265-277.
Madhusudhan, M. (2012). Use of social networking sites by research scholars of the University of Delhi: A study. The International Information & Library Review,
131
Mahendrawathi, E., Pranantha, D., & Utomo, J. D. (2010). Development of dashboard for hospital logistics management. 2010 IEEE Conference on Open Systems (ICOS), 86-90.
Maheshwari, D., & Janssen, M. (2013). Measurement and benchmarking foundations: Providing support to organizations in their development and growth using dashboards. Government Information Quarterly, 30, S83-S93.
Malik, S. (2005). Enterprise dashboards: Design and best practices for IT: John Wiley & Sons.
Masud, S., Afrin, M., Choudhury, F. M., & Ahmed, S. I. (2012). VizResearch: Linking the knowledge of people and the people with knowledge. Procedia Computer
Science, 9, 1416-1425.
Morton-Owens, E. G., & Hanson, K. L. (2012). Trends at a glance: A management dashboard of library statistics. Information Technology and Libraries, 31(3), 36-51.
Nentwich, M., & König, R. (2014). Academia goes Facebook? The potential of social network sites in the scholarly realm Opening Science (pp. 107-124): Springer International Publishing.
Osborne, F., Motta, E., & Mulholland, P. (2013). Exploring scholarly data with rexplore
The Semantic Web–ISWC 2013 (pp. 460-477): Springer.
Pauwels, K., Ambler, T., Clark, B. H., LaPointe, P., Reibstein, D., Skiera, B., . . . Wiesel, T. (2009). Dashboards as a service: Why, what, how, and what research is needed? Journal of Service Research, 12(2), 175-189.
Phippen, A., Sheppard, L., & Furnell, S. (2004). A practical evaluation of Web analytics. Internet Research, 14(4), 284-293.
Reinhardt, W. (2012). Awareness support for knowledge workers in research networks.
(Ph.D. Thesis), Open University in the Netherlands (CELSTEC), Heerlen, The Netherlands.
Reinhardt, W., Kadam, P., Varlemann, T., Surve, J., Ahmad, M. I., & Magenheim, J. (2012). Supporting scholarly awareness and researchers’ social interactions using PUSHPIN. Proceedings of the 2nd workshop on awareness and reflection in technology-enhanced learning, CEUR Workshop Proceedings, 31-46.
Reinhardt, W., & Mletzko, C. (2011). Awareness in learning networks. Proceedings of the PLE Conference 2011, 12-20.
Reinhardt, W., Mletzko, C., Drachsler, H., & Sloep, P. B. (2014). Design and evaluation of a widget-based dashboard for awareness support in Research Networks.
Interactive Learning Environments, 22(5), 594-613.
Reinhardt, W., Mletzko, C., Sloep, P. B., & Drachsler, H. (2012). Understanding the meaning of awareness in Research Networks. Proceedings of the 2nd Workshop on Awareness and Reflection in Technology Enhanced Learning, Saarbrücken, Germany, 13-30.
Rohani, V. A., & Ow, S. H. (2011). Eliciting essential requirements for social networks in academic environments. 2011 IEEE Symposium on Computers & Informatics, 171-176.
Rowlands, I., Nicholas, D., Russell, B., Canty, N., & Watkinson, A. (2011). Social media use in the research workflow. Learned Publishing, 24(3), 183-195.
132
Thelwall, M., & Kousha, K. (2014). Academia.edu: Social Network or Academic Network? Journal of the Association for Information Science and Technology,
65(4), 721-731.
Treude, C., & Storey, M. (2010). Awareness 2.0: Staying aware of projects, developers and tasks using dashboards and feeds. 2010 ACM/IEEE 32nd International Conference on Software Engineering, 365-374.
Webster, J., & Watson, R. T. (2002). Analyzing the past to prepare for the future: Writing a literature review. Management Information Systems Quarterly, 26(2), 3.
West, D. M. (2012). Big data for education: Data mining, data analytics, and web dashboards. Governance Studies at Brookings.
Yigitbasioglu, O. M., & Velcu, O. (2012). A review of dashboards in performance management: Implications for design and research. International Journal of