www.biogeosciences.net/11/5675/2014/ doi:10.5194/bg-11-5675-2014
© Author(s) 2014. CC Attribution 3.0 License.
Soil–atmosphere exchange of ammonia in a non-fertilized grassland:
measured emission potentials and inferred fluxes
G. R. Wentworth, J. G. Murphy, P. K. Gregoire, C. A. L. Cheyne, A. G. Tevlin, and R. Hems Department of Chemistry, University of Toronto, 80 St. George Street, M5S 3H6, Toronto, Canada
Correspondence to:J. G. Murphy ([email protected])
Received: 5 March 2014 – Published in Biogeosciences Discuss.: 27 May 2014
Revised: 12 September 2014 – Accepted: 15 September 2014 – Published: 16 October 2014
Abstract. A 50-day field study was carried out in a semi-natural, non-fertilized grassland in south-western Ontario, Canada during the late summer and early autumn of 2012. The purpose was to explore surface–atmosphere exchange processes of ammonia (NH3)with a focus on bi-directional fluxes between the soil and atmosphere. Measurements of soil pH and ammonium concentration ([NH+4]) yielded the first direct quantification of soil emission potential (Ŵsoil=[NH+4]/[H+]) for this land type, with values ranging from 35 to 1850 (an average of 290). The soil compensation point, the atmospheric NH3 mixing ratio below which net emission from the soil will occur, exhibited both a seasonal trend and diurnal trend. Higher daytime and August com-pensation points were attributed to higher soil temperature. Soil–atmosphere fluxes were estimated using NH3 measure-ments from the Ambient Ion Monitor Ion Chromatograph (AIM-IC) and a simple resistance model. Vegetative effects were ignored due to the short canopy height and significant
Ŵsoil. Inferred fluxes were, on average, 2.6±4.5 ng m−2s−1 in August (i.e. net emission) and −5.8±3.0 ng m−2s−1 in September (i.e. net deposition). These results are in good agreement with the only other bi-directional exchange study in a semi-natural, non-fertilized grassland. A Lagrangian dispersion model (Hybrid Single-Particle Lagrangian Inte-grated Trajectory – HYSPLIT) was used to calculate air par-cel back-trajectories throughout the campaign and revealed that NH3 mixing ratios had no directional bias through-out the campaign, unlike the other atmospheric constituents measured. This implies that soil–atmosphere exchange over a non-fertilized grassland can significantly moderate near-surface NH3concentrations. In addition, we provide indirect evidence that dew and fog evaporation can cause a morning increase of [NH3]g. Implications of our findings on current
NH3bi-directional exchange modelling efforts are also dis-cussed.
1 Introduction
Atmospheric ammonia (NH3(g)) is the most abundant alka-line gas and is important for many biogeochemical and atmo-spheric processes (Seinfeld and Pandis, 2006). It neutralizes acidic aerosol, leading to increased mass loadings of fine at-mospheric particulate matter (PM2.5), which reduces visibil-ity and can cause adverse health effects (Pope et al., 2002). In addition, deposition of NH3 and other forms of reactive nitrogen (i.e. NOx, HNO3)can lead to eutrophication, soil acidification, and loss of biodiversity in sensitive ecosystems (Krupa, 2003). NH3is primarily emitted through agricultural activities (i.e. fertilization, animal waste) with minor contri-butions from transportation and chemical industries (Reis et al., 2009).
NH3(g) exists in equilibrium with aqueous ammonia (NH3(aq)) in surface reservoirs (i.e. apoplastic tissues of plants or soil pore water) that, at least in theory, can be de-scribed by the Henry’s law constant (KH). NH3(aq)is also in equilibrium with aqueous-phase ammonium (NH+4(aq)), gov-erned by the acid dissociation constant (Ka) of NH+4 and the pH of the solution. The gas-phase concentration above this aqueous phase at thermodynamic equilibrium is known as the compensation point (χ )and can, to a first approximation, be predicted according to
χ=
Ka· [NH+4(aq)]
KH· [H+]
, (1)
is below this value, net emission from the surface pool will be expected until the equilibrium NH3value (i.e.χ )is reached and vice versa. In order to account for the temperature depen-dence of the equilibrium constants, the van ’t Hoff equation must be applied so Eq. (1) can be updated to
χ=13 587·Ŵ·e−10 396KT ×109, (2) whereT is the temperature of the surface reservoir inK,Ŵ
is the emission potential equal to the ratio between [NH+4] and [H+] in the surface reservoir (Ŵ=[NH+4]/[H+]), and
χ is given in ppb or nmol mol−1 (Nemitz et al., 2001, 2004). A large Ŵ indicates the surface has a high propen-sity to emit NH3since it is directly proportional toχ. Val-ues forKH (10−1.76atm M−1) and enthalpy of vaporization (34.18 kJ mol−1) at 25◦C were obtained from Dasgupta and Dong (1986). The Kaand enthalpy of dissociation of NH+4 at 25◦C are 10−9.25M and 52.21 kJ mol−1, respectively (Bates and Pinching, 1950).
This conceptual model of a compensation point for NH3 was first suggested by Farquhar et al. (1980). Over the sub-sequent decades, numerous laboratory and field studies over a wide range of land types have been undertaken to validate and improve this framework. Single-layer exchange models were developed in the 1990s to account for bi-directional exchange with plant stomata and deposition to the cuticle (e.g. Sutton et al., 1993, 1995, 1998). A two-layer model was developed by Nemitz et al. (2001) that also included exchange with the soil. Nemitz et al. (2000) were able to create a multi-layer model that allowed for exchange with different layers within the canopy (i.e. inflorescences, bot-tom leaves) of oilseed rape. The flux of NH3(FNH3) above a surface reservoir can be calculated fromχwith an exchange velocity (νex) using the following:
FNH3 =νex·(χ− [NH3(g)]) (3)
The νex(units of m s−1)can be parameterized by applying resistances in either a series and/or parallel schematic. These resistances represent physical barriers to mass transfer and are analogous to electrical resistances. The number of re-sistances applied is dependent on how many surface reser-voirs are incorporated into the field-scale model. In all cases, aerodynamic (Ra) and quasi-laminar (Rb) resistances must be considered to account for the turbulence between the sur-face reservoir and NH3(g)measurement height.
Numerous pathways are present for bi-directional ex-change over land: via plant stomata, soil pore water, and ground litter. For each compartment there exists aχ which is dependent on the surface properties given in Eqs. (1) and (2). Significant effort has gone into measuring and mod-elling NH3fluxes over a wide variety of land types to pro-vide a more thorough understanding of this framework (Mas-sad et al., 2010; Zhang et al., 2010, and references therein). Canopy-scale resistance models of varying complexity have
been developed and successfully employed to mechanisti-cally describe NH3fluxes (e.g. Nemitz et al., 2001; Personne et al., 2009; Sutton et al., 1995). A detailed list of these mod-els is available in Flechard et al. (2013).
While extremely useful, these mechanistic canopy-scale models are often too complex to be directly incorporated into regional or global chemical transport models. As a re-sult, recent efforts have focused on simplifying previous models by empirically parameterizing certain components (usually Ŵ) with either a constant for each land type or a function using parameters (i.e. fertilizer application, re-gional long-term NH3 concentration) that are easily assim-ilated into the regional and global models (Bash et al., 2013; Cooter et al., 2010, 2012; Pleim et al., 2013; Wen et al., 2013; Wichink Kruit et al., 2010, 2012). Incorporating bi-directional NH3 exchange in these large-scale atmospheric models generally improves model performance. For instance, Bash et al. (2013) reduced the biases and error in both NHx deposition and aerosol concentration by coupling CMAQ (Community Multiscale Air-Quality) to an agro-ecosystem model and allowing for bi-directional exchange over the con-tinental United States. Wichink Kruit et al. (2012) incorpo-rated bi-directional exchange in the chemical transport model LOTOS-EUROS and found better agreement between mea-sured and modelled NH3 mixing ratios across Europe, al-though some domains were still biased low by up to a fac-tor of 2. Large uncertainties still exist for the parameteriza-tions of Ŵ for both stomata and soil over most land types as a result of sparse measurements. Field measurements of soil and vegetation [NH+4] and [H+], along with atmospheric
NH3mixing ratios, are required to evaluate the performance of regional air quality models attempting to parameterize bi-directional exchange.
Reviews by Massad et al. (2010) and Zhang et al. (2010) have summarized the studies to date that have explored bi-directional surface–atmosphere NH3 fluxes over a wide va-riety of different land types. The majority have focused on biosphere–atmosphere (i.e. stomatal) or canopy–atmosphere (i.e. sum of stomatal, litter, and soil) exchange. In the for-mer, both stomatal and cuticular resistances are incorpo-rated (Massad et al., 2010 and references therein). Indeed, there have been a limited number of studies strictly examin-ing soil–atmosphere bi-directional exchange. One reason is that if a significant canopy (i.e. forest or crops) is present, a significant fraction of soil NH3emissions are expected to be recaptured by the canopy before leaving it (Nemitz et al., 2000). For instance, Walker et al. (2013) estimated that ∼76 % of soil NH3emissions are recaptured by the canopy in a fertilized corn field during peak leaf area index (LAI).
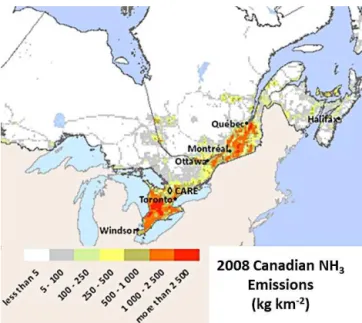
Figure 1.Location of CARE (♦)and major cities in the surrounding area. The map is coloured by annual NH3emissions according to the 2008 emission inventory.
of NH3, they account for a large land fraction and have the potential to impact the quality of atmospheric ammonia pre-dictions from these updated regional-scale models. In par-ticular, there have been fewer studies measuring NH3fluxes over grasslands (e.g. Mosquera et al., 2001; Spindler et al., 2001). Several studies (David et al., 2009; Herrmann et al., 2009; Milford et al., 2001; Sutton et al., 2001, 2009) have explored how different grassland management practices (cut-ting and fertilization) affect NH3fluxes; however, all of these studies were performed in fields that had received some de-gree of fertilization within the last 10 years. To our knowl-edge, only Wichink Kruit et al. (2007) have investigated NH3 bi-directional exchange over a non-fertilized grassland. The authors used several denuders and the aerodynamic gradient method to measure fluxes above the canopy and then infer both a canopyχandŴ.
Motivated by a lack of measurements in non-fertilized grasslands, this present study aims to measure χ andŴto provide a better constraint on these values since they are di-rectly employed in current air quality models that represent bi-directional exchange. Atmospheric measurements are then used to estimate a soil–atmosphere flux based on a simple resistance model that has been utilized in the past (e.g. Ne-mitz et al., 2001). Furthermore, we present evidence that bi-directional exchange over a non-fertilized grassland can sig-nificantly impact near-surface NH3concentrations, and that evaporation of dew can release large quantities of NH3.
2 Methods and materials 2.1 Field site
Measurements were taken from 12 August to 2 October 2012 at a rural site near Egbert, ON, located approxi-mately 70 km north of Toronto. The long-term sampling site, Centre for Atmospheric Research Experiments (CARE, 44◦13′51′′N, 79◦46′58′′W, 251 m a.s.l.), is operated by En-vironment Canada and situated in an agricultural area. Figure 1 shows the location of CARE in relation to major Cana-dian cities and is coloured according to annual NH3 emis-sions from 2008 (NPRI, 2008). Canada’s National Pollutant Release Inventory (NPRI) does not include soil or vegetative emissions from non-managed ecosystems. The site is located on a sharp transition with high NH3emissions to the south and negligible emissions to the north. Air masses originat-ing from the south are typically polluted since they pass over urban, industrial, and agricultural areas of southern Ontario and the north-eastern United States, whereas cleaner air usu-ally arrives from the north (e.g. Rupakheti et al., 2005). As a result, soil–atmosphere exchange of NH3can be examined under a wide range of atmospheric pollution regimes.
The site itself is surrounded by 60 ha of semi-natural, non-fertilized grassland with no overlying canopy. The month of August was relatively dry with cumulative precipitation to-talling 8 mm, whereas September had 75 mm of precipita-tion. The soil sampling area is contained within a radius of 10 m as this is the approximate flux footprint of the air sam-pling instrumentation explained in Sect. 2.4. Fertilizer has not been applied to the soil in at least 15 years. Grass at the site was cut on 27 June but remained uncut for the duration of the study. Over the course of the study, the grass grew from about 10 cm to a final height of 20 cm. The soil is sandy loam with an organic carbon content of roughly 5 % and a cation exchange capacity (CEC) of 22.7 cmol kg−1. The CEC re-flects the soil’s ability to retain cations (including NH+4)and at this site is an intermediate value relative to other soils. 2.2 Bi-directional exchange framework
For surfaces with minimal vegetation and a high soil emis-sion potential (Ŵsoil), the exchange between the soil and atmosphere is expected to dominate the bi-directional flux (Personne et al., 2009; Sutton et al., 2009). In these environ-ments, it should be reasonable to estimateνexby only con-sidering resistances affecting the exchange across the soil– atmosphere interface. As such,νexin this paper is approxi-mated using Eq. (4), which was derived from Su et al. (2011), who parameterized HONO soil fluxes in a similar fashion. This method is also the same as the two-layer resistance model developed by Nemitz et al. (2001) but ignores the stomatal and cuticular components.
νex=
1
Ra+Rb+Rinc+Rsoil
The aerodynamic (Ra) and quasi-laminar (Rb) resistances re-flect the macro- and molecular-scale turbulence, respectively, between the soil and measurement height of NH3(g). The in-canopy (Rinc)and soil (Rsoil)resistances account for pro-cesses within the canopy and at the soil interface that hinder the exchange of gases. According to the theory outlined in Hicks et al. (1987),RaandRbcan be calculated as such:
Ra=
ln(zref)−ln(z0)
κ·u∗
, (5)
Rb= 2
κ·u∗
· Sc
P r 2/3
, (6)
where zref is the height of the NH3 measurement (2.7 m),
z0 the roughness length, equal to 0.05 m for uncut grass (Seinfeld and Pandis, 2006), and the von Karman constant
κ=0.4. The Schmidt number (Sc=0.58) and Prandtl num-ber (P r=0.72) are taken from Hicks et al. (1987) and ac-count for the diffusivity of NH3 and heat transfer, respec-tively. The friction velocity,u∗, can be calculated by
u∗=
4 q
u′w′2+v′w′2, (7)
whereu′ andv′ are the deviations from the streamline
cor-rected half-hour mean of the horizontal component of wind velocity and w′ is the vertical component (Wilczak et al., 2001).
Parameterizations forRincandRsoil vary and are empiri-cally determined through measurements of net vertical flux above a given bulk surface. The former is found to be depen-dent on the canopy height, season, and land use, whereas the latter is primarily dictated by the Henry’s law constant and reactivity of the pollutant. For the present study, values of
Rinc=100 s m−1andRsoil=60 s m−1 are employed based on the work by Wesely (1989). These values correspond to resistances for a range land in midsummer with lush vegeta-tion and a soil pH of 6.
It should be reiterated that using Eqs. (3) to (7) to esti-mate soil–atmosphere NH3fluxes neglects any vegetative ef-fects (e.g. recapture of NH3, stomatal emission) and that this serves only as an approximation of NH3fluxes between the soil and the atmosphere.
2.3 Soil measurements
Measurements of soil [NH+4], pH, and temperature were nec-essary for calculating theχ. Soil cores were collected in trip-licate on 6 days during the campaign, all within 30 feet of the atmospheric measurement inlet. The sampling methodology outlined below is based on work done by Li et al. (2012) and van Miegroet (1995). Samples were collected six times throughout the campaign on the days listed in Table 1. Sites 1, 2, and 3 correspond to small (∼1 m2)areas 10 m west, directly below, and 10 m east of the sonic anemometer, re-spectively. The soil was sampled more frequently towards
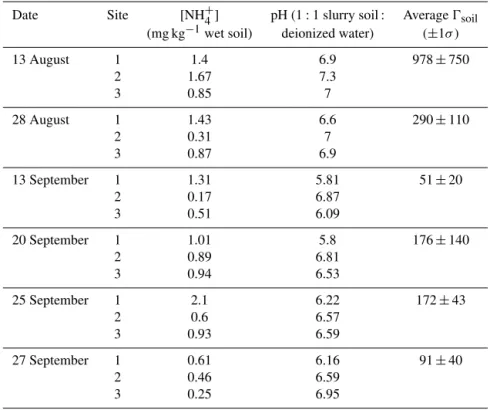
Table 1.Soil parameters measured in this study.
Date Site [NH+4] pH (1:1 slurry soil : AverageŴsoil (mg kg−1wet soil) deionized water) (±1σ )
13 August 1 1.4 6.9 978±750
2 1.67 7.3
3 0.85 7
28 August 1 1.43 6.6 290±110
2 0.31 7
3 0.87 6.9
13 September 1 1.31 5.81 51±20
2 0.17 6.87
3 0.51 6.09
20 September 1 1.01 5.8 176±140
2 0.89 6.81
3 0.94 6.53
25 September 1 2.1 6.22 172±43
2 0.6 6.57
3 0.93 6.59
27 September 1 0.61 6.16 91±40
2 0.46 6.59
3 0.25 6.95
International, Mississauga, ON) was immediately immersed in the slurry until a stable pH reading was obtained. This was done in triplicate for each soil core, and an average pH for each was calculated. Performing the pH measurements in a saline solution of 0.25 % KCl desorbs more H+ and was found to lower the pH reading by up to 1 unit relative to ex-traction into deionized water, which has been reported previ-ously (e.g. Walker et al., 2014). Soil temperature was logged hourly using five in situ sensors (iButtons, Maxim Integrated, San Jose, CA) placed 10 cm deep dispersed across the 30 foot radius of the soil sampling area. Moisture content was deter-mined gravimetrically for a subsample (∼3 g) of each core by drying in an oven at 105◦C for at least 24 h.
2.4 Atmospheric measurements
Ambient NH3(g)mixing ratios were needed to infer both the direction and magnitude of soil–atmosphere fluxes. Measure-ments of NH+4, SO24−, NO−3 in PM2.5 and their precursor gases (SO2, and HNO3) were also important to aid in in-terpretation of air mass trajectory. These water-soluble gases and ions in PM2.5 were measured continuously online ev-ery hour with the Ambient Ion Monitor Ion Chromatographs (AIM-IC) system (Model 9000D, URG, Chapel Hill, NC). The set-up has been explained in detail elsewhere (Markovic et al., 2012) and is described here only briefly. Ambient air is pulled at 3 L min−1through a PM2.5impactor to remove coarse particles. Gases are stripped from the sample flow by a liquid parallel plate denuder with a 2 mm H2O2 solution
continuously flowing over the surface. Particles have suffi-cient inertia to pass through the denuder assembly and en-ter a supersaturated steam condensation coil where they are grown hygroscopically and collected as an aqueous solution. The aqueous sample then travels through a 22 m sample line to the IC systems where the∼5 mL aliquots (collected over an hour) are separately injected and quantified for water sol-uble ions. The inlet box was mounted on a tower 3 m above the ground.
The AIM-IC was deployed using CS17 and AS19 analyt-ical columns, CG17 and AG19 guard columns, and TCC-ULP1 and TAC-TCC-ULP1 concentrator columns. Suppressed conductivity detection and reagent-free gradient elution were used. Five-point calibrations were performed at the begin-ning, middle, and end of the campaign. Standard solutions of known concentration were made by serial dilution of com-mercially available standards of mixed anions and cations discussed in the previous section.
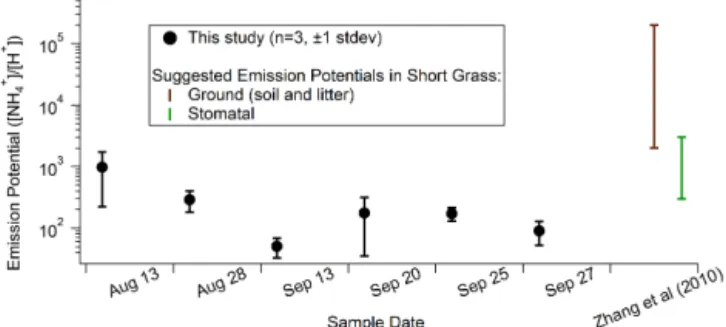
Figure 2.Soil emission potentials (Ŵsoil)measured throughout this study. Black circles represent the average of three measurements ±1σ. A review by Zhang et al. (2010) suggestsŴranges for ground (Ŵg) and stomata (Ŵstom)for low and high nitrogen input grass-lands. These ranges are shown in brown (Ŵg) and green (Ŵstom).
SO2, and HNO3), for which the limits of detection were 0.2, 0.003, and 0.008 ppb for NH3, SO2, and HNO3, respectively. For NH+4, SO24−, and NO−3 in the particle phase the detection limits were 0.025, 0.04, and 0.04 µg m−3, respectively.
Friction velocity (u∗) parameters were calculated from
wind velocity measured with a 3-D sonic anemometer (model CSAT3, Campbell Scientific, Logan, UT) operating at 10 Hz. Hourly relative humidity (RH) and air temperature (in◦C) at CARE were measured by an Environment Canada weather station located 20 m north of the sonic anemometer. This data was obtained from the Environment Canada web-site (http://climate.weather.gc.ca/data_index_e.html).
The Hybrid Single-Particle Lagrangian Integrated Trajec-tory (HYSPLIT) model was used to compute 48 h back-trajectories throughout the campaign in order to assess air parcel history (Draxler and Rolph, 2013). The model was run four times per day with parcels arriving at a height of 100 m above CARE at 02:00, 08:00, 14:00, and 20:00 LT. Resolution of the meteorology model (EDAS) was set to 40 by 40 km.
3 Results and discussion
3.1 Soil emission potential measurements
Figure 2 shows the measured Ŵsoil for the six soil sampling dates in this study. Soil [NH+4] and pH measurements used to determine theŴsoilare shown in Table 1. The variation in
Ŵsoilwas up to an order of magnitude on some days (13 Au-gust and 20 September) yet was more consistent on others (i.e. 13 and 25 September). Both August dates have the high-estŴsoilsuggesting there might be some seasonal variability, as has been observed for stomatal emission potentials (Ŵstom) (Loubet et al., 2002). However, a similar trend cannot be con-firmed for this study due to the relatively short time frame and the inherent heterogeneity of soil. Also shown in Fig. 2 is the range of ground emission potentials (Ŵg) in grasslands
suggested by Zhang et al. (2010).Ŵgincludes both soil and litter, but during this study there was a negligible amount of litter on the ground; therefore,ŴgandŴsoilshould be analo-gous. The suggested range inŴg(2000 to 200 000) is based on 14 values from six studies, all of which were in fertilized grasslands. Of these studies, only two (David et al., 2009; Mattsson et al., 2009) directly measured Ŵg, whereas the other four either inferred it from measurements of dead or dying leaves (Herrmann et al., 2009; Mattsson and Schjoer-ring, 2003) or modelled it (Burkhardt et al., 2009; Personne et al., 2009). All theŴsoil values (35 to 1850) measured in this study are below the range from the Zhang et al. (2010) review, likely because the field at CARE is non-fertilized and so has a lower N content. Suggested ranges ofŴgfrom Zhang et al. (2010) for various land types were recently in-corporated into a regional air quality model (STILT-Chem) by Wen et al. (2013) to allow for bi-directional exchange. The authors found the updated model, usingŴg=2000 over grasslands, overestimates NH3(g) in sites with lower NH3(g) concentrations (i.e. CARE). This could be a consequence of overestimating Ŵg in these regions, as implied by theŴsoil measurements given here.
Massad et al. (2010) carried out a similar review and sug-gested that Ŵg be parameterized as 500 in non-fertilized, semi-natural environments without vegetation. To our knowl-edge, the results presented here represent the first values of
Ŵsoil directly measured in a non-fertilized grassland. These measurements underscore the importance of distinguishing between fields that receive fertilization and those that do not. TheŴg range from Zhang et al. (2010) is not applicable to the field at CARE, whereas the estimation (Ŵg=500) from Massad et al. (2010) is more suitable.
It is worth comparingŴsoilto the range of stomatal emis-sion potentials (Ŵstom)in grasslands proposed by Zhang et al. (2010) (Fig. 2, green line).Ŵstom values (300 to 3000) are based on roughly 50 measurements from over two dozen studies which reflect the narrower range inŴstomcompared toŴg. Massad et al. (2010) also parameterizedŴstom, but did so by empirically fitting measurements to total annual N in-put instead of using a constant value for each land use type. These suggestedŴstom values from each review are on the same order as the Ŵsoil measured in this study, suggesting that in a non-fertilized field, the soil and vegetation might have a very similar propensity to either emit or uptake NH3 (i.e. they likely have similarχ ).
3.2 Inferred soil compensation point and fluxes
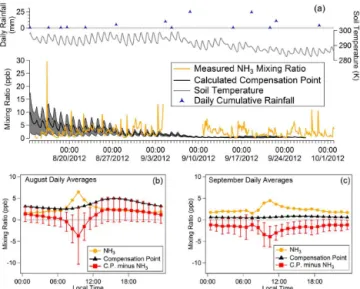
Figure 3.Time series of NH3mixing ratio ([NH3], orange trace),
χsoil(black trace), daily cumulative rainfall (blue markers) and soil temperature (Tsoil, grey trace) throughout the campaign(a).χsoil was calculated using a linear interpolation ofŴsoiland hourly soil temperature measurements. The shaded region aroundχsoilwas cal-culated by linear interpolation of±1σ ofŴsoiland reflects the un-certainty inχsoilas a result of uncertainty inŴsoil measurements. Panels(b)and(c)show time of day plots for the average [NH3],
χsoil, and difference between the two (χsoil– [NH3], red trace) for August and September, respectively. Errors bars in(b)and(c) rep-resent±1σand are only included for the difference trace for clarity.
[NH+4]. Hourly gas-phase NH3measured by the AIM-IC (or-ange trace) is also shown. These two traces frequently cross meaning that repeated switching between soil emission and atmospheric deposition is predicted. There is a clear decline inχsoil throughout the campaign that is mostly attributable to a decrease in soil temperature (Tsoil)as shown by the grey trace at the top of Fig. 3a. Precipitation can also be important factor for NH3fluxes – both Cooter et al. (2010) and Walker et al. (2013) observed emission “pulses” of NH3 over agri-cultural soils within 24 h after rainfall. Elevated [NH3] levels are seen on 13 August, 28 August, and 22 September follow-ing 0.4 mm, 5.0 mm, and 10.9 mm of rain. Reasons for this could include increased soil NH+4 available for exchange, in-creased diffusion of NH3 through soil, and/or increased N inputs to the surface as a result of wet deposition.
There is a diurnal trend inχsoil with lower values during the night-time that is a consequence of Tsoiland has been ob-served before for stomatal compensation points (Van Hove et al., 2002). It is possible there is a diurnal trend inŴsoilthat is not captured by the periodic soil sampling regime. However, this is unlikely since additional measurements from a nearby site found that spatial heterogeneity in soil [NH+4] was much larger than the temporal variability in 24 soil grabs taken 6 h apart (soil grabs were in triplicate) over the course of 2 days. Theχsoil diurnal trends are more evident in Fig. 3b and c, which show time-of-day plots for August and September,
re-Figure 4.Time-of-day plot showing the average hourly NH3flux in August (orange trace) and September (brown trace). A positive flux indicates emission from the soil, whereas a negative flux indicates deposition from the atmosphere.
spectively. During both months, NH3peaks between 08:00– 10:00 in the morning and is typically at a minimum during the evening where it plateaus at around 2 ppb, which has been observed previously in the region (e.g. Ellis et al., 2011). Mixing ratios were fairly similar in both months, although the morning peak in August was larger than in September. On the other hand, χsoil values were significantly lower in September as a result of lower soil temperatures. Accord-ingly, the diurnal profiles of the difference betweenχsoiland [NH3] (red trace) in Fig. 3b and c are distinct. In August, the difference betweenχsoiland [NH3] is positive throughout the majority of the day (excluding 07:00–11:00 in the morning), indicating a net flux from the soil to the atmosphere. On the other hand, in September the difference is negative through-out the entire day, meaning the soil is a continuous sink for atmospheric NH3. This suggests a clear transition from the soil being a net source to a net sink for NH3 due to lower soil temperatures. It should be noted that grass senescence had not yet begun and that there was no appreciable accu-mulation of litter, which has been shown to act as a strong source of NH3(e.g. David et al., 2009; Mattsson et al., 2009; Mattsson and Schjoerring, 2003).
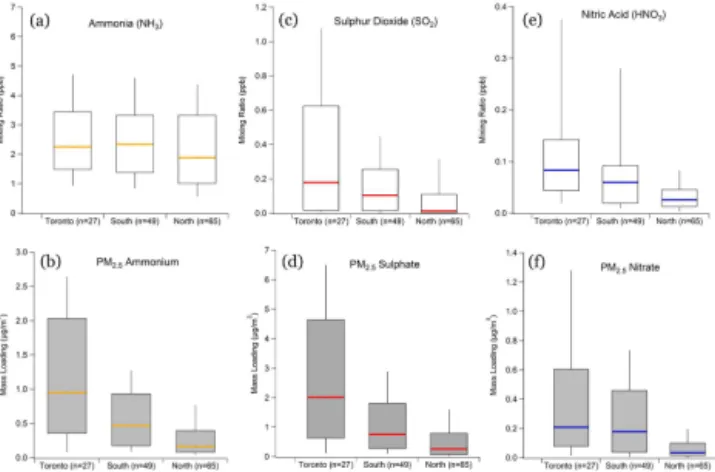
Figure 5.Atmospheric concentrations of(a)NH3,(b)particulate NH4+,(c)SO2,(d)particulate SO42−,(e)HNO3, and(f)particulate NO−3 binned by air mass origin calculated from HYSPLIT back-trajectories every 6 h throughout the campaign. The line denotes the median value, the interquartile range is encompassed within the box, and the end of the whiskers are the 10th and 90th percentiles. The number of back-trajectories in each bin is given on thexaxis in brackets.
approximation, it appears that NH3fluxes in both these non-fertilized fields are comparable. The larger deposition in the autumn in Wichink Kruit et al. (2007) is likely attributable to higher NH3mixing ratios (∼9 ppb average versus∼2 ppb September average in this study). It is noteworthy that both sites are considered the same land type but likely have very different canopy-level processes driving NH3fluxes. Specifi-cally, the soil in Wichink Kruit et al. (2007) had a sufficiently low pH (∼5) to suppress appreciable soil–atmosphere ex-change, which is not the case at CARE. Furthermore, a re-view by Schlesinger and Hartley (1992) estimate volatiliza-tion rates of NH3from undisturbed grasslands are between 0.3 and 30 ng m−2s−1, which encompasses the values from this work and that of Wichink Kruit et al. (2007).
It is also important to consider wet deposition when as-sessing net exchange of NH3 between the atmosphere and an ecosystem. The Canadian Air and Precipitation Monitor-ing Network (CAPMoN) collects daily precipitation sam-ples at CARE and reports the results online (http://www. on.ec.gc.ca/capmon/login/login.aspx). The average NH+4 wet deposition rates from 2001–2011 for August and Septem-ber are 12.4±4.6 ng m−2s−1 and 11.3±5.4 ng m−2s−1, respectively. In the context of our results (fluxes of 2.6±4.5 ng m−2s−1 in August and −5.8±3.0 ng m−2s−1 in September), the site at CARE has net NH3deposition in both months when one considers both wet deposition and bi-directional exchange. In other words, the magnitude of wet deposition fluxes is roughly 2–5 times larger than the magni-tude of bi-directional exchange. However, it is important to note that wet deposition occurs in discrete events, whereas dry exchange is continuous.
3.3 Evidence for bi-directional exchange
Since CARE lies on a sharp gradient between high NH3 emissions to the south and low emissions to north (Fig. 1), one might expect air masses from the north to be lower in NH3 relative to air masses from the south. Similarly, the greater level of anthropogenic activity south of CARE suggests an enrichment of anthropogenic pollutants (i.e. SO2, SO24−, HNO3 and NO−3) in air masses from the south. In order to interrogate this hypothesis, 2-day back-trajectories were calculated using the Hybrid Single Parti-cle Lagrangian Integrated Trajectory (HYSPLIT) model for every 6 h throughout the study. Each 6-hour time stamp was then classified as having had the air mass pass through Toronto (a box defined from 43.5–44.0◦N by 79.0–80.0◦N), or having originated from the north (spent more than half its time above 44.23◦N) or the south (spent more than half its time below 44.23◦N and not passing through Toronto). Re-sults from this analysis are shown in Fig. 5 and yield a dis-tinct directional bias for all species except NH3; air masses passing through Toronto are clearly enhanced in SO2, HNO3, NH+4, SO24−, and NO−3 but not NH3. A lack of directional bias for NH3could be explained by proximity to a large NH3 source, but as seen in Fig. 1, there is a sharp regional (tens of kilometres) gradient in the emissions inventory suggesting that no such local source exists. A more likely explanation is that bi-directional exchange of NH3between the surface and atmosphere modulates near-surface NH3 mixing ratios suf-ficiently to eliminate any directional bias that would result from traditional emission sources.
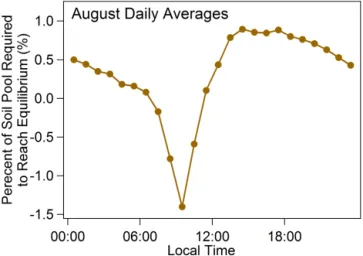
Considering the relatively lowŴsoiland small magnitude of soil fluxes, it is reasonable to ask whether such an ex-change could have a noticeable effect on observed NH3 mix-ing ratios. First, a simple calculation was performed to see if the soil reservoir contained enough NH+4 to sustain fluxes during the month of August. To do this, the following as-sumptions were made: NH3exchange occurs in the top 10 cm of soil, the soil is equilibrating a 1000 m atmospheric bound-ary layer, and soil density is 1.5 g cm−3. Figure 6 shows that even during peak soil emission in the afternoon, less than 1 % of the soil NH+4 pool is required to equilibrate the en-tire boundary layer. Furthermore, much of this lost soil NH+4 would be regained during the inferred morning deposition event. Considering that the turnover time for most soil NH+4 pools is of the order of a day (Booth et al., 2005), it is safe to assume that there is sufficient NH+4 in non-fertilized grass-lands to maintain fluxes to the atmosphere.
Figure 6.Estimated percent of the soil NH+4 pool required to equi-librate with the boundary layer (assumed to be 1000 m) using the average fluxes during August. The top 10 cm of the soil exchanges, and the soil density is 10 g cm−1(i.e. there are no units for “soil exchanges”). Positive values indicate fluxes are from the soil to the atmosphere (i.e. the soil is losing NH+4).
is calculated to be between 40 and 62 h for the fast and slow νex, respectively. However, for a height of 3 m, only 7 and 11 min are required to get halfway to equilibrium. Although this calculation neglects vertical mixing beyond 3 m (which will occur), these short timescales suggest soil– atmosphere exchange is an important component of observed negative [NH3(g)] gradients with height. In other words, soil– atmosphere exchange over non-fertilized grasslands has the ability to strongly influence near-surface NH3 despite the lowŴsoil (relative to fertilized fields) whereas the impact on NH3levels throughout the boundary layer is dampened due to slower exchange.
3.4 Morning increase of NH3
A morning increase in NH3(g) between 08:00–10:00 is clearly evident in Fig. 3b and c and has been observed else-where (e.g. Bash et al., 2010; Ellis et al., 2011; Flechard et al., 2013; Nowak et al., 2006; Wichink Kruit et al., 2007). The factors contributing to this phenomenon at CARE are not entirely clear but may include one or more of the follow-ing: dew evaporation, volatilization of particulate NH4NO3, emission from plants/soil, and/or mixing down of NH3rich air entrained above the nocturnal boundary layer. Wichink Kruit et al. (2007) observed a similarly timed increase that coincided with a decrease in leaf wetness. Furthermore, Flechard et al. (1999) and Bussink et al. (1996) found that water layers sorbed on leaves can store significant quantities of NH3even at an RH below 100 %. Although no leaf wet-ness sensor was employed during this study, we use night-time RH as a surrogate for dew and fog formation. Figure 7 shows the difference between the morning NHx(≡NH3(g)+ NH+4(particle)) and the average overnight NHx concentration.
Figure 7. The magnitude of the morning NHx (≡NH3(g)+ NH+4(particle)) peak subtracted from the night-time (00:00–6:00) NHxaverage versus the average night-time relative humidity. The latter was used as a surrogate for dew formation. The average1
NHx(±1σmean)both above and below RH=0.9 are shown inset in the figure.
the spike to coincide, but given that sunrise at CARE was between 06:00 and 07:15 throughout the campaign, stomatal emission is not likely the driving factor behind this trend at CARE. It is also possible this morning increase is linked to the break-up of the nocturnal boundary layer, as observed by Walker et al. (2006), who measured surface NH3fluxes over a fertilized soya bean field. Observations from this study rule out soil emissions and suggest that dew/fog evaporation plays a key role in enhancing morning NH3mixing ratios.
4 Conclusions
Measurements ofŴsoilandTsoilin a non-fertilized grassland were used to construct a time series of χsoil over a 50-day period.Ŵsoil ranged from 35 to 1850 with an average value of 290, which is well below the 2000 <Ŵg< 200 000 sugges-tion by Zhang et al. (2010) for grasslands. Zhang et al. (2010) recommended this range based on field studies exclusively in fertilized grasslands, which is likely the reasonŴgvalues in this study are lower. Indeed the distinction between fertiliza-tion and non-fertilizafertiliza-tion is critical in accurately assessing bi-directional exchange. Our findings are more in line with the parameterizations of Massad et al. (2010), who suggested a
Ŵgof 500 for semi-natural, non-fertilized areas without veg-etation. Seasonal and diurnal trends inχsoil were observed with lower values at night and in September due to decreases inTsoil.
Fluxes of NH3between the soil and atmosphere were esti-mated using [NH3(g)] measurements and a simple resistance scheme that neglects the influence of vegetation. August fluxes were primarily upwards, except between 07:00–11:00, and resulted in an average emission of 2.6±4.5 ng m−2s−1 from the soil. September was characterized by exclusive deposition from the atmosphere at a rate of 5.8±3.0ng m−2s−1. These values are fairly similar to fluxes measured by Wichink Kruit et al. (2007), who reported fluxes of 4 and −24 ng m−2s−1in the summer and autumn, respectively.
HYSPLIT analysis revealed that air masses passing through Toronto were enriched in atmospheric pollutants ex-cept NH3. Since CARE lies on a sharp gradient of high emis-sions to the south and low emission to the north, this lack of directional bias implies that bi-directional exchange effi-ciently modulates NH3mixing ratios. Back-of-the-envelope calculations confirm that: (1) the reservoir of NH+4 in soil of non-fertilized grasslands is large enough to sustain fluxes to the atmosphere and (2) fluxes are rapid enough to impact surface concentrations on a relevant timescale.
Figure 7 suggests that dew and fog evaporation can en-hance the frequently observed morning increase in NH3. It is unlikely that soil emissions contribute to this increase as deposition to the soil is predicted during the morning.
More research is needed to explore seasonal and annual trends in Ŵsoil, Ŵstomata, andχcanopy across all land types, particularly those lacking in measurements. Since
regional-scale models require these parameters as direct inputs, there is great utility in taking a “bottom-up” approach (i.e. mea-suringŴinstead of inferring it from flux data). Even though non-fertilized fields have lower nitrogen content, evidence provided here suggests surface–atmosphere exchange can still affect near-surface concentrations and that this process should be considered when measuring ambient NH3 over non-fertilized surfaces. The role of fog and dew as a night-time reservoir for water-soluble gases also requires further attention as it may greatly enhance morning NH3 concentra-tions and is currently not incorporated in models.
Acknowledgements. The AIM-IC was available through support to J. G. Murphy from the Canada Foundation for Innovation and the Ontario Research Fund. G. R. Wentworth and P. K. Gregoire acknowledge funding from the NSERC Integrating Atmospheric Chemistry and Physics from Earth to Space (IACPES) program. The authors are grateful to Environment Canada and the staff at CARE, as well as Greg Evans and Cheol-Heon Jeong for providing a mobile lab to house the instrumentation during the campaign.
Edited by: S. M. Noe
References
Bash, J. O., Walker, J. T., Katul, G. G., Jones, M. R., Nemitz, E., and Robarge, W. P.: Estimation of in-canopy ammonia sources and sinks in a fertilized Zea mays field., Environ. Sci. Technol., 44, 1683–1689, 2010.
Bash, J. O., Cooter, E. J., Dennis, R. L., Walker, J. T., and Pleim, J. E.: Evaluation of a regional air-quality model with bidi-rectional NH3 exchange coupled to an agroecosystem model, Biogeosciences, 10, 1635–1645, doi:10.5194/bg-10-1635-2013, 2013.
Bates, R. G. and Pinching, G. D.: Dissociation constant of aqueous ammonia at 0–50◦C from E.m.f. studies of the ammonium salt of a weak acid, Am. Chem. J., 72, 1393–1396, 1950.
Booth, M. S., Stark, J. M., and Rastetter, E.: Controls on nitrogen cycling in terrestrial ecosystems: a synthetic analysis of literature data, Ecol. Monogr., 75, 139–157, 2005.
Burkhardt, J., Flechard, C. R., Gresens, F., Mattsson, M., Jonge-jan, P. A. C., Erisman, J. W., Weidinger, T., Meszaros, R., Ne-mitz, E., and Sutton, M. A.: Modelling the dynamic chemi-cal interactions of atmospheric ammonia with leaf surface wet-ness in a managed grassland canopy, Biogeosciences, 6, 67–84, doi:10.5194/bg-6-67-2009, 2009.
Bussink, D. W., Harper, L. A., and Corré, W. J.: Ammonia trans-port in a temperate grassland: II. Diurnal fluctuations in response to weather and management conditions, Agron. J., 86, 621–626, 1996.
Cooter, E. J., Bash, J. O., Walker, J. T., Jones, M. R., and Ro-barge, W.: Estimation of NH3bi-directional flux from managed agricultural soils, Atmos. Environ., 44, 2107–2115, 2010. Cooter, E. J., Bash, J. O., Benson, V., and Ran, L.: Linking
to national-scale nitrogen assessments, Biogeosciences, 9, 4023– 4035, doi:10.5194/bg-9-4023-2012, 2012.
Dasgupta, P. K. and Dong, S.: Solubility of ammonia in liquid wa-ter and generation of trace levels of standard gaseous ammonia, Atmos. Environ., 20, 565–570, 1986.
David, M., Loubet, B., Cellier, P., Mattsson, M., Schjoerring, J. K., Nemitz, E., Roche, R., Riedo, M., and Sutton, M. A.: Am-monia sources and sinks in an intensively managed grassland canopy, Biogeosciences, 6, 1903–1915, doi:10.5194/bg-6-1903-2009, 2009.
Draxler, R. R. and Rolph, G. D.: HYSPLIT (Hybrid Single-Particle Lagrangian Integrated Trajectory) Model access via NOAA ARL READY Website, available at: http://www.arl.noaa.gov/ HYSPLIT.php (last access: 20 February 2014), NOAA Air Re-sources Laboratory, College Park, MD, 2014.
Ellis, R. A., Murphy, J. G., Markovic, M. Z., VandenBoer, T. C., Makar, P. A., Brook, J., and Mihele, C.: The influence of gas-particle partitioning and surface-atmosphere exchange on am-monia during BAQS-Met, Atmos. Chem. Phys., 11, 133–145, doi:10.5194/acp-11-133-2011, 2011.
Farquhar, G. D., Firth, P. M., Wetselaar, R., and Weir, B.: On the gaseous exchange of ammonia between leaves and the environ-ment: determination of the ammonia compensation point, Plant Physiol., 66, 710–714, 1980.
Flechard, C. R., Sutton, M. A., and Cape, J. N.: A dynamic chem-ical model of bi-directional ammonia exchange between semi-natural vegetation and the atmosphere, Q. J. Roy. Meteor. Soc., 125, 2611–2641, 1999.
Flechard, C. R., Massad, R.-S., Loubet, B., Personne, E., Simp-son, D., Bash, J. O., Cooter, E. J., Nemitz, E., and Sutton, M. A.: Advances in understanding, models and parameterizations of biosphere–atmosphere ammonia exchange, Biogeosciences, 10, 5183–5225, doi:10.5194/bg-10-5183-2013, 2013.
Herrmann, B., Mattsson, M., Jones, S. K., Cellier, P., Milford, C., Sutton, M. A., Schjoerring, J. K., and Neftel, A.: Vertical struc-ture and diurnal variability of ammonia exchange potential within an intensively managed grass canopy, Biogeosciences, 6, 15–23, doi:10.5194/bg-6-15-2009, 2009.
Hicks, B. B., Baldocchi, D. D., Meyers, T. P., Hosker, R. P., and Matt, D. R.: A preliminary multiple resistance routine for deriv-ing dry deposition velocities from measured quantities, Water Air Soil Pollut., 36, 311–330, 1987.
Krupa, S.: Effects of atmospheric ammonia (NH3) on terrestrial vegetation: a review, Environ. Pollut., 124, 179–221, 2003. Li, K., Zhao, Y., Yuan, X., Zhao, H., Wang, Z., Li, S., and
Malhi, S. S.: Comparison of factors affecting soil nitrate, ni-trogen, and ammonium nitrogen extraction, Commun. Soil Sci. Plant Anal., 43, 571–588, 2012.
Loubet, B., Milford, C., Hill, P. W., Tang, Y. S., Cellier, P., and Sutton, M. A.: Seasonal variability of apoplastic NH+4 and pH in an intensively managed grassland, Plant Soil, 238, 97–110, 2002. Markovic, M. Z., VandenBoer, T. C., and Murphy, J. G.: Charac-terization and optimization of an online system for the simulta-neous measurement of atmospheric water-soluble constituents in the gas and particle phases, J. Environ. Monit., 14, 1872–1884, 2012.
Massad, R.-S., Nemitz, E., and Sutton, M. A.: Review and param-eterisation of bi-directional ammonia exchange between
vegeta-tion and the atmosphere, Atmos. Chem. Phys., 10, 10359–10386, doi:10.5194/acp-10-10359-2010, 2010.
Mattsson, M. and Schjoerring, J. K.: Senescence-induced changes in apoplastic and bulk tissue ammonia concentrations of ryegrass leaves, New Phytol., 160, 489–499, 2003.
Mattsson, M., Herrmann, B., David, M., Loubet, B., Riedo, M., Theobald, M. R., Sutton, M. A., Bruhn, D., Neftel, A., and Schjoerring, J. K.: Temporal variability in bioassays of the stom-atal ammonia compensation point in relation to plant and soil nitrogen parameters in intensively managed grassland, Biogeo-sciences, 6, 171–179, doi:10.5194/bg-6-171-2009, 2009. Milford, C., Theobald, M. R., Nemitz, E., and Sutton, M. A.:
Dy-namics of ammonia exchange in response to cutting and fertilis-ing in an intensively-managed grassland, Water Air Soil Poll., 1, 167–176, 2001.
Mosquera, J., Hensen, A., Van den Bulk, W. C. M., Ver-meulen, A. T., and Erisman, J. W.: Long term NH3flux mea-surements above grasslands in the Netherlands, Water Air Soil Poll., 1, 203–212, 2001.
National Pollutant Release Inventory: 2008 Ammonia Emis-sions for Canada: http://www.ec.gc.ca/inrp-npri/donnees-data/ ap/index.cfm?lang=En (last access: 30 January 2014), 2011. Nemitz, E., Sutton, M. A., Schjoerring, J. K., Husted, S., and Paul
Wyers, G.: Resistance modelling of ammonia exchange over oilseed rape, Agr. Forest Meteorol., 105, 405–425, 2000. Nemitz, E., Milford, C., and Sutton, M. A.: A two-layer
canopy compensation point model for describing bi-directional biosphere-atmosphere exchange of ammonia, Q. J. Roy. Meteor. Soc., 127, 815–833, 2001.
Nemitz, E., Sutton, M. A., Wyers, G. P., and Jongejan, P. A. C.: Gas-particle interactions above a Dutch heathland: I. Surface exchange fluxes of NH3, SO2, HNO3and HCl, Atmos. Chem. Phys., 4, 989–1005, doi:10.5194/acp-4-989-2004, 2004. Nowak, J. B., Huey, L. G., Russell, A. G., Tian, D., Neuman, J. A.,
Orsini, D., Sjostedt, S. J., Sullivan, A. P., Tanner, D. J., We-ber, R. J., Nenes, A., Edgerton, E., and Fehsenfeld, F. C.: Analysis of urban gas phase ammonia measurements from the 2002 Atlanta Aerosol Nucleation and Real-Time Characteriza-tion Experiment (ANARChE), J. Geophys. Res., 111, D17308, doi:10.1029/2006JD007113, 2006.
Personne, E., Loubet, B., Herrmann, B., Mattsson, M., Schjoer-ring, J. K., Nemitz, E., Sutton, M. A., and Cellier, P.: SURFATM-NH3: a model combining the surface energy balance and bi-directional exchanges of ammonia applied at the field scale, Bio-geosciences, 6, 1371–1388, doi:10.5194/bg-6-1371-2009, 2009. Pleim, J. E., Bash, J. O., Walker, J. T., and Cooter, E. J.: Develop-ment and evaluation of an ammonia bidirectional flux parame-terization for air quality models, J. Geophys. Res. Atmos., 118, 3794–3806, 2013.
Pope, C. A., Burnett, R. T., Thun, M. J., Calle, E. E., Krewski, D., and Thurston, G. D.: Lung cancer, cardiopulmonary mortality, and long-term exposure to fine particulate air pollution, J. Am. Med. Assoc., 287, 1132–1141, 2002.
Reis, S., Pinder, R. W., Zhang, M., Lijie, G., and Sutton, M. A.: Reactive nitrogen in atmospheric emission inventories, At-mos. Chem. Phys., 9, 7657–7677, doi:10.5194/acp-9-7657-2009, 2009.
Brook, J. R., Vet, R., Jayne, J. T., and Worsnop, D. R.: An inten-sive study of the size and composition of submicron atmospheric aerosols at a rural site in Ontario, Canada, Aerosol Sci. Tech., 39, 722–736, 2005.
Schlesinger, W. H. and Hartley, A. E.: A global budget for atmo-spheric NH3, Biogeochemistry, 15, 191–211, 1992.
Seinfeld, J. H. and Pandis, S. N.: Atmospheric Chemistry and Physics: From Air Pollution to Climate Change, 2nd edn., John Wiley & Sons, Toronto, 2006.
Spindler, G., Teichmann, U., and Sutton, M. A.: Ammonia dry de-position over grassland – micrometeorlogical flux-gradient mea-surements and bidirectional flux calculations using an inferential model, Q. J. Roy. Meteor. Soc., 127, 795–814, 2001.
Su, H., Cheng, Y., Oswald, R., Behrendt, T., Trebs, I., Meixner, F. X., Andreae, M. O., Cheng, P., Zhang, Y., and Pöschl, U.: Soil nitrite as a source of atmospheric HONO and OH radicals., Science, 333, 1616–1618, 2011.
Sutton, M. A., Fowler, D., Moncrieff, J. B., and Storeton-West, R. L.: The exchange of atmospheric ammonia with veg-etated surfaces, II: Fertilized vegetation, Q. J. Roy. Meteor. Soc., 119, 1047–1070, 1993.
Sutton, M. A., Schjorring, J. K., Wyers, G. P., Duyzer, J. H., Ine-son, P., and PowlIne-son, D. S.: Plant-atmosphere exchange of am-monia, Philos. Trans. Phys. Sci. Eng., 351, 261–278, 1995. Sutton, M. A., Milford, C., Dragosits, U., Place, C. J., Singles, R. J.,
Smith, R. I., Pitcairn, C. E. R., Fowler, D., Hill, J., ApSi-mon, H. M., Ross, C., Hill, R., Jarvis, S. C., Pain, B. F., Phillipd, V. C., Harrison, R., Moss, D., Webb, J., Espen-hahn, S. E., Lee, D. S., Hornung, M., Ullyett, J., Bull, K. R., Em-mett, B. A., Lowe, J., and Wyers, G. P.: Dispersion, deposition and impacts of atmospheric ammonia: quantifying local budgets and spatial variability, Environ. Pollut., 102, 349–361, 1998. Sutton, M. A., Milford, C., Nemitz, E., Theobald, M. R., Hill, P. W.,
Fowler, D., Mattsson, M. E., Nielsen, K. H., Husted, S., Erisman, J. W., Otjes, R., Hensen, A., Mosquera, J., Cel-lier, P., Loubet, B., David, M., Genermont, S., Neftel, A., Blat-ter, A., Herrmann, B., Jones, S. K., Horvath, L., Führer, E. C., Mantzanas, K., Koukoura, Z., Williams, P., Flynn, M., and Riedo, M.: Biosphere-atmosphere interactions of ammonia with grasslands: experimental strategy and results from a new Euro-pean initiative, Plant Soil, 228, 131–145, 2001.
Sutton, M. A., Nemitz, E., Milford, C., Campbell, C., Eris-man, J. W., Hensen, A., Cellier, P., David, M., Loubet, B., Per-sonne, E., Schjoerring, J. K., Mattsson, M., Dorsey, J. R., Gal-lagher, M. W., Horvath, L., Weidinger, T., Meszaros, R., Dämm-gen, U., Neftel, A., Herrmann, B., Lehman, B. E., Flechard, C., and Burkhardt, J.: Dynamics of ammonia exchange with cut grassland: synthesis of results and conclusions of the GRAM-INAE Integrated Experiment, Biogeosciences, 6, 2907–2934, doi:10.5194/bg-6-2907-2009, 2009.
Van Hove, L. W.., Heeres, P., and Bossen, M..: The annual variation in stomatal ammonia compensation point of rye grass (Lolium perenneL.) leaves in an intensively managed grassland, Atmos. Environ., 36, 2965–2977, 2002.
Van Miegroet, H.: Inorganic nitrogen determined by laboratory and field extractions of two forest soils, Soil Sci. Soc. Am. J., 59, 549–553, 1995.
Walker, J. T., Robarge, W. P., Wu, Y., and Meyers, T. P.: Measure-ment of bi-directional ammonia fluxes over soybean using the modified Bowen-ratio technique, Agr. Forest Meteorol., 138, 54– 68, 2006.
Walker, J. T., Jones, M. R., Bash, J. O., Myles, L., Meyers, T., Schwede, D., Herrick, J., Nemitz, E., and Robarge, W.: Pro-cesses of ammonia air–surface exchange in a fertilizedZea mays
canopy, Biogeosciences, 10, 981–998, doi:10.5194/bg-10-981-2013, 2013.
Walker, J. T., Robarge, W. P., and Austin, R.: Modeling of ammo-nia dry deposition to a pocosin landscape downwind of a large poultry facility, Agric. Ecosyst. Environ., 185, 161–175, 2014. Wen, D., Zhang, L., Lin, J. C., Vet, R., and Moran, M. D.: An
evaluation of ambient ammonia concentrations over southern Ontario simulated with different dry deposition schemes within STILT-Chem v0.8, Geosci. Model Dev. Discuss., 6, 6075–6115, doi:10.5194/gmdd-6-6075-2013, 2013.
Wesely, M. L.: Parameterization of surface resistances to gaseous dry deposition in regional-scale numerical models, Atmos. Envi-ron., 23, 1293–1304, 1989.
Wichink Kruit, R. J., van Pul, W. A. J., Otjes, R. P., Hofschreuder, P., Jacobs, A. F. G., and Holtslag, A. A. M.: Ammonia fluxes and derived canopy compensation points over non-fertilized agricul-tural grassland in the Netherlands using the new gradient ammo-nia – high accuracy – monitor (GRAHAM), Atmos. Environ., 41, 1275–1287, 2007.
Wichink Kruit, R. J., van Pul, W. A. J., Sauter, F. J., van den Broek, M., Nemitz, E., Sutton, M. A., Krol, M., and Holt-slag, A. A. M.: Modeling the surface–atmosphere exchange of ammonia, Atmos. Environ., 44, 945–957, 2010.
Wichink Kruit, R. J., Schaap, M., Sauter, F. J., van Zanten, M. C., and van Pul, W. A. J.: Modeling the distribution of ammonia across Europe including bi-directional surface–atmosphere ex-change, Biogeosciences, 9, 5261–5277, doi:10.5194/bg-9-5261-2012, 2012.
Wilczak, J. M., Oncley, S. P., and Stage, S. A.: Sonic anemometer tilt correction algorithms, Bound.-Lay. Meteorol., 99, 127–150, 2001.