A R C H I V E S
o f
F O U N D R Y E N G I N E E R I N G
Published quarterly as the organ of the Foundry Commission of the Polish Academy of Sciences
ISSN (1897-3310)
Volume 7
Issue 1/2007
135 – 138
29/1
Identification of AG10 alloy’s mechanical
properties on base of ATND method
J. Pezda
a*a
Faculty of Chipless Forming Technology, University of Bielsko-Bia
łą
, Willowa 2, 43-309 Bielsko - Bia
ł
a, Poland
* Correspondence contact: e-mail: jpezda@ath.bielsko.pl
Received 08.02.2007; Approved for print on: 12.03.2007
Abstract
Knowledge about run of crystallization process of alloys constitutes a source of information on development of a new technology to prepare liquid metal and to control of preparation process of alloys within industry. Complicated shapes and big differences in wall thickness of castings made from Al.-Mg alloy and their behavior under changing loads require elaboration and implementation of a methods enabling determination of mechanical properties of the alloys on preparation stage before casting process. The paper presents application of simultaneous ATND method (thermal-voltage derivative analysis) in determination of mechanical properties of AG10 alloy. Investigated alloy was melted in electric resistance furnace, and next, one has performed registration of crystallization with use of ATND method and regression analysis aimed at elaboration of equations to determine mechanical properties of the investigated alloy. Obtained mathematical dependencies enable prompt check of the mechanical properties of the alloy as early as in stage of its preparation. The research performed in laboratory conditions needs verification in industry conditions with targeted production of automated control stand
Key words:mechanical properties, crystallization, ATD, ATND, regression analysis.
1. Introduction
AG10 cast alloy is rated among aluminum casting alloys. Alloys with magnesium become to be on a mass scale used in foundry industry due to its lower density and higher corrosion resistance comparing with typical silumins.
Keeping very stringent technological regime, assuring proper protection of liquid metal (fluxing agent) against impact of atmosphere in order to obtain correct structure of the material is an important factor in production of Al-Mg alloys [1,2].
Obtaining the best material structure for a specific requirements becomes possible with making use of theories on crystallization processes to control technological processes [3, 4]. Registration of a phenomena arisen in result of solidification process of alloys in order to determine their properties is enabled by a methods based on analysis of temperature changes run (thermal methods - ATD), of electric conductivity (electric
methods - AED) and the method of the Thermal-Voltage Derivative Analysis (ATND).
On temperature and voltage curves from ATND method one can observe thermal and voltage effects present on the curves in form of characteristic „peaks”. Values of temperature and voltage read outs for those characteristic points have become the base to taking up regression analysis aimed at obtaining mathematical dependencies, illustrating impact of change of those values on mechanical properties of alloys [5].
2. Methodology of the research
ATND method consists in permanent measurement of temperature and electric voltage generated on probes during crystallization and phase transformations of solidified alloy. In course of the measurement there are measured generated voltage and temperature of tested piece. Run of the crystallization is
shown in form of diagram created during solidification of the alloy.
In the performed research one has implemented AG10 commercial alloy, melted in electric resistance furnace. Metallic mould used to production of standardized test pieces according to PN-88/H-88002-2 standard was poured with the tested alloy; the mould was adapted to control course of the crystallization processes with ATND method. [5]
Diagram of the crystallization process for AG10 alloy with marked characteristic points is shown in the Fig. 1 (obtained with use of ATND method). Marked characteristics points for ATND method are:
a) points of thermal curve (T1 , T2), b) points of voltage curve (U1, U2).
Fig. 1. Crystallization curves of ATND method and characteristic points for AG10 alloy: a) complete course of the crystallization process, b) magnification of the marked area.
Read out values for those points (independent variables) constitute the base to creation of data files destined to regression analysis. Mechanical properties obtained in result of tests of the pieces, for which the crystallization process was recorded with use of ATND method, are the dependent variables.
Values of the characteristic points correlated with the mechanical properties (Table 1), served as input to computer program in order to carry out the regression analysis.
Tension tests were performed in Krakow Foundry Institute. The Fig. 2 shows example diagram of static tension test for AG10 alloy.
Table 1.
Mechanical properties of tested alloy
R0,02 R0,2 Rm Eśr A5
[MPa] [MPa] [MPa] [MPa
*104] [%]
HB
102 - 124 148 - 170 179 - 216 4,9 - 7,5 0,9 - 2,2 74,5 – 80,5
Fig. 2. Diagram of the tension test for AG10 alloy [6]
3. Description of the test results
In result of accomplished regression analysis one has obtained the equations (1-6) describing impact of change of the characteristic points on mechanical properties of AG10 alloy.
R0,02 = 804,1 - 1,7T1 + 0,57T2 + 6,55U2 ± 3,18 [MPa] (1)
R: 0,91; R2: 0,83; F ( 3,11) = 18,13 > F(0,05;3,11) = 3,58
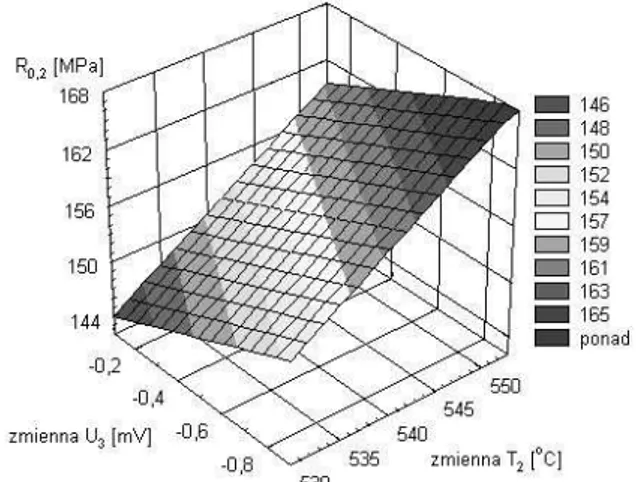
R0,2 = 264,2 - 0,75T1 + 0,61T2 - 10,22U3 ± 2,72 [MPa] (2)
R: 0,92; R2: 0,85; F ( 3,11) = 21,6 > F(0,05;3,11) = 3,58
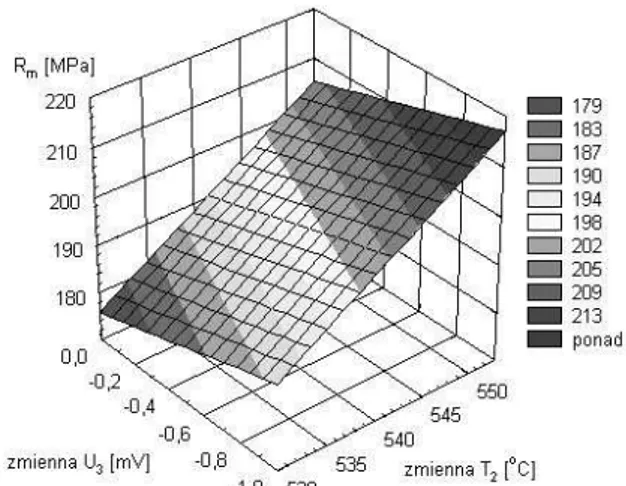
Rm = - 496,2 + 1,26T2 - 12,02U3 ± 3,7 [MPa]
(3)
R: 0,93; R2: 0,88; F (2,12) = 45,16 > F(0,05;2,12) = 3,88
A5 = -27,9 + 0,05T2 + 0,52U1 - 0,92U3 ± 0,17
(4)
R: 0,93; R2: 0,86; F ( 3,11) = 23,48 > F(0,05;3,11) = 3,58
HB = -62,3 + 0,25T2 + 1,62U1 + 2,49U3 ± 0,57
(5)
R: 0,95; R2: 0,91; F (3,11) = 38,99 > F(0,05;3,11) = 3,58
Eśr = 6,67 - 1,42U1 - 0,89U2 ± 0,27 [MPa ∗104]
(6)
R: 0,93; R2: 0,87; F (2,12) = 40,82 > F(0,05;2,12) = 3,88
In the Figs.3-6 there are shown forecasted and observed (real) values obtained on base of developed equations and performed strength test.
The Figs. 7-10 show an impact of change of the characteristic point values on a selected mechanical properties of tested alloy
Fig. 3. Diagram of forecasted and observed values of R0,02 variable.
Fig. 4. Diagram of forecasted and observed values of R0,2 variable
Fig. 5. Diagram of forecasted and observed values of Rm variable
Fig. 6. Diagram of forecasted and observed values of A5 variable
.
Fig. 7. Impact of change of T2 and U2 points value on R0,02 yield stress of AG10 alloy
Fig. 8. Impact of change of U3 and T2 points value on R0,2 yield stress of AG10 alloy
Fig. 9. Impact of change of U3 and T2 points value on Rm tensile strength of AG10 alloy
Fig. 10. Impact of change of U3 and T2 points value on A5 elongation of AG10 alloy
Changes in values of the following points of ATND method have a crucial impact on change of the mechanical properties of AG10 alloy:
- change of R0,02 value depends on T2 temperature (its growth results in growth of R0,02 value) and two variables remained in the model, namely T1 temperature and U2 voltage,
- changes of value of temperature variable [T2] and voltage variable [U3] impact in large degree on growth of R0,2 yield stress value.
- growth of Rm tensile strength is connected with increase of T2 temperature mainly, and in smaller extend with change of voltage in U3 point,
- change of A5 elongation value for AG10 alloy is connected with growth of T2 temperature mainly, and in smaller extend with change of U1 and U3 voltage,
- increase of T2 temperature results in growth of HB 10/1000/30 hardness. U1 and U3 voltage variables in smaller extend impact on change of alloy’s hardness,
- together with drop of values of U1 and U2 voltage variables we observe a growth of Eśr Young’s modulus.
4. Conclusions
On base of obtained results one can confirm a presence of correlation between values of characteristic points of ATND method diagrams and mechanical properties of AG10 alloy. It enables prompt control of the properties of alloy as early as in stage of its preparation. Performed tests have enabled description with equations estimating mechanical properties of Ag10 alloy (from pig saws) on base of characteristic points of ATND method in laboratory conditions, at significance level of
α = 0,05. One has obtained confirmation of a possibility of determination of R0,02, R0,2, Rm, A5, Eśr parameter values and HB 10/1000/30 on base of ATND methodology.
Making analysis of an impact of individual variables change on growth of the mechanical properties it should be noticed, that they impact in diverse way and with various „force” on analyzed dependent variables obtained for the alloy, creating a possibility of a wide range of their changes in practical implementation to control of technological processes connected with preparation of AG10 alloy.
References
[1] Z. Górny, Cast alloys of non-ferrous metals, WNT, Warszawa, 1992 (in Polish)
[2] Cz. Adamczyk, T. Piwowarczyk, Metallurgy and foundry of non-ferrous metals, part I. Al and Mg alloys, Wydawnictwo AGH, Kraków, 1988 (in Polish)
[3] P. Wasilewski, Silumins – modification and its impact on structure and properties, PAN Solidification of metals and alloys, Zeszyt 21, Monografia, Katowice 1993 r.
[4] S. Pietrowski, Silumins, Wydawnictwo Politechniki
Łódzkiej, Łódź, 2001 (in Polish)
[5] J. Pezda, Yield strength of AG10 alloy with use of ATND method , Archives of Foundry vol. 6, No. 18 (1/2) (2006) 197-202 (in Polish)
[6] J. Pezda, T. Ciućka, A. Bialobrzeski, Estimation of AAK9 silumin properties on base of ATND method, Archives of Foundry vol. 3, No. 10 (2003) 105-111 (in Polish)


