ESTIMATING BIOCHEMICAL PARAMETERS OF TEA (
CAMELLIA SINENSIS
(L.))
USING HYPERSPECTRAL TECHNIQUES
Meng Bian a,b,* , Andrew K. Skidmore b, Martin Schlerf b, Yanfang Liu c, Tiejun Wang b
a
School of Remote Sensing and Information Engineering, Wuhan University, 129 LuoYuRoad, Wuhan, 430079, P.R. China - [email protected]
b
Faculty of Geo-Information Science and Earth Observation (ITC), University of Twente, P.O. Box 217, 7500 AE, Enschede, The Netherlands - (skidmore, schlerf, tiejun)@itc.nl
c
School of Resource and Environmental Science, Wuhan University, 129 LuoYuRoad, Wuhan, 430079, P.R. China [email protected]
Working Group, Theme or Special Session: VIII/6: Agriculture, Ecosystems and Bio-Diversity
KEY WORDS: Agriculture, Quality, Hyper spectral, Estimation, Statistics
ABSTRACT:
Tea (Camellia Sinensis (L.)) is an important economic crop and the market price of tea depends largely on its quality. This research aims to explore the potential of hyperspectral remote sensing on predicting the concentration of biochemical components, namely total tea polyphenols, as indicators of tea quality at canopy scale. Experiments were carried out for tea plants growing in the field and greenhouse. Partial least squares regression (PLSR), which has proven to be the one of the most successful empirical approach, was performed to establish the relationship between reflectance and biochemical concentration across six tea varieties in the field. Moreover, a novel integrated approach involving successive projections algorithms as band selection method and neural networks was developed and applied to detect the concentration of total tea polyphenols for one tea variety, in order to explore and model complex nonlinearity relationships between independent (wavebands) and dependent (biochemicals) variables. The good prediction accuracies (r2 > 0.8 and relative RMSEP < 10 %) achieved for tea plants using both linear (partial lease squares regress) and nonlinear (artificial neural networks) modelling approaches in this study demonstrates the feasibility of using airborne and space-borne sensors to cover wide areas of tea plantation for in situ monitoring of tea quality cheaply and rapidly.
1. INTRODUCTION
Tea consumption is rising in recent years, for the special flavour and the possible beneficial effects on human body. Consequently, it has become increasingly important to be able to give reliable estimates of the tea quality (Yan, 2007).
Traditional methods to determine tea quality is mainly handled by tea experts, which may bring inconsistent and subjective results, or based on wet chemical analysis, which is time and labour consuming. Being effective and quantitative, the development of new techniques using hyperspectral remote sensing data has offered possibilities to estimate and monitor vegetation quality in space and time (Knox et al., 2011; Mutanga and Kumar, 2007).
Hyperspectral remote sensing techniques have been developed from a laboratory-based near infrared spectroscopy (NIRS) technique (Curran et al., 2001). The narrow sensitive band range (10 nm or less) makes it possible to detect subtle variations in the reflectance spectra, which are caused by differences in biochemical composition and physiology of vegetation (Davey et al., 2009; Schlerf et al., 2010). In recent years, researchers have extended the technique of reflectance spectroscopy to measure biochemical parameters of vegetation by field spectrometer or airborne or spaceborne sensors, trying to explore the chemical variation of vegetation in a spatial context (Curran, 1989; Schlerf et al., 2010; Skidmore et al., 2010).
Tea polyphenols compose of four main substances as catechins, flavonoids, anthocyanins and phenolic acids, accounting for 20-35% of the total dry matter. It contributes greatly to tea taste and quality. In practice, people only pluck the young tender buds and leaves for producing tea product with high-quality. Compared with older leaves, this part of tea plant contains the optimal ratio of polyphenols and amino acids, which forms the special taste of tea beverage (Mitscher and Dolby 1997).
2. METHODS AND MATERIALS
2.1 Study area and Data sets
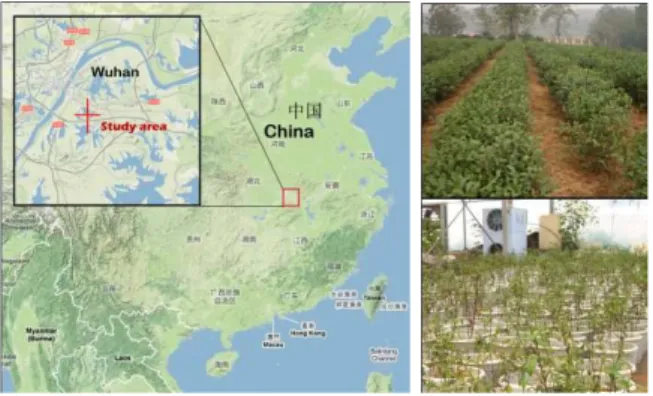
The research was conducted in the Huazhong Agriculture University in Wuhan, China (latitude 30°28'41"N, longitude 114°21'48"E). Part of the data was colleted in the tea garden of the university, while another part of the data was colleted from a greenhouse experiment (Figure 1).
Figure 1. Location of the Huazhong Agriculture University, Wuhan, China (left part of the figure). The right part shows the pictures of the tea garden (top) and the greenhouse setup before
fertilization (bottom) in the university.
Six different varieties of tea including Fuding dabai (FD), Fu yun 6 (FY), E cha 1 (EC), Tai cha 12 (TC), Huang dan (HD) and Mei zhan (MZ) in the tea garden were selected as study objects, to detect whether the modelling methods can be extended to various tea varieties. The tea bushes are so dense that soil background is barely seen from the canopy above. For each tea variety, eight samples were randomly collected. Thus, in a total, 48 (8x6) samples were obtained.
For greenhouse experiment, young plants of Fuding Dabai tea were planted in the greenhouse under controlled conditions. To stretch the chemical variation in the sample, eight soil treatments with different levels of available soil nutrient were designed (Table 1) . Each soil treatment had eight repetitions, and a total of 64 samples (8*8) were collected for the greenhouse experiment.
Nutrient level Nitrogen Phosphorous Potassium
Low level (L) 0.75 0.3 0.3
High level (H) 7.5 3 3
Table 1. Levels of available soil nutrient used for the 8 treatments (unit: g/pot)
2.2 Canopy spectral measurement
On a cloud-free sunny day, canopy reflectance was measured using ASD FieldSpec Pro FR spectrometer (Analytical Spectral Devices). The spectrometer covers a range from 350-2500 nm with sampling intervals of 1.4 nm between 350 nm and 1000 nm, and 2 nm between 1000 nm and 2500 nm. The fiber optic was handheld approximately 10-20 cm above the top of the canopy. To avoid bidirectional reflectance distribution function (BRDF), the pots were rotated 60º after every ninth measurement of the canopy. Before taking a canopy
measurement, the radiance of a white spectralon panel was measured for normalization of the target reflectance.
After the canopy measurements were finished, one bud with three or four leaves of tea bushes in the field were clipped. For tea plants growing in the greenhouse, four or five pots together were regarded as one observation and the tea leaves were plucked, to make sure enough tea leaves for chemical analysis in the laboratory. The weight of the fresh leaves for each sample unit has to been at least 40 grams to satisfy the need for wet chemistry analysis.
2.3 Biochemical Assay
Standard wet chemistry methods were used to determine the concentrations of total polyphenols.The leaves were steamed for three and a half minutes to destroy enzyme activity causing oxidation of the tea (Yamamoto et al. 1997) before drying in an oven at 80°C. Next, the dried leaves were ground using an electric mill. Total tea polyphenols were determined by the ferrous tartrate colorimetry method and spectrometry at 540nm (Iwasa and Torii 1962).
2.4 Spectral pre-processing
The bands regions 350 nm-400 nm, 1350-1420 nm, 1800-1970 nm and 2300-2500 nm displayed high levels of noise due to atmospheric absorption, and were excluded from the data. Before data analysis, the reflected spectra of 64 observations were mean-centered by subtracting their means (Araújo et al., 2001; Cho et al., 2007).
2.5 Partial least square regression (linear regression approach)
Partial least squares regression (PLSR) combines the features of principal component analysis and multiple regressions. It compresses a large number of variables to a few latent variables (PLS factors). It is particularly useful when the size of independent variables is much larger than that of dependent variables. PLSR reduces the problem of over fitting found with the multiple regression (Card et al., 1988; Curran, 1989).
Partial least squares regression was performed to establish the relationship between reflectance and biochemical contents across different tea varieties. The 48 observations in the sample were randomly divided into training data (N=30) and test data (N=18). The training dataset were used to calibrate the partial least squares regression model, and the performance of the model was validated by comparing the model predictions of the test data to the observations. The performances of the PLSR models were assessed by the coefficient of determination (R2) and the root mean square error of prediction (RMSEP, Equation (1)) between predicted and measured concentrations on test data set.
RMSEP= Equation (1)
where n is the number of test data, is the observed value of data point i and is the estimated value based on the model calibrated by training data.
2
1
(
ˆ
)
n
i i i
y
y
n
=
-å
i
y
2.6 A hybrid approach (nonlinear regression approach)
For one tea variety growing in the greenhouse, the neural network approach were applied to build the spectral-chemical relationship using nonlinear regression way. A one hidden layer feed-forward, error-back propagation artificial neural network were adopted in this research, for this algorithm has been frequently and successfully used in previous studies (Skidmore et al. 1997). To find the optimal number of nodes in the hidden layer, we investigated the training and test accuracies using different number of neurons (1-20) in the network (the maximum number was designed no more than 20 to keep the model parsimony and save the calculation time). Levenberg-Marquardt optimization method was used to train the networks in which the parameters of networks were adjusted adaptively (Lera and Pinzolas, 2002; More, 1978) and an earlier stop technique was applied in this study to avoid overtraining (Lin and Chen, 2004).
Before running the neural network model, an effective variable selection method named successive projections algorithm was applied to spectral data (350-2500 nm) after pre-processing. It is a forward selection approach. The purpose of this algorithm is to select wavebands containing minimally redundant information, so that collinearity problems caused by hyperspectral data can be minimized.
The available data (64 samples) were randomly divided into three groups: the training dataset (n = 32, 50% of the sample), the validation dataset (n = 16, 25% of the sample) and the test dataset (n = 16, 25% of the sample). The performance of the ANN model was evaluated by the root mean square error of prediction (RMSEP) between the predicted and measured concentration based on the test dataset (Mutanga et al., 2004). To speed up the training process of neural networks models, the input data of chemical concentrations were normalized between 0 and 1(Mutanga et al., 2004).
3. RESULTS
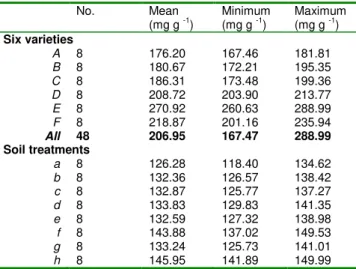
Table 2 shows the measured concentrations for total tea polyphenols by varieties and soil treatments. All values are reported on a dry-matter basis. The range of the chemical data accords with the values which have been previously reported. For tea polyphenols measured for greenhouse experiment , the combination of higher level of nitrogen, phosphorus and potassium resulted in the maximum concentration and vice versa.
No. Mean
(mg g -1)
Minimum (mg g -1)
Maximum (mg g -1)
Six varieties
A 8 176.20 167.46 181.81
B 8 180.67 172.21 195.35
C 8 186.31 173.48 199.36
D 8 208.72 203.90 213.77
E 8 270.92 260.63 288.99
F 8 218.87 201.16 235.94
All 48 206.95 167.47 288.99 Soil treatments
a 8 126.28 118.40 134.62
b 8 132.36 126.57 138.42
c 8 132.87 125.77 137.27
d 8 133.83 129.83 141.35
e 8 132.59 127.32 138.98
f 8 143.88 137.02 149.53
g 8 133.24 125.73 141.01
h 8 145.95 141.89 149.99
All 64 135.13 129.07 141.40
Table 2. Descriptive statistics of the total tea polyphenols measured in the laboratory
For different tea varieties, using partial least squares regression, observed versus predicted concentrations of tea polyphenols for both training (N=30) and test (N=18) data are shown in Figure 2. The satisfactory accuracy of prediction was obtained at canopy level : based on the independent data set, total tea polyphenols were estimated with high r2 values (> 0.8) and low RMSEP values (RMSEP = 13.68 mg g-1 , RMSEP/mean = 6.63%).
Figure 2. Scatter plots describing the measured and predicted total tea polyphenols for training and test using canopy spectra
(mean centred). r2 is coefficient of determination between model predictions and measured chemical concentrations on test
data set, and RMSEP is the root mean square error of test data prediction.
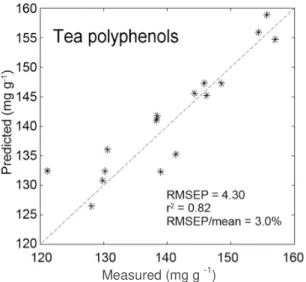
Figure 3 presents relationships between the predicted and measured biochemical concentrations using a hybrid of neural networks and SPA variable selections (SPA-ANN): on test data set, using the wavebands selected by the successive projections algorithm, the neural networks with optimal settings yielded coefficient of determination r2 of 0.82, for the prediction of total tea polyphenols in the greenhouse experiment, with a root mean square error of 4.30 mg g-1 (3.0% of the mean).
Measured (mg g -1)
Figure 3. Relationships between the predicted and measured total tea polyphenols using a hybrid of neural networks and SPA variable selections, according to the test dataset (n=16).
Figure 4. Choice of the optimal number of wavelength (circled positions) by successive projections algorithm for the prediction of tea polyphenols. The criterion is to find a minimum number
of wavelengths for which the errors is not significantly larger than the lowest one. This is determined by an F-test.
4. DISCUSSION AND CONCLUSION
The utility of reflectance spectroscopy for predicting tea quality-related biochemicals at canopy level is demonstrated in this paper (figure 2 and 3). In previous studies, some phenolic substances of tea, including total tea polyphenols, catechins, epigallocatechin gallate (EGCG) and epicatechin (EC) have been successfully estimated using near infrared spectra for dried tea powders and dried leaves (Chen et al., 2008; Luypaert et al., 2003). Our results revealed that foliar chemical concentrations of tea (total tea polyphenols) can be retrieved not only from the spectra of dried powders, but also for living tea plant material.
Prediction accuracy decreased using canopy spectra, compared to reported results using powder spectra. The variability of spectra reflectance of dried tea powders are mainly correlated with the amounts of chemical compounds, as the effect of absorption by water is reduced considerably and the effect of leaf cell structure could be impaired (Curran et al., 2001; Kokaly and Clark, 1999). At the canopy level, reflectance variability is due to additional factors such as LAI (leaf area index), foliar water content and canopy architecture (Gitelson
et al., 2003; Kokaly et al., 2009). This may be the main reason of relatively lower prediction accuracy for tea plants.
Our study showed that partial least squares regression is an effective method to retrieve biochemical parameters from canopy spectral reflectance of tea plant (figure 2). Predictive models based on partial least squares regression produced satisfactory accuracy. This results is consistent with those of Darvishzadeh et al. (2008) who in a field experimental study on green grass reported a better predictive performance of PLS regression analysis compared with for biophysical and biochemical parameters estimation. PLS has the potential to exploit the rich information content of hyperspectral data.
It also demonstrated that the quality of tea can be predicted with satisfactory accuracy from the hyperspectral data at canopy level, using artificial neural networks in combination with successive projections algorithm (figure 3). Based on the optimal wavelengths selected by the successive projections algorithm, neural networks worked well for the prediction of total tea polyphenols using the canopy spectra of tea plants: the relative root mean square errors (RMSEP/mean) were less than 10% on an independent test dataset. The goal of SPA solution is to find a small representative set of spectral variables with an emphasis on the minimization of collinearity (figure 4). Our results confirm recent studies that have successfully applied the successive projections algorithm for the predicting biochemical concentrations in vegetation science (Liu and He, 2009).
Considering that data collected in the field or in a greenhouse were under natural atmospheric and illumination conditions, this research has demonstrated that there is potential to use reflectance spectra to predict in situ tea quality in space and time. As our experiment was carried out at canopy level using field spectrometer, when using airborne or spaceborne hyperspectral remote sensing, the retrieval of biochemical parameters for tea plants may be more difficult, as biochemical absorption features may be affected by complex environmental factors such as atmospheric and topographic effects .
The following conclusions were drawn from this study:
(1) Our results suggest that biochemical components (total tea polyphenols) of tea quality can be quantitatively estimated from canopy spectroscopy. The canopy spectra may have the potential to predict the foliar biochemical concentration of tea. (2) When up-scaling to canopy level, predicting total tea polyphenols was achieved with lower accuracy compared to reported results in literatures in which dried or ground powder spectra have been used.
(3) partial least squares regression is able to locate surrogate spectral features for estimating the concentration of fresh leaf biochemicals of tea.
(4) A novel integrated approach proposed in our study, involving a forward selection algorithm (successive projections algorithm) to choose the optimal number of wavelengths and neural networks can be used for a better simulation of nonlinear relationship between biochemical concentration and spectral signatures of tea canopy.
References:
Araújo, M.C.U. et al., 2001. The successive projections algorithm for variable selection in spectroscopic multicomponent analysis. Chemometrics and Intelligent Laboratory Systems, 57(2), pp. 65-73. Card, D.H., Peterson, D.L., Matson, P.A. and Aber, J.D., 1988.
Prediction of leaf chemistry by the use of visible and near infrared reflectance spectroscopy. Remote Sensing of Environment, 26(2), pp. 123-147.
Cho, M.A., Skidmore, A., Corsi, F., van Wieren, S.E. and Sobhan, I., 2007. Estimation of green grass/herb biomass from airborne hyperspectral imagery using spectral indices and partial least squares regression. International Journal of Applied Earth Observation and Geoinformation, 9(4), pp. 414-424.
Curran, P.J., 1989. Remote sensing of foliar chemistry. Remote Sensing of Environment, 30(3), pp. 271-278.
Curran, P.J., Dungan, J.L. and Peterson, D.L., 2001. Estimating the foliar biochemical concentration of leaves with reflectance spectrometry: Testing the Kokaly and Clark methodologies. Remote Sensing of Environment, 76(3), pp. 349-359.
Darvishzadeh, R. et al., 2008. LAI and chlorophyll estimation for a heterogeneous grassland using hyperspectral measurements. ISPRS Journal of Photogrammetry and Remote Sensing, 63(4), pp. 409-426.
Davey, M.W. et al., 2009. Application of visible and near-infrared reflectance spectroscopy (Vis/NIRS) to determine carotenoid contents in banana (Musa spp.) fruit pulp. Journal of Agricultural and Food Chemistry, 57(5), pp. 1742-1751.
Gitelson, A., Gritz, Y. and Merzlyak, M., 2003. Relationships between leaf chlorophyll content and spectral reflectance and algorithms for non-destructive chlorophyll assessment in higher plant leaves. Journal of Plant Physiology, 160(3), pp. 271-282.
Knox, N.M. et al., 2011. Dry season mapping of savanna forage quality, using the hyperspectral Carnegie Airborne Observatory sensor. Remote Sensing of Environment, pp.
Kokaly, R.F., Asner, G.P., Ollinger, S.V., Martin, M.E. and Wessman, C.A., 2009. Characterizing canopy biochemistry from imaging spectroscopy and its application to ecosystem studies. Remote Sensing of Environment, 113(SUPPL. 1), pp. S78-S91.
Lera, G. and Pinzolas, M., 2002. Neighborhood based Levenberg-Marquardt algorithm for neural network training. Neural Networks, IEEE Transactions on, 13(5), pp. 1200-1203.
Lin, G.F. and Chen, L.H., 2004. A non-linear rainfall-runoff model using radial basis function network. Journal of Hydrology, 289(1-4), pp. 1-8.
Liu, F. and He, Y., 2009. Application of successive projections algorithm for variable selection to determine organic acids of plum vinegar. Food Chemistry, 115(4), pp. 1430-1436.
More, J., 1978. The Levenberg-Marquardt algorithm: implementation and theory. Numerical analysis, 630, pp. 105-116.
Mutanga, O. and Kumar, L., 2007. Estimating and mapping grass phosphorus concentration in an African savanna using hyperspectral image data. International Journal of Remote Sensing, 28(21), pp. 4897-4911.
Mutanga, O., Skidmore, A.K. and Prins, H.H.T., 2004. Predicting in situ pasture quality in the Kruger National Park, South Africa, using continuum-removed absorption features. Remote Sensing of Environment, 89(3), pp. 393-408.
Schlerf, M. et al., 2010. Retrieval of chlorophyll and nitrogen in Norway spruce (Picea abies L. Karst.) using imaging spectroscopy. International Journal of Applied Earth Observation and Geoinformation, 12(1), pp. 17-26. Skidmore, A.K. et al., 2010. Forage quality of savannas -
Simultaneously mapping foliar protein and polyphenols for trees and grass using hyperspectral imagery. Remote Sensing of Environment, 114(1), pp. 64-72.
Yan, S.H., 2007. NIR evaluation of the quality of tea and its market price. Spectroscopy Europe, 19(2), pp. 16-19.
Acknowledgements