www.adv-radio-sci.net/11/319/2013/ doi:10.5194/ars-11-319-2013
© Author(s) 2013. CC Attribution 3.0 License.
Radio Science
Investigation of horizontal structures at mesospheric altitudes
using coherent radar imaging
S. Sommer, G. Stober, C. Schult, M. Zecha, and R. Latteck
Leibniz Institute of Atmospheric Physics at the Rostock University, Schloss-Str. 6, 18225 K¨uhlungsborn, Germany
Correspondence to:S. Sommer ([email protected])
Abstract. The Middle Atmosphere Alomar Radar Sys-tem (MAARSY) in Northern Norway (69.30◦N, 16.04◦E) was used to perform interferometric observations of Polar Mesosperic Summer Echoes (PMSE) in June 2012. Coher-ent Radar Imaging (CRI) using Capon’s method was applied allowing a high spatial resolution. The algorithm was vali-dated by simulation and trajectories of meteor head echoes. Both data sets show a good correspondence with the algo-rithm. Using this algorithm, the aspect sensitivity of PMSE was analysed in a case study, making use of the capability of CRI to resolve the pattern within the beam volume. No cor-rection of the beam pattern was made yet. It was found in this case study, that no large variations in the scattering width and the scattering center occured apart from a very short period of time at the upper edge of the PMSE.
1 Introduction
Polar Mesospheric Summer Echoes (PMSE) are a phe-nomenon in the middle atmosphere at polar latitudes, where VHF radar waves are backscattered at mesospheric heights (e.g. Balsley et al., 1979; Hoppe et al., 1988). The overall mechanism of the formation of these PMSE is understood and widely accepted. ’Mesospheric neutral air turbulence in combination with a significantly reduced electron diffusivity due to the presence of heavy charged ice aerosol particles (radii∼5–50 nm) leads to the creation of structures at spa-tial scales significantly smaller than the inner scale of the neutral gas turbulent velocity field itself’ (Rapp and L¨ubken, 2004) and therefore scales of the radar’s Bragg wavelength. The inner structure of PMSE is still unknown but a field of recent interest (Chilson et al., 2002; Chen et al., 2008). The aspect sensitivity of PMSE is an indicator of the scattering mechanism and describes the backscattered power in depen-dence on the off-zenith angle of the radar beam. If the power
decreases fast with increasing off-zenith angle, the aspect sensitivity is high and it is unlikely an homogenous scatter-ing mechanism and vice versa (R¨ottger and Vincent, 1978; Hocking et al., 1986). It is essential to understand the aspect sensitivity to use PMSE as a tracer of atmospheric dynam-ics (Stober et al., 2012). In order to resolve the still unknown inner structures of PMSE, the Middle Atmosphere Alomar Radar System (MAARSY) on the Norwegian Island Andøya started its operation in 2010. MAARSY has a beam width of 3.6◦at 3 dB and beam steering capabilities with off-zenith angles up to 30◦without generating severe grating lobes. Fur-thermore the MAARSY antenna can be divided into several sub-arrays to perform interferometric analysis. These capa-bilities can be used to apply coherent radar imaging (CRI) and to get a deeper insight into the inner structures of PMSE. Coherent Radar Imaging was introduced and established by Kudeki and S¨ur¨uc¨u (1991) and Woodman (1997) in atmo-spheric physics and used by e.g. Yu et al. (2001); Chilson et al. (2002); Chen et al. (2004, 2008) to investigate PMSE.
2 Experimental setup and calculation
2.1 Experimental setup
Rx1
Rx2
Rx3
Rx4
Rx5
Rx6
Rx7
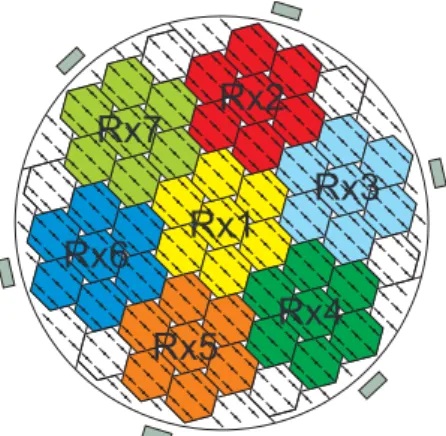
Fig. 1. Sketch of MAARSY. The array is divided into 55 sub-arrays of hexagonal shape. Seven of contiguous sub-sub-arrays can be combined to a larger structure called an anemone and the seven anemones are colour-coded in the figure above. The boxes around the antenna field are the equipment buildings.
allowing the application of CRI. The sampling range was 75– 111 km. Using a pulse length of 1 µs, the resulting range reso-lution is 150 m. The pulse repetition frequency was 1250 Hz, a 16 bit complementary coded pulse was transmitted and the received data was stored in 256 points complex time series for each sub-array.
2.2 Used method
The data was analysed by using Capon’s method of CRI. Capon’s method was found to be better than Fourier’s method and faster than the Maximum Entropy method (Yu et al., 2000). The imaging method is based on the cross spectral function between the different receiversiandj and denoted byRij. Following Palmer et al. (1998), one can derive the cross correlation matrix in the time domain as
R(t )=
R11(t ) . . . R1n(t ) R21(t ) . . . R2n(t )
..
. ...
Rn1(t ) . . . Rnn(t )
(1)
The brightness as an indication for the backscattered power of Capon’s method is given by
Bc(t,k)= 1
e†R−1e (2)
with
e=
ejk·D1 ejk·D2 ejk·D3
.. . ejk·Dn
(3)
wherekdenotes the wavenumber vector andDithe distance vector of the receiver i with respect to the origin (Palmer
et al., 1998),t the time, e† represents the conjugate
trans-pose ofeandR−1the inverse ofR.
The algorithm was applied after coherent integration of a time series containing 256 data points. The brightness was mapped on a rectangular grid with a meridional and zonal range of−4◦to 4◦or−6◦to 6◦for the simulation, and−8◦to 8◦for the meteor head echo. The step width is 0.1◦. As an initial validation and report of CRI with the MAARSY radar, however, we do not consider the beam weighting effect on the brightness distribution. The beam weighting effect may not be ignored for some circumstances (e.g. Chen et al., 2011; Chen and Furumoto, 2011, 2013).
3 Verification
3.1 Simulation
Assuming a point target, the backscattered signal can be sim-ulated by a monochromatic wave, which can be written for one sub-array as
si(t )=A·ej (2πf t+ϕi)+N (t ) (4) whereAis the amplitude,f the transmitted radar frequency, t the time andϕ the phase. To simulate internal and exter-nal disturbances, normally distributed random noise with the standard deviationσ and the amplitudeN is added for the real and imaginary part independently. This was done for every sub-array for a single target and after that different signal locations were superimposed by adding the different signals of different targets. These signals were used to val-idate the CRI algorithm. For this simulation, the MAARSY configuration was used, withf =53.5 MHz and the centers of two adjoining anemones 28 m apart. The amplitude was set toA=1. Furthermore, Gaussian noise withσ=0.1 was added . The results for three point targets are shown in Fig. 2 with different zenith angles. The left figure shows an off-zenith angle of 1◦. The center of the brightness lies between the scatterers and the single centers can not be separated from each other. The triangular shape is preserved. The right figure shows a simulation with off-zenith angles of 2.5◦. All three targets are separated as centers of brightness. Still, some sig-nal is received from the zenith, where no scatterer is located. A more complex distribution of point scatterers is shown in Fig. 3. In contrast to Yu et al. (2000), we assume dif-ferent centers of scattering. The scatterers are arranged in a sine-shaped way. When we decrease the signal to noise ratio (SNR), the less the shape of the point scatterers is preserved. The SNR was calculated as SNR=A/√2σ
2
West − East [°]
South − North [°]
Θ= 1.00°
−4 −2 0 2 4
−4
−2
0
2
4
Brightness [dB]
−20 −15 −10 −5 0
West − East [°]
South − North [
°
]
Θ= 2.50°
−4 −2 0 2 4
−4
−2
0
2
4
Fig. 2. Simulation of signals with known positions. The three x mark the position of the signal from point targets. Left: Three
sig-nals with off-zenith angles of 1◦are superimposed, resulting in one
center with the highest brightness in the middle. Right: Three
sig-nals with off zenith angles of 2.5◦are superimposed, resulting in
three separated centers of brightness.
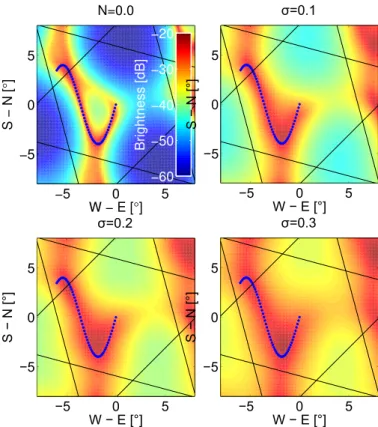
off-zenith angles. The multiple phase cycles are introduced due to the given baseline length. In Fig. 3, the ambiguity is shown by black lines and determined by the baselines of the used sub-arrays. Even with no noise added, the pattern can-not be reproduced perfectly by the algorithm.
3.2 Verification using meteor head echoes
To verify the algorithm not only by simulated but real data, meteor head echoes were used. These echoes result from the plasma around the meteor when it enters the atmosphere. This is a good target due to the small size of the meteors (Westman et al., 2004). An event with two meteors entering the atmosphere with almost perpendicular trajectories were used to validate the CRI algorithm. The trajectories of the meteors are represented in Fig. 4. For this experiment, a pulse length of 49 µs was used. The range was oversampled with 900 m. For the calculation of the brightness, a set containing 7 s of data were coherently integrated. The result is shown in Fig. 5 where the brightness distribution for five different heights are shown. The brightness is spread not only horizon-tally but vertically resulting from the oversampling, but the center of the brightness matches the trajectories. The algo-rithm is capable of resolving complex structures in real data.
4 Aspect sensitivity using CRI
Having validated our CRI algorithm, we performed a PMSE observation in summer 2012 to investigate the aspect sen-sitivity of this phenomenon for an arbitrarily choosen time. See Sect. 2.1 for the experimental setup. Following Chilson et al. (2002), the brightness distribution in the zenith beam can be regarded as an indicator of the aspect sensitivity dur-ing periods when the PMSE are uniform within the beam vol-ume which corresponds to horizontal scales of approximately
−5 0 5
−5 0 5
W − E [°]
S − N [
°
]
N=0.0
Brightness [dB]
−60 −50 −40 −30 −20
−5 0 5
−5 0 5
W − E [°]
S − N [°]
σ=0.1
−5 0 5
−5 0 5
W − E [°]
S − N [°]
σ=0.2
−5 0 5
−5 0 5
W − E [°]
S − N [°]
σ=0.3
Fig. 3.Simulation of signals with known positions. The dots mark the position of the signal generated by point targets. The black lines indicate the ambiguity limit due to the antenna configuration. Upper left: No noise added reproduce the pattern of the scatterers. Upper right: A SNR of 50 preserves the shape of the scatterer distribution. Lower left: A SNR of 12.5 leads to a broader distribution of bright-ness. Lower right: A SNR of 5.6 leads to a smeared distribution of brightness.
5.7 km at a height of 90 km. Otherwise, the maximum of the brightness must be considered as the mean angle of arrival. The same approach was made for MAARSY. The difference made is that Chilson et al. (2002) applied a two-dimensional Gaussian fit, while we fitted the brightness meridional and zonal with a one-dimensional Gaussian fit of the form
f (x)=a·exp −1 2
x −µ
σ 2!
(5)
−5 0 5 −8
−6 −4 −2 0 2 4 6 8
Θx / °
Θ y
/
°
RA: 229.0° DEC: 19.0° Velocity: 40.2km/s Height: 102.2 − 92.6km
Date: 13.12.2010 Time: 7:52:41.04
Height / km
92 94 96 98 100 102 104 106
RA: 148.3° DEC: 18.8° Velocity: 67.0km/s Height: 106.4 − 100.2km
Date: 13.12.2010 Time: 7:52:48.61
Fig. 4.Two meteors in the zenith beam of MAARSY. These trajec-tories were calculated by using interferometry. Both meteors enter the atmosphere 7 s apart and have almost perpendicular trajectories.
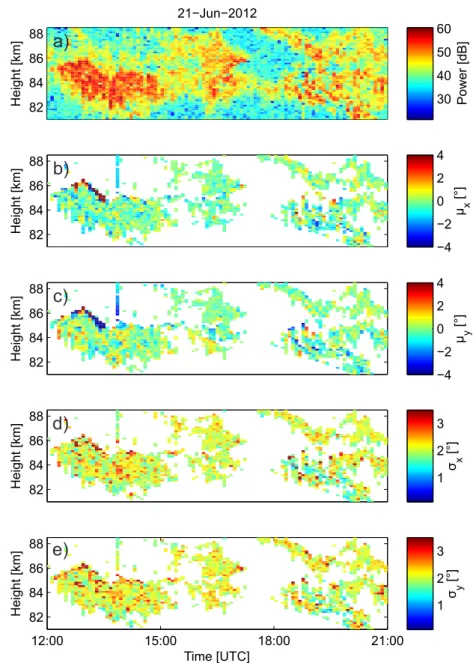
The top Fig. 6a shows the range-time power plot of the used time series to give an overview over the PMSE activ-ity during this time. Figures 6b and 6c show the deviation of the fit’s maximum in meridional and zonal direction, re-spectively. Figures 6d and 6e show the width of the fit in meridional and zonal directions. The width of the Gaussian function varies betweenσ=1◦toσ=3◦. This corresponds to a full width at half maximum (FWHM) of FWHM = 2.4◦to FWHM = 7◦. Compared with the radar beam width of FWHMbeam=3.6◦we used, the received pattern varies
be-tween a broadening of the beam pattern and a smaller re-ceived pattern, maybe due to aspect sensitivity. Most returned signals had a width ofσ <2.2◦. Layers described by Chilson et al. (2002) are not found in this case study, except at about 13:00 UTC, where large deviation over 4◦were found at the upper edge of the PMSE, but no layer shaped broadening in the returned width was found in this time series. It appears that in the lower part of the PMSE the aspect sensitivity is slightly increased compared to the upper part of the PMSE. This is similar to that observed by Chilson et al. (2002).
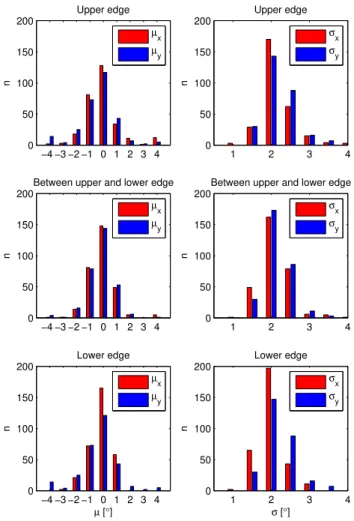
To inspect the altitudinal variation of aspect sensitivity in more detail, the PMSE was divided into three different parts for each time, where the upper and lower edge are defined by the two lowest and highest ranges of the PMSE and a part between those regions. The variations of the deviations and width for different parts of the PMSE are shown in Fig. 7. The left side shows the deviations of the maximum from the zenith while the right side shows the width of the Gaussian fit. In order to get an overview over the distribution of the scattering center, the expectation values ofµx,µy,σx and σxare shown in Table 1. The maximum of the brightness is mostly centered around the zenith with no large variations over the different parts of the PMSE. The slight negative
de-Fig. 5.Meteor trajectories of two meteors. The black lines indicate the center of the meteor trail, the light grey lines indicate the upper and lower limits of the meteor trail due to the used pulse length of 49 µs. The coloured rectangles represent the brightness in selected height gates. The trajectories and the brightness correspond well.
viation of the scattering centers can result from the PMSE, which might be gently tilted or, although a phase calibration has been made, due to small phase instabilities between the receivers; we need more observations and data to verify this in the future. The width of the Gaussian fit does not vary much over the three different parts of the PMSE, although a slight decrease of aspect sensitivity with height was found in the width of the Gaussian fit in the zonal direction. On the other hand, in the width in meridional direction, no signifi-cant change in width was found. The decreasing aspect sen-sitivity in upper parts of the PMSE was also found by Zecha et al. (2001), who used the Alomar SOUSY VHF radar. Also, Hoppe et al. (1990) measured the aspect sensitivity with the SOUSY VHF radar and they found values of aspect sensi-tivity between 2◦and 10◦and a tendency of decreasing aspect sensitivity with height.
5 Summary and conclusions
A CRI algorithm using Capon’s method was applied on PMSE measurements conducted with MAARSY and the al-gorithm was validated by both synthetic data and meteor head echoes. It was found that the CRI algorithm corresponds well with both the simulation and the trajectories of the me-teor head echoes.
82 84 86 88
21−Jun−2012
Height [km] 30 Power [dB]
40 50 60
82 84 86 88
Height [km]
µ x
[°]
−4 −2 0 2 4
82 84 86 88
Height [km]
µ y
[°]
−4 −2 0 2 4
82 84 86 88
Height [km]
σ x
[°]
1 2 3
12:00 15:00 18:00 21:00
82 84 86 88
Time [UTC]
Height [km]
σ y
[°]
1 2 3
a)
b)
c)
d)
e)
Fig. 6.Range-time pseudocolor plot of:(a)Power plot of the time series.(b) Deviation of the maximal brightness from the zenith in
meridional direction.(c)Deviation of the maximal brightness from the zenith in zonal direction.(d)Width of the Gaussian fit in meridional
direction.(e)Width of Gaussian fit in zonal direction.
radar beam. Is the PMSE not uniform within the radar beam and the pattern is too small to be resolved by the algorithm, it can only be seen as a mean angle of arrival.
In the dataset used, no layer shaped structures were found, but as a solitary event, in the upper boundary of the PMSE a large deviation from the zenith in both meridional and zonal direction was observed around 13:00 UTC.
Statistical estimates show that the scattering centers dif-fer slightly from the zenith. The slight negative bias could be related to tilted structures in the echo layer, or results from small errors in the phase calibration of the receiving chan-nels. On the other hand, statistical estimates show that the
Table 1.Expectation values ofµx,µy,σxandσx. The error is the
σstandard deviation. The derivation of the scatter centers from the
zenith is around zero with a slight negative bias and the width of the
brightness distribution is about 2◦.
Part of PMSE µx[◦] µy[◦] σx[◦] σy[◦]
Upper edge −0.1±1.3 −0.4±1.4 2.2±0.6 2.3±0.7
Part between −0.1±1.0 −0.2±1.0 2.1±0.5 2.2±0.5
−4 −3 −2 −1 0 1 2 3 4 0
50 100 150 200
n
Upper edge
µx µy
−4 −3 −2 −1 0 1 2 3 4 0
50 100 150 200
µ [°]
n
Lower edge
µx µy −4 −3 −2 −1 0 1 2 3 4 0
50 100 150 200
n
Between upper and lower edge
µx µy
1 2 3 4
0 50 100 150 200
n
Upper edge
σx σy
1 2 3 4
0 50 100 150 200
σ [°]
n
Lower edge
σx σy
1 2 3 4
0 50 100 150 200
n
Between upper and lower edge
σx σy
Fig. 7.Bar plots of the deviations from the zenith (left) and the width of the Gaussian fit (right) for different parts of the PMSE. The PMSE was divided in three parts, where the upper edge are the two uppermost heights and the two lowest heights are the lower edge. The part between both regions are pooled as one part. The histograms are fitted with a Gaussian fit (solid line) to get the mean
values ofµx,µy,σx, andσyin the different parts of the PMSE.
aspect sensitivity, indicated by the width of the brightness distribution, did not vary significantly from the lower to up-per parts of the PMSE layer. Only a slight decrease in aspect sensitivity with height was found along the zonal cut.
Further data sets will be analysed in the future to demon-strate the capabilities of CRI with the MAARSY radar, and the beam weighting effects may be taken into account for some circumstances.
Acknowledgements. We like to thank to the Andya Rocket Range
for the support while building and operating the MAARSY radar and the IAP personel for keeping the radar running. The radar de-velopment was build under grant 01 LP 0802A of Bundesmisterium f¨ur Bildung und Forschung. We thank the reviewers for the help-ful comments on this paper. Topical Editor Matthias F¨orster thanks Jenn-Shyong Chen and an anonymous reviewer for their help in evaluating this paper.
References
Balsley, B., Ecklund, W., Carter, D., and Johnston, P.: Poker Flat MST Radar, 1st Results, Geophys. Res. Lett., 6, 921–924, 1979. Chau, J. L., Renkwitz, T., Stober, G., and Latteck, R.: MAARSY multiple receiver phase calibration using radio sources, JASTP, doi:10.1016/j.jastp.2013.04.004, 2013.
Chen, J.-S. and Furumoto, J.: A novel approach to mitigation of radar beam weighting effect on coherent radar imaging using VHF atmospheric radar, IEEE Trans. Geosci. Remote Sens., 49, 3059–3070, doi:10.1109/TGRS.2011.2119374, 2011.
Chen, J.-S. and Furumoto, J.: Measurement of atmospheric aspect sensitivity using coherent radar imaging after mitigation of radar beam weighting effect, J. Atmos. Oceanic Technol., 30, 245–259, doi:10.1175/JTECH-D-12-00007.1, 2013.
Chen, J.-S., Hoffmann, P., Zecha, M., and R¨ottger, J.: On the rela-tionship between aspect sensitivity, wave activity, and multiple scattering centers of mesosphere summer echoes: a case study using coherent radar imaging, Annales Geophysicae, 22, 807– 817, 2004.
Chen, J.-S., Hoffmann, P., Zecha, M., and Hsieh, C.-H.: Coherent radar imaging of mesosphere summer echoes: Influence of radar beam pattern and tilted structures on atmospheric echo center, Radio Sci., 43, RS1002, 2008.
Chen, J.-S., Chen, C.-H., and Furu, J.: Radar beam- and range-weighting effects on three-dimensional radar imaging for the at-mosphere, Radio Sci., 46, RS6014, 2011.
Chilson, P. B., Yu, T.-Y., Palmer, R. D., and Kirkwood, S.: Aspect sensitivity measurements of polar mesosphere summer echoes using coherent radar imaging, Annales Geophysicae, 20, 213– 223, 2002.
Hocking, W., Ruster, R., and Czechowsky, P.: Absolute reflectiv-ities and aspect sensitivreflectiv-ities of VHF radiowave scatterers mea-sured with the SOUSY radar, J. Atmos. Terr. Phys., 48, 131–144, doi:10.1016/0021-9169(86)90077-2, 1986.
Hoppe, U., Hall, C., and R¨ottger, J.: 1st observations of summer polar mesospheric backscatter with a 224 MHZ radar, Geophys. Res. Lett., 15, 28–31, 1988.
Hoppe, U.-P., Fritts, D., Reid, I., Czechowsky, P., Hall, C., and Hansen, T.: Multiple-frequency studies of the high-latitude summer mesosphere : implications for scattering processes, Journal of Atmospheric and Terrestrial Physics, 52, 907–926, doi:10.1016/0021-9169(90)90024-H, http://www.sciencedirect. com/science/article/pii/002191699090024H, 1990.
Kudeki, E. and S¨ur¨uc¨u, F.: Radar interferometric imaging of field-aligned plasma irregularities in the equatorial electrojet, Geo-phys. Res. Lett, 18, 41–44, doi:10.1029/90GL02603, 1991. Latteck, R., Singer, W., Rapp, M., Vandepeer, B., Renkwitz, T.,
Zecha, M., and Stober, G.: MAARSY: The new MST radar on Andoya-System description and first results, Radio Sci., 47, 2012.
Palmer, R., Gopalam, S., Yu, T., and Fukao, S.: Coherent radar imaging using Capon’s method, Radio Sci., 33, 1585–1598, 1998.
Rapp, M. and L¨ubken, F.-J.: Polar mesosphere summer echoes (PMSE): review of observations and current understanding, At-mos. Chem. Phys., 4, 2601–2633, 2004,
http://www.atmos-chem-phys.net/4/2601/2004/.
Geo-phys. Res. Lett., 5, 917–920, 1978.
Stober, G., Latteck, R., Rapp, M., Singer, W., and Zecha, M.: MAARSY-The new MST radar on Andøya: First results of spaced antenna and Doppler measurements of atmospheric winds in the troposphere and mesosphere using a partial array, ARS, 291–298, doi:10.5194/ars-10-291-2012, 2012.
Westman, A., Wannberg, G., and Pellinen-Wannberg, A.: Meteor head echo altitude distributions and the height cutoff effect stud-ied with the EISCAT HPLA UHF and VHF radars, Ann. Geo-phys., 22, 1575–1584, 2004,
http://www.ann-geophys.net/22/1575/2004/.
Woodman, R.: Coherent radar imaging: Signal processing and sta-tistical properties, Radio Sci., 32, 2373–2391, 1997.
Yu, T., Palmer, R., and Hysell, D.: A simulation study of coherent radar imaging, Radio Sci., 35, 1129–1141, 2000.
Yu, T.-Y., Palmer, R. D., and Chilson, P.: An investigation of scat-tering mechanisms and dynamics on PMSE using coherent radar imaging, J. Atmos. Solar-Terres. Phys., 63, 1797–1810, 2001. Zecha, M., R¨ottger, J., Singer, W., Hoffmann, P., and Keuer, D.: