California dragonfly and damselfly (Odonata) database:
temporal and spatial distribution of species records
collected over the past century
Joan E. Ball-Damerow1, Peter T. Oboyski2, Vincent H. Resh1
1 Department of Environmental Science, Policy & Management, University of California, Berkeley, California 94720-3114, USA 2 Essig Museum of Entomology, University of California, Berkeley, California, USA
Corresponding author:Joan E. Ball-Damerow ([email protected])
Academic editor:L. Penev | Received 20 August 2014 | Accepted 24 January 2015 | Published 16 February 2015
http://zoobank.org/EC156D5D-B81D-4B31-B9AB-C2CF02B57561
Citation: Ball-Damerow JE, Oboyski PT, Resh VH (2015) California dragonly and damselly (Odonata) database: temporal and spatial distribution of species records collected over the past century. ZooKeys 482: 67–89. doi: 10.3897/ zookeys.482.8453
Abstract
he recently completed Odonata database for California consists of specimen records from the major entomology collections of the state, large Odonata collections outside of the state, previous literature, historical and recent ield surveys, and from enthusiast group observations. he database includes 32,025 total records and 19,000 unique records for 106 species of dragonlies and damsellies, with records span-ning 1879–2013. Records have been geographically referenced using the point-radius method to assign coordinates and an uncertainty radius to specimen locations. In addition to describing techniques used in data acquisition, georeferencing, and quality control, we present assessments of the temporal, spatial, and taxonomic distribution of records. We use this information to identify biases in the data, and to determine changes in species prevalence, latitudinal ranges, and elevation ranges when comparing records before 1976 and after 1979. he average latitude of where records occurred increased by 78 km over these time periods. While average elevation did not change signiicantly, the average minimum elevation across spe-cies declined by 108 m. Odonata distribution may be generally shifting northwards as temperature warms and to lower minimum elevations in response to increased summer water availability in low-elevation agricultural regions. he unexpected decline in elevation may also be partially the result of bias in recent collections towards centers of human population, which tend to occur at lower elevations. his study em-phasizes the need to address temporal, spatial, and taxonomic biases in museum and observational records in order to produce reliable conclusions from such data.
http://zookeys.pensoft.net
Copyright Joan E. Ball-Damerow et al. This is an open access article distributed under the terms of the Creative Commons Attribution License (CC BY 4.0), which permits unrestricted use, distribution, and reproduction in any medium, provided the original author and source are credited.
Keywords
Museum specimens, observational records, bias, change in distribution, species richness, digital catalog
Introduction
Natural history specimens are arguably the most valuable records of the historical oc-currence of organisms. In contrast to scientiic publications, which usually are most relevant for the irst ten years following their appearance, information from specimens becomes more valuable with age (Winker 2004). Museum records that are backed by voucher specimens also allow researchers to verify species identiication. In addition to their traditional use in taxonomy and biogeography studies, specimens can provide a wealth of information concerning changes in morphology, genetic and biochemical composition, and the distribution and diversity of organisms over time (Cao et al. 2013, Graham et al. 2004, O’Connell et al. 2004, Pyke and Ehrlich 2010, Winker 2004). However, large-scale applied and ecological studies using museum specimens are ex-ceedingly diicult to conduct without a database of existing records. While the develop-ment of digital catalogs of natural history specimens began in 1970, by 2010 only ~ 3% of total records worldwide were estimated to be available online through the mobiliza-tion eforts of the Global Biodiversity Informamobiliza-tion Facility (GBIF 2014; Ariño 2010).
Many vertebrate collections have complete or near-complete databases of their specimens, along with ancillary information such as photos, ield notes, and published manuscripts associated with particular specimens (e.g. Guralnick and Constable 2010, Pyke and Ehrlich 2010). However, databases for insects and other invertebrates have lagged far behind vertebrates (Schuh et al. 2010). his is largely because the task of databasing information from millions of small specimens, which represent the most diverse animal group on the planet, is enormous. In addition, these collections often lack the necessary resources to meet desired specimen curation because insects tend to undergo continual taxonomic revision (DeWalt et al. 2005). herefore, many have considered digitization of huge collections of insects with tiny and highly abbreviated labels to be impossible (Schuh et al. 2010). However, in response to a growing need for specimen data in research, more insect and other large natural history collections are in the process of undergoing or beginning digitization (e.g. Abbott 2005, Favret and DeWalt 2002, Graham et al. 2004, Hill et al. 2012, Schuh et al. 2010). In the United States, the National Science Foundation (2014) has made such eforts possible through funding initiatives, including the Advancing Digitization of Biodiversity Col-lections (ADBC) and the hematic ColCol-lections Network (TCN).
the temporal and spatial distribution of records (Pyke and Ehrlich 2010). For example, collectors have often focused collecting eforts on rare, large, and charismatic species while neglecting more common or cosmopolitan species (Winker 2004). Collections also tend to occur along roads, railroad tracks, or near centers of human population (Gra-ham et al. 2004, Pyke and Ehrlich 2010). here is usually a strong correlation between collection efort, or number of records, and the number of species documented for a given time period or region (Fattorini 2013). herefore, well-sampled regions may have better species representation than less-sampled areas as a result of sampling efort. Such biases present in natural history collections can be reduced by incorporating as much data as possible in occurrence-based analyses of the data. For example, compiling records from multiple institutions may help reduce the problem of localized collecting from any one collection (Pyke and Ehrlich 2010, Soberon et al. 2000).
he present study summarizes a recently completed database of Odonata records from throughout the state of California, USA, including both specimens and observa-tional records. his group of aquatic insects provided a good starting point for a state-wide database of insect specimens because they are less diverse than most insect orders, have well-known taxonomy (Clausnitzer et al. 2009), are charismatic to the general public, and have naturalist sightings that are available to supplement recent occurrence records (Abbott 2005, Odonata Central 2014). Odonata are also known to be useful indicators of freshwater ecosystem health, and are thus likely to contribute to our un-derstanding of general response to changes in aquatic habitat and water quality (e.g. Clausnitzer 2003, Smith et al. 2007). Here, we outline the methods used in the devel-opment of the California Odonata database. We then present the spatial and temporal distribution of records to identify data gaps and biases. We determine contributions of diferent collection types (e.g. university and government institutions, observation-based records) to total number of records and unique county records. Finally, we as-sess the prevalence of records for each Odonata species before 1976 and after 1979 to determine both potential taxonomic biases and changes in species prevalence, altitude, and elevation ranges over time. We chose the time periods of before 1976 and after 1979 because they have approximately equal numbers of records, and the time period beginning in 1980 marks the beginning of accelerated temperature warming.
Methods
Odonata specimen database
Barbara Museum of Natural History (SBMNH), Essig Museum of Entomology of the University of California at Berkeley (EMEC), Bohart Museum of Entomology of the University of California at Davis (UCBME), Entomology Research Museum of the University of California at Riverside (UCRCENT), Museum of Natural History of the University of California at Santa Cruz (UCSC), and the Oakland Museum of Califor-nia (OMC). he Odonata database includes records from CASENT, CSCA, LACM, EMEC, UCBME, SBMNH, SDNHM, UCRCENT, and OMC.
In addition to the Calbug institutions, we obtained specimen data from the two largest Odonata collections in the United States, the Museum of Zoology at the Uni-versity of Michigan (UMMZI) and the Florida State Collection of Arthropods (FSCA), which includes records from International Odonata Research Institute (IORI), Loui-siana State Arthropod Collection (LSUC), and the Museum of Zoology Pontiical Catholic University of Ecuador (QCAZ) collections. We then incorporated data from other online databases that contain California odonate material, including that of the Illinois Natural History Survey (INHS 2014), and the National Museum of Natu-ral History (NMNH 2014). We also included California odonate occurrence records from the personal collections of D.R. Paulson (DRPC), R.W. Garrison (RWGC), S.D. Gaimari (SDGC), and the author (J.E.B-D, Ball-Damerow et al. 2014). Finally, the odonate records of C.H. Kennedy (1917), collected throughout central California in 1914–15 are incorporated as a private collection. hese records are included in the Essig museum’s online specimen database (Table 1, Essig Museum of Entomology Collections Specimen Database 2014).
Odonata was a high priority group for the Calbug project, which began in 2010. At the start of the project, we directly entered data from specimen labels into the Essig database, and assigned each specimen a Unique Identiier (UID) that is associated with the physical specimen and its database record. he Essig database uses Linux, Apache HTTP Server, MySQL, and Perl/PHP (LAMP) technology, and currently contains 117 ields based on Darwin Core standards. A Darwin Core-Archive is created month-ly and made available to GBIF and other aggregators via the Berkeley Natural History Museums (BNHM) IPT service.
Since 2011, we have photographed specimens with their collection labels as the irst stage of the data collection process. Further details on the imaging process are described on the Calbug website (2014). he images are then uploaded into the Essig database with species name and UID information, and stored in the database as part of the specimen record. Individuals may then enter label information for specimen records online through the Essig database, using the magniied specimen image.
Observation-based records
database with georeferenced records, and includes photo-vouchered sightings, records from literature, and some specimen-based data (Abbott 2005). CalOdes is a California statewide dragonly enthusiast group composed of around 125 members who track and submit lists of species observed at speciic locations and dates (Dragonlies of California 2014).
Data quality
To facilitate quality control during data entry, the Essig database uses controlled vocabularies, such as dropdown lists, date range validation, and species name au-thority iles to validate names. Hierarchical information is automatically illed in for geography and taxonomy.
Table 1. All contributing data sources, abbreviations, and total number of specimens.
Source collection Abbreviation # Specimens
CalBug Institutions 14,207
California Academy of Science CASENT 2,876
UC Riverside CIS 531
California State Collection of Arthopods CSCA 24
Essig Museum EMEC 5,550
LA County Museum LACMENT 2,032
Oakland Museum OMC 107
Santa Barbara Museum of Natural History SBMNHENT 153
San Diego Natural History Museum SDNHM 88
UC Bohart Museum UCBME 2,776
UC Riverside UCRCENT 70
non-CalBug Institutions 5,803
Florida State Collection of Arthropods FSCA 65
International Odonata Research Institute (at FSCA) IORI 3,230
Louisiana State University LSUC 48
Museum of Zoology - Pontiical Catholic University of Ecuador (P.U.C.E) QCAZ 12
Illinois Natural History Survey INHS 96
University of Michigan Museum UMMZI 1,425
US National Museum USNM 927
Personal 3,746
C.H. Kennedy CHK 1,190
D.R. Paulson DRPC 930
R.W. Garrison RWGC 576
S.D. Gaimari SDGC 132
J.E. Ball-Damerow ield collections JEBD 918
Observations 8,269
Cal Odes Cal Odes 6,777
Odonata Central Odonata Central 1,492
Following data entry, we conducted a data checking procedure to minimize likely data-entry errors. his included an assessment of records with the same localities for spell-ing errors and to determine whether locations were associated with the correct county in the state. he data entry form of the database automatically illed information from one record to the next so that records with the same information in a series did not have to be entered multiple times. To minimize carry-over errors, we therefore checked records with adjacent UIDs for questionable repeated ields, such as collector or date. Finally, we spot checked all ields for a portion of specimens against the specimen label photograph.
Odonata have been relatively well-curated in these collections over time, so that correct specimen identiication was assumed in most cases. An Odonata specialist, T. Manolis (2003), recently checked most taxonomic identiications of Odonata speci-mens from the Calbug institutions. Odonata specispeci-mens at UMMZI and FSCA have also been curated by odonate specialists, including L.K. Gloyd and M.F. O’Brien at UMMZI, and W.F. Maufray at FSCA.
We compared all specimen records to current county records and known distribu-tion ranges as a method to check for outliers. Each specimen that fell outside of current county records for the species was checked for accurate identiication and potential data entry errors. From these records, we retained only those with veriied species identiication and locality information. Finally, we corrected any species with outdated names, based on taxonomic classiications in Odonata Central (2014).
Georeferencing
We georeferenced occurrence localities using the standardized point-radius method (Wiec-zorek et al. 2004). his method outlines a series of rules to assign geographic coordinates to text descriptions of locations. Using this standard, we also assigned an uncertainty esti-mate (i.e. radius) based on common sources of uncertainty, such as the extent of a named place (e.g. Berkeley, California) and the distance precision provided for an ofset direction (e.g. 4 miles north of Berkeley, California, which has a distance precision of 1 mile). In most cases, we used multiple online georeferencing tools, including Geolocate (Rios and Bart 2010), Georeferencing Calculator (Wieczorek et al. 2004), ACME Mapper (2014), Geographic Names Information System (GNIS; 2014), and Earth Point (2014).
After all records were georeferenced, we spot checked a portion of records for ac-curacy. In addition, we checked all localities with listed counties that did not match county polygons using ArcGIS Desktop, release 10.1 (ESRI 2012). We then corrected any aberrant records or further investigated related records, as needed.
Taxonomic, temporal and spatial summary of records
we then summarized records by decade, by county, and in maps of occurrence loca-tions. For this and all subsequent analyses, we removed any species considered to be vagrant, with only one sighting in the state. We determined species richness and the total number of specimens before 1900 and by decade in the following years. We then calculated species richness and total number of records by county for the entire period of record. In order to assess the efect of efort on species richness by county, we plot-ted the total number of species against the number of records for each county. We also used this information to identify regions that are currently underrepresented in the collections. Finally, we mapped all Odonata occurrence locations before 1976 and after 1979 to illustrate the spatial distribution of records for these time periods.
Contribution of collection types to county records
he four collection types included in the database were the Calbug institutions (Cali-fornia University and government collections), non-Calbug (non-Cali(Cali-fornia) institu-tions, private collections of odonate specialists, and observation-based records. We irst summarized the total number of records from each data source. To illustrate how diferent collections have contributed to our knowledge of spatial distribution of odo-nates in the state, we determined the number of unique county records from each of the major collection types. We summarized the number of unique county records (by species and county) shared by one, two, three, or all four types.
Species occurrence records
by Ball-Damerow et al. (2014) and Manolis (2003), and expert opinion were applied to distinguish between species with actual change in prevalence over time and species with change likely resulting from taxonomic collection biases.
To determine whether species have expanded to higher latitudes or elevations, we calculated the average and range of latitude and elevation for each species before 1976 and after 1979. Any records with greater than 4 km error radius were removed from this analysis. Wilcoxon signed-rank tests were performed to determine whether the median diference in latitude and elevation means between the two time periods were signiicantly diferent.
Results
Database summary
here were 32,025 records from all combined sources (Suppl. material 1, Table 2). he majority of records (21,648) came from Calbug eforts. CalOdes, Odonata Central, recent ield collections (Ball-Damerow et al. 2014), and C.H. Kennedy’s collections (Kennedy 1917) contributed 6777, 1492, 2016, and 1190 records, respectively (Table 2). Many of these records were not unique, and the summed total number of unique species, year, and locality combinations for all data sources was 19,000, and the total species, year, and county combinations was 13,255 (Table 2).
Taxonomic, temporal and spatial summary of records
here are currently 106 species within nine families that are known to occur in the state, including nine species of Aeshnidae, two species of Calopterygidae, 30 species of Coenagrionidae, one species of Cordulegastridae, six species of Corduliidae, 12 species of Gomphidae, seven species of Lestidae, 38 species of Libellulidae, and one species of Petaluridae. he earliest records in the database were from 1879, and include two specimens of Argia vivida Hagen from the Santa Ana River in Southern California, and several records of Hetaerina americana (Fabricius) and Libellula saturata Uhler in Colton, San Bernardino County, California. hese specimens are all held at INHS. he last year of record in the database was 2013.
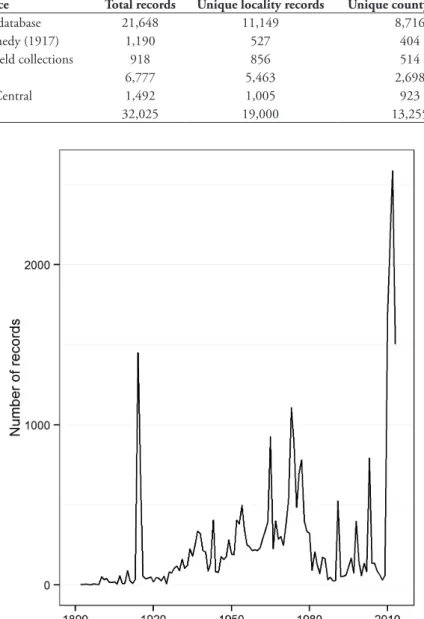
he irst peak in Odonata collections in California occurred in 1914–1915 with C.H. Kennedy’s collections throughout the state (Kennedy 1917, Fig. 1). Subsequent peaks occurred in the mid-1950s, 1960s, and 1970s, with the largest collections from D. Paulson, R. Garrison, and S. Dunkle (Fig. 1). Most of the recent records come from CalOdes sightings and ield surveys by J.E.Ball-Damerow over the period of 2010–2013.
Table 2. Summary of total California Odonata records, and unique species records by year and either lo-cality or county. Specimen database includes Calbug Institutions (California University and government-based collections), non-Calbug institutions, and private collections.
Data source Total records Unique locality records Unique county records
Specimen database 21,648 11,149 8,716 C.H. Kennedy (1917) 1,190 527 404 J.E. B-D ield collections 918 856 514
CalOdes 6,777 5,463 2,698
Odonata Central 1,492 1,005 923
Totals 32,025 19,000 13,255
Figure 1. Total number of California Odonata records per year.
Figure 2. Total number of records and number of species by decade.
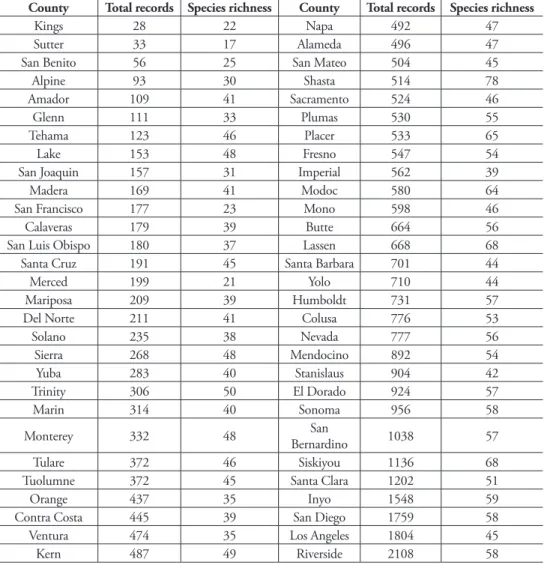
here was an exponential relationship between the total number of unique records from a given county and species richness observed (Fig. 3). he richness increased dramatically through ~ 600 total records, leveling of at ~ 58 species. herefore, many counties with less than 600 records are likely to show higher species richness with in-creased sampling. he least-sampled county was Kings County, with only 28 records and 22 total species (Table 3). Riverside County was the most sampled with 2,108 unique records and 58 species observed (Table 3).
Most counties supported 40–60 species. Counties that were well above or below the conidence interval may be either relatively species-rich or species-poor (Fig. 3). Siskiyou, Shasta, Inyo, Placer, and Lake Counties were relatively rich in species, while some species-poor counties included Los Angeles, Stanislaus, Yolo, Kern, Colusa, and Ventura (Fig. 3).
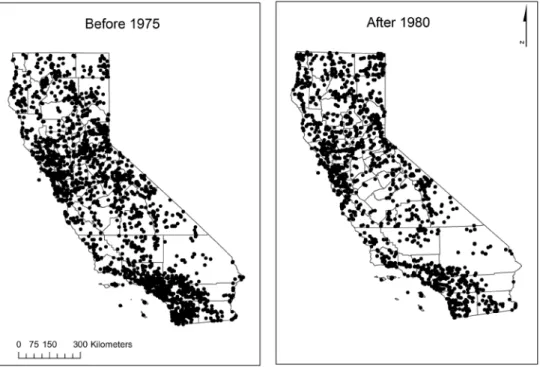
A map of specimen localities for both time periods demonstrates some additional spatial bias and data gaps (Fig. 4). Dense clusters of records exist around urban cent-ers, including the San Francisco Bay area, Sacramento, and major cities in southern California, such as Santa Barbara, Los Angeles, San Diego, and Riverside. he least sampled and/or occupied area is the desert region in the southeast of the state. While the number of total records was higher before 1976, the spatial distribution of records before 1976 and after 1979 is similar.
Contribution of collection types to county records
Calbug institutions contributed the highest number of total records with 14,207 to-tal records, followed by observation-based records with 8,269 toto-tal records (Table 1). Non-Calbug institutions and private collections provided 5,803 and 3,746 total re-cords, respectively.
he observation-based records contributed the highest number of unique county records with 538 (by species and county only), followed by the Calbug institutions with 353 unique records (Fig. 5). Non-Calbug institutions and private collections contributed 87 and 83 unique county records, respectively. here were 705 county records originated from two of the four collection types, 594 records originated from three types, and 370 records originating from all four collection types (Fig. 5).
Species occurrence records
here were 8,642 unique species occurrence records (i.e. unique locality and date) before 1976, and 9,175 unique occurrence records after 1979. he most commonly sampled species before 1976 were Argia vivida, Sympetrum corruptum Hagen, Libellula
saturata, Enallagma carunculatum Morse, and Ischnura cervula Selys. he most
com-monly sampled or observed species after 1979 were Argia vivida, Sympetrum
Table 3. Total number of records and species for each county.
County Total records Species richness County Total records Species richness
Kings 28 22 Napa 492 47
Sutter 33 17 Alameda 496 47
San Benito 56 25 San Mateo 504 45
Alpine 93 30 Shasta 514 78
Amador 109 41 Sacramento 524 46
Glenn 111 33 Plumas 530 55
Tehama 123 46 Placer 533 65
Lake 153 48 Fresno 547 54
San Joaquin 157 31 Imperial 562 39
Madera 169 41 Modoc 580 64
San Francisco 177 23 Mono 598 46
Calaveras 179 39 Butte 664 56
San Luis Obispo 180 37 Lassen 668 68 Santa Cruz 191 45 Santa Barbara 701 44
Merced 199 21 Yolo 710 44
Mariposa 209 39 Humboldt 731 57
Del Norte 211 41 Colusa 776 53
Solano 235 38 Nevada 777 56
Sierra 268 48 Mendocino 892 54
Yuba 283 40 Stanislaus 904 42
Trinity 306 50 El Dorado 924 57
Marin 314 40 Sonoma 956 58
Monterey 332 48 San
Bernardino 1038 57
Tulare 372 46 Siskiyou 1136 68
Tuolumne 372 45 Santa Clara 1202 51
Orange 437 35 Inyo 1548 59
Contra Costa 445 39 San Diego 1759 58 Ventura 474 35 Los Angeles 1804 45
Kern 487 49 Riverside 2108 58
sampled species after 1979 were Enallagma basidens Calvert, Somatochlora albicincta
(Burmeister), Epitheca spinigera (Selys), Stylurus intricatus (Selys), and Ophiogomphus
severus Hagen (Table 4). Aeshna canadensis Walker, Tramea calverti Muttkowski, and
Sympetrum vicinum (Hagen) were not observed before 1998, 1988, and 1980,
respec-tively. Enallagma basidens, Sympetrum albicincta, and Nehalennia irene (Hagen) were only observed one time prior to 1976 (Table 4).
hirty-seven species decreased in relative occurrence in the two time periods ex-amined, while 66 species increased (Table 4). Species with the highest increases in relative occurrence were Anax junius, Tramea lacerata Hagen, Libellula forensis Hagen,
occur-Figure 4. Spatial distribution of California records before 1976, and after 1979.
Figure 5. Number of unique county records for each collection type (Calbug collaborating institutions, non-Calbug institutions, observations - Cal Odes and Odonata Central, and private collections), and number of unique county records with two, three, and four shared data types.
rence were Argia vivida, Sympetrum corruptum, Enallagma annexum (Hagen), Ischnura
denticollis (Burmeister), and Enallagma carunculatum (Table 4). Many of the species
Table 4. Summary of species records, including earliest and latest observation or specimen collection date, unique occurrences (by site and year) before 1976 and after 1979, and the change in relative occur-rence in unique records. Bolded records show the same relationship (i.e. increase or decrease in species prevalence) reported in Ball-Damerow et al. (2014). Records that are likely to be a result of taxonomic biases, such as failure to collect common species or spcies that are diicult to identify, and a focus on rare or charismatic species, are indicated by *.
Family Species Earliest year Latest year Before 1975 After 1980 Change
Coenagrionidae Argia vivida* 1879 2013 767 535 -232
Libellulidae Sympetrum corruptum* 1892 2013 612 414 -198
Coenagrionidae Enallagma annexum* 1900 2013 268 134 -134
Coenagrionidae Ischnura denticollis* 1900 2013 256 126 -130
Coenagrionidae Enallagma carunculatum* 1900 2013 329 218 -111
Coenagrionidae Amphiagrion abbreviatum 1904 2013 168 70 -98
Calopterygidae Hetaerina americana 1879 2013 304 220 -84
Coenagrionidae Argia nahuana* 1894 2013 115 35 -80
Libellulidae Sympetrum illotum 1892 2013 270 205 -65
Coenagrionidae Enallagma praevarum* 1900 2013 103 67 -36
Gomphidae Octogomphus specularis 1900 2013 97 61 -36
Coenagrionidae Enallagma civile* 1926 2013 195 167 -28
Libellulidae Pantala hymenaea* 1912 2013 141 114 -27
Cordulegastridae Cordulegaster dorsalis 1900 2013 139 118 -21
Coenagrionidae Telebasis salva 1900 2013 86 63 -23
Coenagrionidae Enallagma boreale* 1903 2013 92 71 -21
Libellulidae Paltothemis lineatipes* 1914 2013 103 84 -19
Lestidae Archilestes californicus 1900 2012 61 48 -13
Libellulidae Libellula nodisticta 1894 2013 51 39 -12
Libellulidae Libellula comanche 1914 2013 50 38 -12
Lestidae Lestes congener 1900 2013 64 53 -11
Lestidae Lestes dryas 1910 2013 89 80 -9
Libellulidae Sympetrum pallipes 1894 2013 130 125 -5
Libellulidae Leucorrhinia hudsonica 1914 2013 42 32 -10
Coenagrionidae Enallagma anna* 1915 2012 26 19 -7
Coenagrionidae Enallagma clausum* 1938 2013 19 12 -7
Libellulidae Plathemis subornata 1915 2013 34 28 -6
Libellulidae Sympetrum danae 1914 2013 33 27 -6
Coenagrionidae Ischnura barberi 1897 2013 59 55 -4
Gomphidae Ophiogomphus bison 1907 2013 58 55 -3
Libellulidae Sympetrum obtrusum 1914 2013 39 36 -3
Libellulidae Libellula croceipennis 1914 2013 22 19 -3
Aeshnidae Aeshna walkeri 1900 2013 41 40 -1
Lestidae Archilestes grandis 1897 2012 25 24 -1
Libellulidae Erythemis collocata* 1900 2013 216 227 11
Libellulidae Sympetrum semicinctum 1909 2013 61 63 2
Coenagrionidae Coenagrion resolutum 1914 2011 13 13 0
Family Species Earliest year Latest year Before 1975 After 1980 Change
Lestidae Lestes disjunctus 1912 2013 62 66 4
Coenagrionidae Ischnura gemina* 1900 2013 12 13 1
Gomphidae Stylurus intricatus 1915 2012 6 7 1
Gomphidae Erpetogomphus compositus 1914 2013 48 52 4
Lestidae Lestes unguiculatus 1914 2013 10 13 3
Coenagrionidae Enallagma basidens 1974 2012 1 4 3
Corduliidae Cordulia shurtleii 1914 2013 32 37 5
Coenagrionidae Argia hinei 1915 2013 12 16 4
Gomphidae Stylurus plagiatus* 1965 2013 4 8 4
Corduliidae Epitheca spinigera 1914 2013 2 6 4
Corduliidae Somatochlora albicincta 1952 2013 1 5 4
Coenagrionidae Argia moesta 1938 2013 17 22 5
Libellulidae Orthemis ferruginea 1935 2013 16 21 5
Gomphidae Ophiogomphus severus* 1914 2013 3 8 5
Gomphidae Progomphus borealis 1900 2013 61 70 9
Libellulidae Sympetrum internum* 1914 2013 12 18 6
Coenagrionidae Argia alberta 1915 2013 19 26 7
Coenagrionidae Nehalennia irene* 1973 2013 1 9 8
Lestidae Lestes stultus 1903 2013 45 56 11
Gomphidae Erpetogomphus
lampropeltis 1915 2013 10 19 9
Gomphidae Ophiogomphus morrisoni* 1914 2013 23 33 10
Libellulidae Libellula saturata 1879 2013 354 385 31
Libellulidae Sympetrum madidum* 1897 2013 59 72 13
Corduliidae Somatochlora
semicircularis 1914 2013 21 32 11
Libellulidae Libellula quadrimaculata 1914 2013 80 95 15
Coenagrionidae Argia sedula 1945 2013 26 38 12
Coenagrionidae Zoniagrion exclamationis 1911 2013 51 65 14
Libellulidae Libellula composita* 1915 2013 11 23 12
Aeshnidae Aeshna canadensis 1998 2012 0 12 12
Coenagrionidae Ischnura erratica 1900 2013 15 29 14
Coenagrionidae Ischnura hastata 1938 2013 4 18 14
Libellulidae Tramea calverti 1988 2011 0 14 14
Gomphidae Stylurus olivaceus* 1914 2012 5 21 16
Libellulidae Macrodiplax balteata 1947 2013 2 19 17
Libellulidae Leucorrhinia glacialis* 1914 2013 15 33 18
Libellulidae Sympetrum costiferum* 1934 2013 11 29 18
Aeshnidae Aeshna palmata* 1914 2013 34 54 20
Gomphidae Ophiogomphus occidentis* 1914 2013 17 36 19
Libellulidae Sympetrum vicinum 1980 2012 0 19 19
Calopterygidae Calopteryx aequabilis 1951 2013 7 27 20
Libellulidae Brachymesia furcata 1930 2013 7 28 21
Libellulidae Ladona julia 1953 2013 4 25 21
Family Species Earliest year Latest year Before 1975 After 1980 Change
Aeshnidae Aeshna umbrosa 1915 2012 16 40 24
Coenagrionidae Ischnura ramburii 1930 2013 7 32 25
Libellulidae Leucorrhinia intacta 1918 2013 15 44 29
Coenagrionidae Argia agrioides 1907 2013 71 104 33
Libellulidae Perithemis intensa 1934 2013 8 38 30
Coenagrionidae Ischnura perparva 1898 2013 247 292 45
Gomphidae Gomphus kurilis 1905 2013 68 104 36
Corduliidae Macromia magniica* 1900 2013 27 61 34
Libellulidae Pantala lavescens 1915 2013 20 55 35
Coenagrionidae Argia lugens 1901 2013 86 126 40
Aeshnidae Anax walsinghami* 1915 2013 19 56 37
Libellulidae Brechmorhoga mendax 1901 2013 31 69 38
Libellulidae Tramea onusta 1907 2013 31 69 38
Petaluridae Tanypteryx hageni* 1918 2013 22 61 39
Libellulidae Plathemis lydia 1912 2013 157 208 51
Coenagrionidae Argia emma 1910 2013 72 119 47
Aeshnidae Rhionaeschna californica 1897 2013 92 144 52
Coenagrionidae Ischnura cervula 1902 2013 317 394 77
Corduliidae Epitheca canis 1914 2013 16 77 61
Aeshnidae Rhionaeschna multicolor 1898 2013 257 345 88
Libellulidae Libellula pulchella 1905 2013 84 166 82
Libellulidae Libellula luctuosa 1929 2013 54 143 89
Libellulidae Libellula forensis 1900 2013 85 220 135
Libellulidae Tramea lacerata 1900 2013 107 254 147
Aeshnidae Anax junius 1900 2013 196 361 165
Total number of unique occurrences: 8642 9175
in the recent data, much of which were observation-based, as compared to the older specimen data, which was entirely collection-based. Species with the highest declines, that also match patterns of decline in a recent resurvey study by Ball-Damerow et al. (2014), include Hetaerina americana, Sympetrum illotum (Hagen), Octogomphus
specu-laris (Hagen), and Cordulegaster dorsalis Hagen.
Table 5. Summaries of change in unique species latitude and elevation values before 1976 and after 1979. Unique records represent unique combinations of species, locality coordinates, and year. Records included in this assessment have an error radius ≤ 4 km.
Average change Standard deviation Wilcoxon rank-sign test P-Value
Avg Latitude 0.70° (78 km) 0.82 V = 542 <0.001
Min Latitude -0.12° (-13 km) 1.12 V = 3429 0.01
Max Latitude 0.59° (65 km) 1.28 V = 643 <0.001
Avg Elevation (m) -49 248 V = 2730 0.37
Min Elevation (m) -108 360 V = 3327 0.003
Max Elevation (m) 49 613 V = 2099 0.19
Discussion
he California Odonata database provides an overview of common patterns to be expect-ed in the temporal distribution of museum records in California. For odonates, peaks in specimen acquisition occurred in 1914–15 as a result of C.H. Kennedy’s work (Kennedy 1917), with subsequent peaks in the 1950s, 1960s and 1970s through the combined work of several collectors. After this mid-20th century time period, specimen acquisition
was slower. he largest peak in the Odonata database has occurred since 2000, and repre-sents mostly observation-based records obtained from odonate enthusiasts.
Previous work has noted a decline in specimen acquisition of natural history mu-seums over the past 30–40 years that corresponds with declines in funding for many of these institutions (Pyke and Ehrlich 2010). However, observation-based records now provide a valuable complement to specimen records in documenting change in species prevalence and distribution, especially when such records are photo-vouchered and vetted (e.g. Breed et al. 2013, Pyke and Ehrlich 2010, Soberon et al. 2000).
he present study also identiied spatial biases and data gaps, which should be ad-dressed in any distributional analyses and in designing future sampling investigations of California odonates. As demonstrated in a previous spatial analysis of Odonata collection data in North America, collections are often located near more highly popu-lated regions (e.g. Hassall and hompson 2010). Sampling locations for California odonates are clustered around urban areas, such as the San Francisco Bay area, Sac-ramento, Los Angeles, and San Diego. he more sparsely populated desert region in the southeast has very few records, which may also be the result of a lack of freshwater habitat in the region (Fig. 4).
(Fig. 3). While species richness leveled of at around 58 species per county with at least 600 records, there were some obvious outliers that could represent relatively species rich or poor counties. In particular, Shasta County had 78 species recorded with only 514 records, which is likely because it is located in the warmest region with relatively high precipitation and aquatic habitat. In contrast, counties with below average spe-cies richness given the number of records were all dry regions in the Central Valley or southern California. Similarly, Hassall and hompson (2010) found that collection efort, in addition to warm temperature and water availability, plays a major role in species richness of odonates observed in various regions of North America. Future sampling, particularly in under-sampled regions and in warm areas with higher fresh-water habitat availability (e.g. Sutter County and Lake County), is therefore likely to yield additional species.
Each of the diferent collection types—Calbug (i.e. California) institutions, non-Calbug institutions, private collections, and observation-based records—contributed signiicantly to the total number of records and to county records for species. he Calbug institutions had the highest total number of records, followed by observation-based records, which had just over half the number of total records as Calbug. How-ever, observations contributed signiicantly more county records for species. he goal of many enthusiasts is to ind new county records, which likely explains this diference. We ind that recent observation-based records have greatly contributed to our knowl-edge of the spatial distribution of odonate species in California.
Apparent changes in species prevalence according to occurrence records are some-times the result of variation in taxonomic biases, particularly in comparing natural histo-ry specimens and observation-based records (Table 4). According to existing occurrence records, two species with the highest decline in prevalence over time were two of the most common species in the state, Argia vivida and Sympetrum corruptum. Many indi-viduals reporting species observations to CalOdes or Odonata Central may have neglect-ed these species in at least some of their lists, perhaps because these collectors considerneglect-ed less-common species to be more interesting or noteworthy. Another potential problem with observation-based data is the diiculty in identifying certain species in the ield. In general, the most diicult group to identify is the genus Enallagma (particularly E.
bore-ale and E. annexum), and many enthusiasts report them as Enallagma sp. or as “bluets”.
Less experienced enthusiasts in particular may avoid reporting this group or other dif-icult to identify species, such as Argia agrioides and Argia nahuana. In contrast, Odonata taxonomists contributing to specimen records from the early and mid-20th century often
focused on these groups, which were in need of taxonomic revision (e.g. Garrison 1984). As a result of this known discrepancy, such species should not be included in comparing specimen and observation-based data unless analysis methods address collecting biases, or only include results of certain collectors less likely to demonstrate this taxonomic bias. In general, charismatic, rare, and colorful species are often more likely to be present in both specimen collections and in observation-based lists (e.g. Dunn 2005).
of the species with the highest increases in relative occurrence also demonstrated in-creased prevalence in a recent resurvey study (Ball-Damerow et al. 2014, Table 4). Eight out of the ten species with the highest increases in prevalence were habitat gen-eralists, nine species were widespread throughout the state, and all ten were found across a wide range of elevation from sea level to around 2,000 m. Similarly, previous studies have demonstrated that widespread, habitat generalist species have expanded considerably over time (Ball-Damerow et al. 2014, Dupont et al. 2011, Julliard et al. 2004, Korkeamaki and Suhonen 2002). he two most conspicuous migratory species,
Anax junius and Tramea lacerata, demonstrated the highest increases in prevalence. In
a related resurvey study, Ball-Damerow et al. (2014) found that four out of the ive mi-gratory species in the state were among those with the highest increases in prevalence, including A. junius and T. lacerata. he other two migratory species that increased in the resurvey study were Sympetrum corruptum and Pantala hymenaea, both of which are more drab-colored, less conspicuous, and may therefore be less reported in recent observation-based lists (Ball-Damerow et al. 2014).
Odonata species in California have expanded northwards by an average of around 78 km and demonstrated an average increase in northern range margins of 65 km. his shift is unlikely to be the result of location bias, considering that overall distribution of sampled sites was similar across the two time periods (Fig. 4), and favorite collecting sites are not likely to shift north in this way. Similarly, a study of 37 species of British Odonata showed a northward shift at the range margin of about 74 km when com-paring records from 1960–70 and 1985–1995 (Hickling et al. 2005). Overall, a wide range of taxa are shifting northwards and to higher elevations as a result of increasing temperatures (e.g. Angert et al. 2011, Hickling et al. 2006, Parmesan 2006).
However, we also observed a decline in the average minimum elevation across species. his could be the result of increases in dry-season water habitats throughout low elevation areas of the Central Valley with increased irrigation for agriculture (Ball-Damerow et al. 2014). his region of the state was previously drier and may have supported fewer odonates in the early 20th century. In contrast, mountainous regions
generally have higher rainfall and more natural aquatic habitat. he unexpected de-cline in elevation could also be a result of more recent spatial bias to collect near centers of human population, which also tend to occur at lower elevations.
Conclusions
example, researchers may identify particular species, regions, or even collectors that warrant further study or that may be amenable to analyses of change over time. Further investigation will undoubtedly yield discoveries concerning changes in Odonata biol-ogy and distribution over time. Moreover, comparisons of our California odonate data to that of other regions or groups of organisms may provide insight into the general use of Odonata as biological indicators of change over time and more general principles of global change biology.
Acknowledgements
We irst thank the reviewers of this manuscript for their valuable feedback, especially E. DeWalt. his research was supported in part by the National Science Foundation under Grant No. DBI 0956389 to R.G. Gillespie, K. Will, G.K. Roderick, and V.H. Resh, and the Margaret C. Walker Fund for teaching and research in systematic ento-mology. We thank D.R. Paulson, R.W. Garrison, S.D. Gaimari, T.D. Manolis, and K. Biggs for contribution of data, and Gordon Nishida, Jessica Rothery, among others, for assistance with georeferencing species occurrence localities. We also thank M.F. O’Brien, W.F Maufray, N.D. Penny, D. Yanega, S. Heydon, M.S. Caterino, B.V. Brown, and M.A Wall. Wall for providing Odonata specimens at UMMZI, FSCA, CAS, UCR, UCD, SBMNH, LACM, and SDNHM, respectively.
References
Abbott JC (2005) OdonataCentral.com: a model for the web-based delivery of natural history information and citizen science. American Entomologist 51: 240–243.
ACME Mapper 2.1 (2014) http://mapper.acme.com/ [accessed 20 June 2014]
Angert AL, Crozier LG, Rissler LJ, Gilman SE, Tewksbury JJ, Chunco AJ (2011) Do species’ traits predict recent shifts at expanding range edges? Ecology Letters 14: 677–689. doi: 10.1111/j.1461-0248.2011.01620.x
Ariño AH (2010) Approaches to estimating the universe of natural history collections data. Biodiversity Informatics 7: 81–92
Ball-Damerow JE, M’Gonigle LK, Resh VH (2014) Changes in occurrence, richness, and bio-logical traits of dragonlies and damsellies (Odonata) in California and Nevada over the past century. Biodiversity and Conservation 8: 2107–2106. doi: 10.1007/s10531-014-0707-5
Breed GA, Stichter S, Crone EE (2013) Climate-driven changes in northeastern US butterly communities. Nature Climate Change 3: 142–145. doi: 10.1038/nclimate1663
Calbug: Digitizing California arthropod collections (2014) http://calbug.berkeley.edu [accessed 20 June 2014]
of regularization and threshold selections. Ecological Modelling 259: 30–39. doi: 10.1016/j. ecolmodel.2013.03.012
Clausnitzer V (2003) Dragonly communities in coastal habitats of Kenya: indication of bio-tope quality and the need of conservation measures. Biodiversity and Conservation 12: 333–356. doi: 10.1023/a:1021920402913
Clausnitzer V, Kalkman VJ, Ram M, Collen B, Baillie JEM, Bedjanic M, Darwall WRT, Di-jkstra KDB, Dow R, Hawking J, Karube H, Malikova E, Paulson D, Schutte K, Suhling F, Villanueva RJ, von Ellenrieder N, Wilson K (2009) Odonata enter the biodiversity crisis debate: he irst global assessment of an insect group. Biological Conservation 142: 186–1869. doi: 10.1016/j.biocon.2009.03.028
Colwell RK (2013) EstimateS: Statistical estimation of species richness and shared species from samples. Version 9. User’s Guide and application published at: http://purl.oclc.org/estimates DeWalt RE, Favret C, Webb DW (2005) Just how imperiled are aquatic insects? A case study
of stonelies (Plecoptera) in Illinois. Annals of the Entomological Society of America 98: 941–950. doi: 10.1603/0013-8746(2005)098[0941:JHIAAI]2.0.CO;2
Dragonlies of California: California dragonlies and damsellies (2014) http://bigsnest.members. sonic.net/Pond/dragons/
Dunn RR (2005) Modern insect extinctions, the neglected majority. Conservation Biology 19: 1030–1036. doi: 10.1111/j.1523-1739.2005.00078.x
Dupont YL, Damgaard C, Simonsen V (2011) Quantitative historical change in bumblebee (Bombus spp.) assemblages of red clover ields. PLoS ONE 6: 1–7. doi: 10.1371/journal.pone.0025172 Earth Point: Township and Range – search by description (2014) http://www.earthpoint.us/
TownshipsSearchByDescription.aspx
Essig Museum of Entomology Collections: Specimen database (2014) http://essigdb.berkeley.edu [accessed 20 June 2014]
ESRI (2012) ArcGIS Desktop: Release 10.1. Environmental Systems Research Institute, Redlands, CA.
Fattorini S (2013) Regional Insect Inventories Require Long Time, Extensive Spatial Sampling and Good Will. PLoS ONE 8(4): e62118. doi: 10.1371/journal.pone.0062118
Favret C, DeWalt RE (2002) Comparing the Ephemeroptera and Plecoptera specimen da-tabases at the Illinois Natural History Survey and using them to document changes in the Illinois fauna. Annals of the Entomological Society of America 95: 35–40. doi: 10.1603/0013-8746(2002)095[0035:cteaps]2.0.co;2
Garrison RW (1984) Revision of the genus Enallagma of the United States west of the Rocky Mountains and identiication of certain larvae by discriminant Analysis (Odonata: Coena-grionidae). University of California Press, Berkeley, 128 pp.
GBIF (2014) Global Biodiversity Information Facility: Free and open access to biodiversity data. http://www.gbif.org/
Geographic Names Information System (GNIS): Query form for the United States and its Territories (2014) http://geonames.usgs.gov/apex/f?p=136:1:0
Guralnick R, Constable H (2010) VertNet: Creating a Data-sharing Community. Bioscience 60: 258–259. doi: 10.1525/bio.2010.60.4.2
Hassall C, hompson DJ (2010) Accounting for recorder efort in the detection of range shifts from historical data. Methods in Ecology and Evolution 1: 343–350. doi: 10.1111/j.2041-210X.2010.00039.x
Hickling R, Roy DB, Hill JK, Fox R, homas CD (2006) he distributions of a wide range of taxonomic groups are expanding polewards. Global Change Biology 12: 450–455. doi: 10.1111/j.1365-2486.2006.01116.x
Hickling R, Roy DB, Hill JK, homas CD (2005) A northward shift of range margins in British Odonata. Global Change Biology 11: 502–506. doi: 10.1111/j.1365-2486.2005.00904.x Hill A, Guralnick R, Smith A, Sallans A, Gillespie R, Denslow M, Gross J, Murrell Z, Co-nyers T, Oboyski P, Ball J, homer A, Prys-Jones R, de la Torre J, Lociolek P, Fortson L (2012) he notes from nature tool for unlocking biodiversity records from museum records through citizen science. ZooKeys 209: 219–233. doi: 10.3897/zookeys.209.3472 Illinois Natural History Survey: Insect collection (2014) http://inhsinsectcollection.speciesile.
org/InsectCollection.aspx [accessed 10 March 2014]
IPCC (2013) Climate Change 2013: he Physical Science Basis. In: Stocker TF, Qin D, Plattner G, Nauels A, Tignor M, Zia Y, Allen SK, Bex V, Bosche J, Midgley PM (Eds) Working group I contribution to the Fifth Assessment Report of the Intergovernmental Panel on Climate Change. Cambridge University Press, Cambridge, United Kingdom and New York, NY, USA.
Julliard R, Jiguet F, Couvet D (2004) Common birds facing global changes: what makes a spe-cies at risk? Global Change Biology 10: 148–154. doi: 10.1111/j.1365-2486.2003.00723.x Kennedy CH (1917) Notes on the life history and ecology of the dragonlies (Odonata) of
central California and Nevada. Proceedings of the United States National Museum 52: 483–635. doi: 10.5479/si.00963801.52-2192.483
Korkeamaki E, Suhonen J (2002) Distribution and habitat specialization of species af-fect local extinction in dragonly Odonata populations. Ecography 25: 459–465. doi: 10.1034/j.1600-0587.2002.250408.x
Manolis T (2003) Dragonlies and Damsellies of California. University of California Press, Berkeley, 201 pp.
Mount JE (1995) California rivers and streams: the conlict between luvial process and land use. University of California Press, Berkeley, 355 pp.
National Museum of Natural History: Department of Entomology collections (2014) http:// collections.nmnh.si.edu/search/ento/
National Science Foundation (2014) Advancing Digitization of Biodiversity Collections (ADBC). http://www.nsf.gov/funding/pgm_summ.jsp?pims_id=503559 [accessed 21 October 2014]
O’Connell AF, Gilbert AT, Hatield JS (2004) Contribution of natural history collection data to biodiversity assessment in national parks. Conservation Biology 18: 1254–1261. doi: 10.1111/j.1523-1739.2004.00336.x
Parmesan C (2006) Ecological and evolutionary responses to recent climate change. Annual Review of Ecology Evolution and Systematics. Annual Reviews, Palo Alto, 637–669. doi: 10.1146/annurev.ecolsys.37.091305.110100
Pyke GH, Ehrlich PR (2010) Biological collections and ecological/environmental research: a review, some observations and a look to the future. Biological Reviews 85: 247–266. doi: 10.1111/j.1469-185X.2009.00098.x
Rios NE, Bart HL (2010) GEOLocate (Version 3.22) [Computer software]. In: Chasse B (Ed.) Tulane University Museum of Natural History, Los Angeles.
Schuh RT, Hewson-Smith S, Ascher JS (2010) Specimen Databases: A Case Study in Ento-mology using Web-based Software. American Entomologist 56: 206–216. doi: 10.1093/ ae/56.4.206
Smith J, Samways MJ, Taylor S (2007) Assessing riparian quality using two complemen-tary sets of bioindicators. Biodiversity and Conservation 16: 2695–2713. doi: 10.1007/ s10531-006-9081-2
Soberon JM, Llorente JB, Onate L (2000) he use of specimen-label databases for conservation purposes: an example using Mexican Papilionid and Pierid butterlies. Biodiversity and Conservation 9: 1441–1466. doi: 10.1023/a:1008987010383
Szabo JK, Vesk PA, Baxter PWJ, Possingham HP (2010) Regional avian species declines es-timated from volunteer-collected long-term data using List Length Analysis. Ecological Applications 20: 2157–2169. doi: 10.1890/09-0877.1
Wieczorek J, Guo QG, Hijmans RJ (2004) he point-radius method for georeferencing locality descriptions and calculating associated uncertainty. International Journal of Geographical Information Science 18: 745–767. doi: 10.1080/13658810412331280211
Winker K (2004) Natural history museums in a postbiodiversity era. Bioscience 54: 455–459. doi: 10.1641/0006-3568(2004)054[0455:NHMIAP]2.0.CO;2
Supplementary material 1
California Odonata database records after data processing, as described in methods.
Authors: Joan E. Ball-Damerow, Peter T. Oboyski, Vincent H. Resh Data type: occurence
Copyright notice: his dataset is made available under the Open Database License
(http://opendatacommons.org/licenses/odbl/1.0/). he Open Database License