Comparison of ITN Use versus ITN Access
Hannah Koenker1*, Albert Kilian2
1Johns Hopkins University School of Public Health Center for Communication Programs, Baltimore, Maryland, United States of America,2Tropical Health LLP, Montagut, Spain
Abstract
Use of insecticide treated nets is widely recognized as one of the main interventions to prevent malaria and high use rates are a central goal of malaria programs. The gap between household ownership of at least one ITN and population use of ITN has in the past been seen as evidence for failure to achieve appropriate net use. However, past studies compared net use with ownership of at least one net, not access to sufficient nets within households. This study recalculates the net use gap in recent large household surveys using the comparison indicator of ‘access to nets within the household’ as now recommended by Roll Back Malaria and the World Health Organization. Data from 41 Demographic Health Surveys (DHS) and Malaria Indicator Surveys (MIS) (2005–2012) in sub-Saharan Africa were used. For each dataset three indicators were calculated: population access to ITN, population use of ITN, and household ownership of at least one ITN. The ITN use gap was expressed as the difference between one and the ratio of use to access. The median proportion of users compared to those with access was high, at 82.1%. Even at population access levels below 50%, a median 80.6% used an ITN given they had access, and this rate increased to 91.2% for access rates above 50%. Linear regression of use against access showed that 89.0% of household members with access to nets used them the night before. These results clearly show that previous interpretations of the net use gap as a failure of behavioral change communication interventions were not justified and that the gap was instead primarily driven by lack of intra-household access. They also demonstrate the usefulness of the newly recommended ITN indicators; access to an ITN within the household provides a much more accurate comparison of ITN use than ownership.
Citation:Koenker H, Kilian A (2014) Recalculating the Net Use Gap: A Multi-Country Comparison of ITN Use versus ITN Access. PLoS ONE 9(5): e97496. doi:10. 1371/journal.pone.0097496
Editor:Michelle Louise Gatton, Queensland University of Technology, Australia
ReceivedNovember 4, 2013;AcceptedApril 17, 2014;PublishedMay 21, 2014
Copyright:ß2014 Koenker, Kilian. This is an open-access article distributed under the terms of the Creative Commons Attribution License, which permits unrestricted use, distribution, and reproduction in any medium, provided the original author and source are credited.
Funding:This study was made possible by the generous support of the American people through the United States Agency for International Development (USAID) under the terms of USAID/JHU Cooperative Agreement No. GHS-A-00-09-00014-00 for the NetWorks Project. The contents are the responsibility of the authors and do not necessarily reflect the views of USAID or the United States Government. The funders had no role in study design, data collection and analysis, decision to publish, or preparation of the manuscript.
Competing Interests:The authors have the following interests: Co-author Albert Kilian is employed by Tropical Health LLP. There are no patents, products in development, or marketed products to declare. This does not alter the authors’ adherence to all the PLOS ONE policies on sharing data and materials. * E-mail: [email protected]
Introduction
Use of insecticide treated nets (ITN) is widely recognized as one of the main interventions to prevent malaria and high use rates are a central goal of malaria programs. The two main indicators to assess outcomes have been household ownership of at least one ITN and population use of ITN the previous night. Consistently, evaluations have found a significant gap between these indicators with ITN use always much lower than ownership of at least one ITN [1–9] and this has been interpreted as evidence of failure to achieve appropriate net use or as a failure of behavior change communication (BCC) to adequately improve ITN use rates [2,10–12]. Even very recent publications have continued in this trend [13,14] calling for more educational campaigns to close the entire assumed gap. However, the comparison of ownership to use is misleading and inaccurate for two reasons: first, the denomi-nators of the two indicators are different; second, the ownership indicator does not account for insufficient intra-household net saturation, i.e. some household members will not able to use an ITN simply because it is not there, irrespective of motivation to use.
of ITN use during pregnancy which introduces the indicator ‘‘use of an available net’’ which here refers to ITN use by a pregnant woman if the household owns at least one ITN. However, none of these approaches is able to clearly define the behavioral part of the gap between ownership and use as they fail to clearly define access to a net or ITN within the household.
Acknowledging the shortcomings of the existing two indicators for ITN programs, the RBM Monitoring and Evaluation Reference Group (MERG) reviewed them in 2010 and in 2011. The group recommended the addition of two new indicators [34], namely the proportion of households with one ITN for every two people (‘‘household access’’) and the proportion of the population with access to an ITN within the household (here referred to as ‘‘population access’’ or simply ‘‘access’’) with the assumption that an ITN protects on average two people. These new indicators allow for direct comparison against household ownership and population use, respectively, aligning with best practice for using appropriate comparators for assessing health program implemen-tation [35]. Kilian and colleagues [36] recently described in detail how these indicators can be applied for a comprehensive ITN program analysis using Nigeria as an example. Recent WHO World Malaria Reports also presented a generalized analysis of population ITN use compared to population ITN access [37–40]. The aim of the present study was to recalculate the net use gap – the relationship between access and use rather than ownership and use – using data sets from the last seven years and the updated comparison indicator of ‘access to nets within the household’ as recommended by RBM and WHO.
Methods
Data from 41 DHS and MIS surveys (2005–2012) in sub Saharan Africa were used which were downloaded with permis-sion from the Measure DHS web site. For each dataset three indicators were calculated: individual access to ITN within the household, individual use of ITN the previous night, and household ownership of at least one ITN. The ratio of population ITN use to population ITN access within the household was calculated and is referred to here as the use:access ratio. The ITN use gap is therefore calculated as 1 minus the use:access ratio. The ITN variables were used rather than LLIN due to the fact that in the earlier surveys some conventionally treated nets were still present. The majority of ITNs in this analysis, however, are LLIN. Data management and analysis was done using STATA version 12 (STATA Corporation, College Station, Texas, USA) or Excel 2010 (Microsoft Corporation, Seattle, Washington, USA). All analyses accounted for survey design including sampling weights where applicable using the survey command family in STATA.
The survey indicator of access to ITN within the household was calculated from the datasets of individual household members as recommended by MERG [34]. First, an intermediate variable of ‘‘potential ITN users’’ was created by multiplying the number of ITN in each household by a factor of 2.0. In order to adjust for households with more than one net for every two people, the potential ITN users were set equal to the de-facto population in that household if the potential users exceeded the number of people in the household. Second, the population access indicator was calculated by dividing the potential ITN users by the number of de-facto members for each household and determining the overall sample mean of that fraction.
Use of an ITN the previous night was calculated for eachde facto member of the household, i.e. those present in the house the previous night, as recommended by MERG using the listings of net users from the net roster [34]. Household ownership of at least
one ITN was also calculated for each dataset based on the number of ITN observed in the household and defining an ITN as a long-lasting insecticidal net (LLIN) identified by its label or a net that was treated with an insecticide within the last 12 months.
Linear regression was used to describe the relationship between use, ownership and access and in order to acknowledge the fact that no use is possible without access or ownership, all models were run with a ‘‘no constant’’ constraint.
Results
Details of the 41 datasets are provided in Table 1. Surveys were conducted between 2005 and 2012, and consisted of 28 DHS (57%), twelve MIS (41%), and one Anemia and Parasitemia Survey. A total of 28 countries in sub-Saharan Africa were represented, with sixteen surveys (39%) from West Africa, fourteen (34%) from East Africa, five (12%) from Central Africa and six (15%) from Southern Africa.
The range of values for household ownership of ITN was from 3.5% (Guinea 2005) to 90.9% (Tanzania 2011). Median propor-tion of thede facto population with access to an ITN within the household was 31.6%, ranging from 1.5% (Guinea 2005) to 74.5% (Tanzania 2011). Use of an ITN the previous night ranged from 0.3% (Swaziland 2006) to 68.4% (Tanzania 2011). The ratio of use to access ranged from 0.11 (Swaziland 2006) to 1.19 (Madagascar 2011).
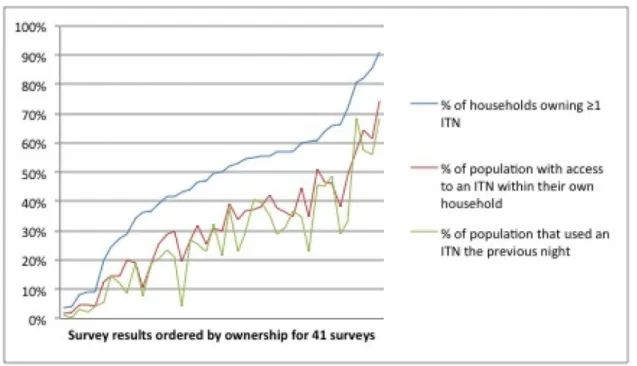
Ownership of ITNs was consistently higher than population access and population use, while access and use tracked more closely as illustrated in Figure 1. Regression analysis showed that there was a close, linear relationship between access and ownership (Figure 2, p,0.0001, R-squared 0.98) with a regression coefficient of 0.68.
The ratio of use to access
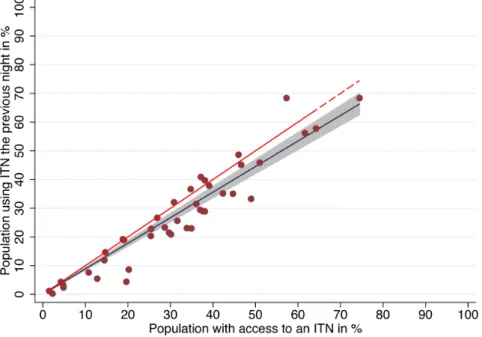
Overall the median proportion of ITN users compared to those with access within the household was high, at 82.1% (Interquartile Range 70.7% to 99.2%) with ten surveys (24%) showing proportions below 70% (range 11.2% to 69.4%) and another eight surveys with a result above 100% (range 102% to 119%) indicating that mean users per net exceeded 2.0 in these cases. Even at population access levels below 50%, a median 80.6% used an ITN given they had access, and this rate increased to 91.2% for access rates .50%. Linear regression of ITN use against access showed an estimated use of 89.0% (95% CI 84.0–93.9) given access (Figure 3) and comparison with a polynomial model confirmed that a linear function was the best fit to the data. However, at lower access values the variation in use was high, then significantly decreased as access rates improved (test for hetero-skedasticity p = 0.008), indicating more consistent use of ITNs at higher access rates (Figure 4). For the four surveys where household ownership met Abuja targets (greater than 80%), the mean ratio of ITN use to access was 0.98.
The relationship between the ratio of ITN use to access appeared initially to increase over time, but multivariate regression analysis indicated that the relationship was confounded by increasing access over time, due to the scale up through mass ITN distributions of the past few years.
Discussion
population use, it was not possible to determine whether the gap between the two indicators was due to behavioral factors or due to not having enough nets for all the members of the household. Since the two indicators had different denominators, conclusions
were difficult to draw. Comparing population ITN use against population ITN access provides a clearer picture of the size of the behavioral gap.
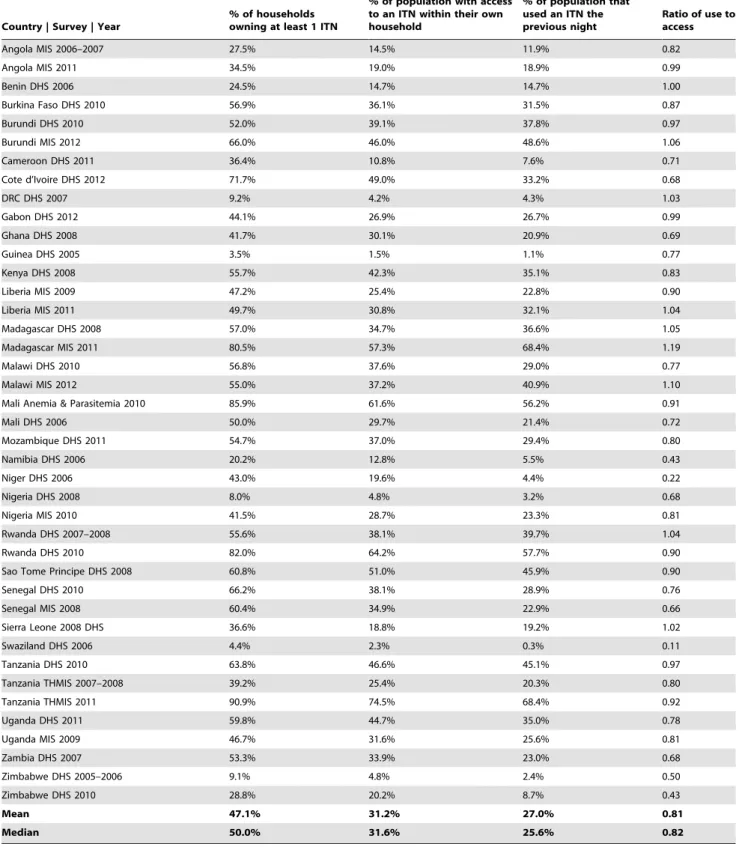
Table 1.Access, use, and ownership of ITNs by survey.
Country | Survey | Year
% of households owning at least 1 ITN
% of population with access to an ITN within their own household
% of population that used an ITN the previous night
Ratio of use to access
Angola MIS 2006–2007 27.5% 14.5% 11.9% 0.82
Angola MIS 2011 34.5% 19.0% 18.9% 0.99
Benin DHS 2006 24.5% 14.7% 14.7% 1.00
Burkina Faso DHS 2010 56.9% 36.1% 31.5% 0.87
Burundi DHS 2010 52.0% 39.1% 37.8% 0.97
Burundi MIS 2012 66.0% 46.0% 48.6% 1.06
Cameroon DHS 2011 36.4% 10.8% 7.6% 0.71
Cote d’Ivoire DHS 2012 71.7% 49.0% 33.2% 0.68
DRC DHS 2007 9.2% 4.2% 4.3% 1.03
Gabon DHS 2012 44.1% 26.9% 26.7% 0.99
Ghana DHS 2008 41.7% 30.1% 20.9% 0.69
Guinea DHS 2005 3.5% 1.5% 1.1% 0.77
Kenya DHS 2008 55.7% 42.3% 35.1% 0.83
Liberia MIS 2009 47.2% 25.4% 22.8% 0.90
Liberia MIS 2011 49.7% 30.8% 32.1% 1.04
Madagascar DHS 2008 57.0% 34.7% 36.6% 1.05
Madagascar MIS 2011 80.5% 57.3% 68.4% 1.19
Malawi DHS 2010 56.8% 37.6% 29.0% 0.77
Malawi MIS 2012 55.0% 37.2% 40.9% 1.10
Mali Anemia & Parasitemia 2010 85.9% 61.6% 56.2% 0.91
Mali DHS 2006 50.0% 29.7% 21.4% 0.72
Mozambique DHS 2011 54.7% 37.0% 29.4% 0.80
Namibia DHS 2006 20.2% 12.8% 5.5% 0.43
Niger DHS 2006 43.0% 19.6% 4.4% 0.22
Nigeria DHS 2008 8.0% 4.8% 3.2% 0.68
Nigeria MIS 2010 41.5% 28.7% 23.3% 0.81
Rwanda DHS 2007–2008 55.6% 38.1% 39.7% 1.04
Rwanda DHS 2010 82.0% 64.2% 57.7% 0.90
Sao Tome Principe DHS 2008 60.8% 51.0% 45.9% 0.90
Senegal DHS 2010 66.2% 38.1% 28.9% 0.76
Senegal MIS 2008 60.4% 34.9% 22.9% 0.66
Sierra Leone 2008 DHS 36.6% 18.8% 19.2% 1.02
Swaziland DHS 2006 4.4% 2.3% 0.3% 0.11
Tanzania DHS 2010 63.8% 46.6% 45.1% 0.97
Tanzania THMIS 2007–2008 39.2% 25.4% 20.3% 0.80
Tanzania THMIS 2011 90.9% 74.5% 68.4% 0.92
Uganda DHS 2011 59.8% 44.7% 35.0% 0.78
Uganda MIS 2009 46.7% 31.6% 25.6% 0.81
Zambia DHS 2007 53.3% 33.9% 23.0% 0.68
Zimbabwe DHS 2005–2006 9.1% 4.8% 2.4% 0.50
Zimbabwe DHS 2010 28.8% 20.2% 8.7% 0.43
Mean 47.1% 31.2% 27.0% 0.81
Median 50.0% 31.6% 25.6% 0.82
Below 50% access, the median use to access ratio was 80.5%, and above 50% access, the median use to access ratio increased to 91.2%, indicating that at high rates of population access, very few people are not using them. Even at lower levels of population access, use to access ratios above 80% indicate that there is – in
general – perhaps only a small amount of room for improvement in net use behavior.
As the population ITN access indicator is calculated by randomly assigning household members to nets, it is not possible to analyze the determinants of non-use for individuals who had access. It is not known whether the individual truly had access or
Figure 1. Ownership, access and use of ITNs for all datasets.Survey results are ordered by ownership. Previously, the visual gap between ownership (blue line) and use (green line) made it seem as though the use gap was vast. When use is compared to access (red line), however, a much closer relationship – and narrower gap – is immediately apparent.
doi:10.1371/journal.pone.0097496.g001
Figure 2. Population with access to an ITN within the household compared to ownership of at least one ITN.Blue dots represent the data points for data sets, the blue line the regression function (fitted values). Shaded area is the 95% confidence interval of the fitted values of population with access to an ITN within the household. Red dashed line represents the equity line where ownership is equal to access. On average, population access was 32% lower than household ownership.
not, due to the randomization process in the population access calculation. This prevents detailed analysis of the determinants of non-use among those with access which might inform BCC planning to improve targeting of messaging to these ‘hold outs’. However, analysis of use rates by age in households with enough nets compared to households without enough nets indicates that those most likely not to be using a net when nets are scarce are
adolescents and the elderly [41], as adults and young children tend to be prioritized for net use [9,14,17,20,42–46]. Reported reasons for not using nets when one is available are well documented [21,24,47–49], and non-use is primarily due to lack of perceived mosquito density and hot nighttime temperatures [21]. Aside from these main subjective reasons, preferences for various design aspects (size, shape, color, texture, density of fabric) have been
Figure 3. Relationship of ITN use to ITN access.The figure illustrates the linear relationship of use to access. The red dots are proportion of the population that used an ITN the previous night from the survey datasets. The blue line represents the regression line (fitted values). The shaded area is the 95% confidence interval of the fitted values. The red dashed line represents the equity line, where use equals access. On average, 89% of those with access used a net the previous night.
doi:10.1371/journal.pone.0097496.g003
Figure 4. Ratio of use to access by access to an ITN within the household.The ratio of use to access is plotted in red dots, by access. The top red dashed line represents the threshold of 100% use among those with access; the lower dashed line represents a nominal minimum target of 80% use among those with access. The blue line is the fitted values indicating the positive linear relationship between the use to access ratio and access. As access (x-axis) increases, use also increases.
shown to limit use of nets in some households in Ghana, Ethiopia, and in the Peruvian Amazon [22–24], although preferences have not been widely shown to significantly affect ITN use in sub-Saharan Africa. While comparative acceptability and preference studies are useful for determining stated preferences in a given area, they do not indicate whether households would use a non-preferred net just as often, in the absence of their non-preferred net. Other objective barriers also prevent net use such as its usual user being absent, particularly for funerals [50], being too old or torn, or the net not yet being dry from washing or otherwise unavailable [21,51,52].
These results should be considered encouraging for both donors and malaria control program officials, as they show that the vast majority of those who have access to ITNs are using them, and that donor investments are not being wasted. Whether these high use rates are due to the extensive BCC efforts of the past decade, to an increasing familiarity with ITNs [51], or solely to improvements in access is not known. It is likely, despite a dearth of published literature specifically on malaria, that BCC has contributed significantly to the high rates of use, given evidence from Cameroon [27] and Zambia (Boulay, personal communica-tion) that ITN use is significantly associated with exposure to messages about malaria. What is apparent from these data, however, is that as population access increases, the ITN use to access ratio increases, which may indicate a growing social norm of ITN use as ITNs are increasingly available. Ratios of use to access above 100% indicate that more than two people are sharing a net, on average, which should not be surprising considering that multiple children may be sharing both a sleeping space and its ITN, particularly in conditions of ITN scarcity, or in homes where hanging multiple nets is made difficult due to the size or other characteristics of the dwelling or the sleeping rooms’ alternative uses [18,20]. The very low use to access ratios from Namibia, Swaziland, and Niger date from 2006, prior to any scale-up of ITNs; Swaziland benefited from robust IRS operations at the time, while in Niger use dropped dramatically during dry season, when fieldwork was conducted [53].
These findings are in line with other national-level studies [26] that demonstrate that access is the main driver of ITN use. A recent analysis from Nigeria [41] showing that use to access ratios vary considerably between northern and southern Nigeria (0.89 and 0.64, respectively) is already being utilized to focus BCC efforts more strategically in the southern part of the country (Nigeria Malaria Elimination Programme, personal communica-tion). It will be important to look more closely at subnational trends in order to effectively identify and respond to variations in net use within countries. The population access indicator, while it does not allow for individual-level analyses, does allow for analyses
at the household level, such as socio-economic status, geographic location, and others. While the use:access ratio provides a better quantification of the behavioral ‘‘use gap’’, this calculation still does not offer any insights into the reasons why individuals do not use the nets. Future studies will need to include questions that allow these reasons and determinants to be elucidated. The recent Malaria BCC Indicator Reference Guide was designed by RBM partners to help with this and other areas of malaria BCC evaluation [54].
Malaria program officials should continue to work towards closing the access gap by ensuring ways of providing enough nets to all households. Continuous distribution of ITNs through antenatal clinics, immunization programs, school distributions and community distributions, as well as through social marketing and retail sales, provide several options to ensure households can obtain nets between or instead of mass campaigns. At the same time, better understanding of the ITN use gap and the effects of BCC will be necessary to maintain the gains in use and to strengthen the culture of net use that is growing around the continent [51,55].
Conclusion
The ‘‘net use gap’’ often referred to by program planners when looking at the standard indicators of household ownership of ITNs and then at population ITN use does not take into account whether there are enough ITNs in the household. On the whole, over 80% of those with access to an ITN within their household reported using an ITN the previous night. This has significant implications for planning behavior change interventions to increase use. These results clearly show that previous interpreta-tions of the net use gap as a failure of behavioral change communication interventions were not justified and that the gap was instead primarily driven by lack of intra-household access. They also demonstrate the usefulness of the newly recommended distinction between use and actual access to ITN.
Acknowledgments
The authors are grateful to Matt Lynch, Sara Berthe, Angela Acosta, Megan Fotheringham and George Greer for their comments on earlier drafts.
Author Contributions
Conceived and designed the experiments: HK AK. Performed the experiments: HK. Analyzed the data: HK AK. Contributed reagents/ materials/analysis tools: HK AK. Wrote the paper: HK AK.
References
1. Korenromp EL, Miller J, Cibulskis RE, Kabir Cham M, Alnwick D, et al. (2003) Monitoring mosquito net coverage for malaria control in Africa: possession vs. use by children under 5 years. Trop Med Int Health 8: 693–703.
2. Macintyre K, Keating J, Okbaldt YB, Zerom M, Sosler S, et al (2006) Rolling out insecticide treated nets in Eritrea: examining the determinants of possession and use in malarious zones during the rainy season. Trop Med Int Health 11: 824–833.
3. Belay M, Deressa W (2008) Use of insecticide treated nets by pregnant women and associated factors in a pre-dominantly rural population in northern Ethiopia. Tropical Medicine & International Health 13: 1303–1313. 4. Baume CA, Marin MC (2008) Gains in awareness, ownership and use of
insecticide-treated nets in Nigeria, Senegal, Uganda and Zambia. Malar J 7: 153.
5. Githinji S, Herbst S, Kistemann T, Noor AM (2010) Mosquito nets in a rural area of Western Kenya: ownership, use and quality. Malar J 9: 250. 6. Rickard DG, Dudovitz RN, Wong MD, Jen HC, Osborn RD, et al (2011)
Closing the gap between insecticide treated net ownership and use for the prevention of malaria. Prog Community Health Partnersh 5: 123–131.
7. Macintyre K, Littrell M, Keating J, Hamainza B, Miller J, et al. (2011) Determinants of hanging and use of ITNs in the context of near universal coverage in Zambia. Health Policy Plan.
8. Deressa W, Fentie G, Girma S, Reithinger R (2011) Ownership and use of insecticide-treated nets in Oromia and Amhara Regional States of Ethiopia two years after a nationwide campaign. Trop Med Int Health.
9. Garley AE, Ivanovich E, Eckert E, Negroustoueva S, Ye Y (2013) Gender differences in the use of insecticide-treated nets after a universal free distribution campaign in Kano State, Nigeria: post-campaign survey results. Malar J 12: 119. 10. Afolabi BM, Sofola OT, Fatunmbi BS, Komakech W, Okoh F, et al. (2009) Household possession, use and non-use of treated or untreated mosquito nets in two ecologically diverse regions of Nigeria—Niger Delta and Sahel Savannah. Malar J 8: 30.
12. Deribew A, Birhanu Z, Sena L, Dejene T, Reda AA, et al. (2012) The effect of household heads training on long-lasting insecticide-treated bed nets utilization: a cluster randomized controlled trial in Ethiopia. Malar J 11: 99.
13. Loha E, Tefera K, Lindtjørn B (2013) Freely distributed bed-net use among Chano Mille residents, south Ethiopia: a longitudinal study. Malar J 12: 23. 14. Stevens ER, Aldridge A, Degbey Y, Pignandi A, Dorkenoo MA, et al. (2013)
Evaluation of the 2011 long-lasting, insecticide-treated net distribution for universal coverage in Togo. Malar J 12: 162.
15. Winch PJ, Makemba AM, Kamazima SR, Lwihula GK, Lubega P, et al. (1994) Seasonal variation in the perceived risk of malaria: implications for the promotion of insecticide-impregnated bed nets. Soc Sci Med 39: 63–75. 16. Agyepong IA, Manderson L (1999) Mosquito avoidance and bed net use in the
Greater Accra Region, Ghana. J Biosoc Sci 31: 79–92.
17. Fernando SD, Abeyasinghe RR, Galappaththy GN, Gunawardena N, Ranasinghe AC, et al. (2009) Sleeping arrangements under long-lasting impregnated mosquito nets: differences during low and high malaria transmission seasons. Trans R Soc Trop Med Hyg 103: 1204–1210. 18. Toe´ LP, Skovmand O, Dabire´ KR, Diabate´ A, Diallo Y, et al. (2009) Decreased
motivation in the use of insecticide-treated nets in a malaria endemic area in Burkina Faso. Malar J 8: 175.
19. Gunasekaran K, Sahu SS, Vijayakumar KN, Jambulingam P (2009) Accept-ability, willing to purchase and use long lasting insecticide treated mosquito nets in Orissa State, India. Acta Trop 112: 149–155.
20. Iwashita H, Dida G, Futami K, Sonye G, Kaneko S, et al (2010) Sleeping arrangement and house structure affect bed net use in villages along Lake Victoria. Malar J 9: 176.
21. Pulford J, Hetzel MW, Bryant M, Siba PM, Mueller I (2011) Reported reasons for not using a mosquito net when one is available: a review of the published literature. Malar J 10: 83.
22. Grietens KP, Muela Ribera J, Soto V, Tenorio A, Hoibak S, et al. (2013) Traditional nets interfere with the uptake of long-lasting insecticidal nets in the Peruvian Amazon: the relevance of net preference for achieving high coverage and use. PLoS One 8: e50294.
23. Baume CA, Reithinger R, Woldehanna S (2009) Factors associated with use and non-use of mosquito nets owned in Oromia and Amhara regional states, Ethiopia. Malar J 8: 264.
24. Baume CA, Koh AC (2011) Predictors of mosquito net use in Ghana. Malar J 10: 265.
25. Hetzel MW, Gideon G, Lote N, Makita L, Siba PM, et al. (2012) Ownership and usage of mosquito nets after four years of large-scale free distribution in Papua New Guinea. Malar J 11: 192.
26. Eisele TP, Keating J, Littrell M, Larsen D, Macintyre K (2009) Assessment of insecticide-treated bednet use among children and pregnant women across 15 countries using standardized national surveys. Am J Trop Med Hyg 80: 209– 214.
27. Bowen HL (2013) Impact of a mass media campaign on bed net use in Cameroon. Malar J 12: 36.
28. Rickard DG, Dudovitz RN, Wong MD, Jen HC, Osborn RD, et al. (2011) Closing the gap between insecticide treated net ownership and use for the prevention of malaria. Prog Community Health Partnersh 5: 123–131. 29. Bennett A, Smith SJ, Yambasu S, Jambai A, Alemu W, et al. (2012) Household
possession and use of insecticide-treated mosquito nets in Sierra Leone 6 months after a national mass-distribution campaign. PLoS One 7: e37927.
30. Vanden Eng JL, Thwing J, Wolkon A, Kulkarni MA, Manya A, et al. (2010) Assessing bed net use and non-use after long-lasting insecticidal net distribution: a simple framework to guide programmatic strategies. Malar J 9: 133. 31. Thwing JI, Perry RT, Townes DA, Diouf MB, Ndiaye S, et al. (2011) Success of
Senegal’s first nationwide distribution of long-lasting insecticide-treated nets to children under five - contribution toward universal coverage. Malar J 10: 86. 32. West PA, Protopopoff N, Rowland MW, Kirby MJ, Oxborough RM, et al.
(2012) Evaluation of a national universal coverage campaign of long-lasting insecticidal nets in a rural district in north-west Tanzania. Malar J 11: 273.
33. Singh M, Brown G, Rogerson SJ (2013) Ownership and use of insecticide-treated nets during pregnancy in sub-Saharan Africa: a review. Malar J 12: 268. 34. MEASURE Evaluation, MEASURE DHS, President’s Malaria Initiative, Roll Back Malaria Partnership, UNICEF, et al. (2013) Household survey indicators for malaria control.
35. Tanahashi T (1978) Health service coverage and its evaluation. Bull World Health Organ 56: 295–303.
36. Kilian A, Koenker H, Paintain L (2013) Estimating population access to insecticide-treated nets from administrative data: correction factor is needed. Malar J 12: 259.
37. World Health Organization (2010) World Malaria Report 2010. 38. World Health Organization (2011) World Malaria Report 2011. 39. World Health Organization (2012) World Malaria Report 2012. 40. World Health Organization (2013) World Malaria Report 2013.
41. Kilian A, Koenker H, Baba E, Onyefunafoa EO, Selby RA, et al. (2013) Universal coverage with insecticide-treated nets — applying the revised indicators for ownership and use to the Nigeria 2010 malaria indicator survey data. Malar J 12: 314.
42. Noor AM, Kirui VC, Brooker SJ, Snow RW (2009) The use of insecticide treated nets by age: implications for universal coverage in Africa. BMC Public Health 9: 369.
43. Tsuang AT, Lines JL, Hanson KH (2010) Which family members use the best nets? An analysis of the condition of mosquito nets and their distribution within households in Tanzania. Malar J 9.
44. Ahmed SM, Hossain S, Kabir MM, Roy S (2011) Free distribution of insecticidal bed nets improves possession and preferential use by households and is equitable: findings from two cross-sectional surveys in thirteen malaria endemic districts of Bangladesh. Malar J 10: 357.
45. Graves PM, Ngondi JM, Hwang J, Getachew A, Gebre T, et al. (2011) Factors associated with mosquito net use by individuals in households owning nets in Ethiopia. Malar J 10: 354.
46. Koenker H, Munoz B, Boulay M, Mkocha H, Levens J, et al. (2012) Trends in weekly reported net use by children during and after rainy season in central Tanzania. Malar J 11: 218.
47. Alaii JA, Hawley WA, Kolczak MS, ter Kuile FO, Gimnig JE, et al. (2003) Factors affecting use of permethrin-treated bed nets during a randomized controlled trial in western Kenya. Am J Trop Med Hyg 68: 137–141. 48. Beer N, Ali AS, Eskilsson H, Jansson A, Abdul-Kadir FM, et al. (2012) A
qualitative study on caretakers’ perceived need of bed-nets after reduced malaria transmission in Zanzibar, Tanzania. BMC Public Health 12: 606.
49. Galvin KT, Petford N, Ajose F, Davies D (2011) An exploratory qualitative study on perceptions about mosquito bed nets in the Niger Delta: what are the barriers to sustained use? J Multidiscip Healthc 4: 73–83.
50. Monroe A, Harvey SA, Lam Y, Muhangi D, Loll D, et al. (2014) "People will say that I am proud": a qualitative study of barriers to bed net use away from home in four Ugandan districts. Malar J 13: 82.
51. Koenker HM, Loll D, Rweyemamu D, Ali AS (2013) A good night’s sleep and the habit of net use: perceptions of risk and reasons for bed net use in Bukoba and Zanzibar. Malar J 12: 203.
52. Kilian A, Balayo C, Feldman M, Koenker H, Lokko K, et al. (2014) The effect of single or repeated home visits on the hanging and use of insecticide-treated mosquito nets following a mass distribution campaign-a cluster randomized, controlled trial. PLoSOne. In press.
53. Thwing J, Hochberg N, Vanden Eng J, Issifi S, Eliades MJ, et al. (2008) Insecticide-treated net ownership and usage in Niger after a nationwide integrated campaign. Trop Med Int Health 13: 827–834.
54. Roll Back Malaria Communication Community of Practice (2014) Malaria Behavior Change Communication Indicator Reference Guide.