Functional Brain Connectivity as a New
Feature for P300 Speller
Aya Kabbara1,2*, Mohamad Khalil1,2, Wassim El-Falou1,2, Hassan Eid3, Mahmoud Hassan4,5
1Department of electrical and computer engineering, ULFG1, Tripoli, Lebanon,2Azm center for research in biotechnology and its applications, EDST, Tripoli, Lebanon,3Mazloum Hospital, Tripoli, Lebanon,
4INSERM, U1099, F-35000, Rennes, France,5Université de Rennes 1, LTSI, F-35000, Rennes, France
Abstract
The brain is a large-scale complex network often referred to as the“connectome”. Cognitive functions and information processing are mainly based on the interactions between distant brain regions. However, most of the‘feature extraction’methods used in the context of Brain Computer Interface (BCI) ignored the possible functional relationships between differ-ent signals recorded from distinct brain areas. In this paper, the functional connectivity quantified by the phase locking value (PLV) was introduced to characterize the evoked responses (ERPs) obtained in the case of target and non-targets visual stimuli. We also tested the possibility of using the functional connectivity in the context of‘P300 speller’. The proposed approach was compared to the well-known methods proposed in the state of the art of“P300 Speller”, mainly the peak picking, the area, time/frequency based features, the xDAWN spatial filtering and the stepwise linear discriminant analysis (SWLDA). The electroencephalographic (EEG) signals recorded from ten subjects were analyzed offline. The results indicated that phase synchrony offers relevant information for the classification in a P300 speller. High synchronization between the brain regions was clearly observed during target trials, although no significant synchronization was detected for a non-target trial. The results showed also that phase synchrony provides higher performance than some existing methods for letter classification in a P300 speller principally when large num-ber of trials is available. Finally, we tested the possible combination of both approaches (classical features and phase synchrony). Our findings showed an overall improvement of the performance of the P300-speller when using Peak picking, the area and frequency based features. Similar performances were obtained compared to xDAWN and SWLDA when using large number of trials.
Introduction
A Brain Computer Interface (BCI) is a communication system in which messages or com-mands that an individual sends to the external world do not pass through the brain’s normal OPEN ACCESS
Citation:Kabbara A, Khalil M, El-Falou W, Eid H, Hassan M (2016) Functional Brain Connectivity as a New Feature for P300 Speller. PLoS ONE 11(1): e0146282. doi:10.1371/journal.pone.0146282
Editor:Daniele Marinazzo, Universiteit Gent, BELGIUM
Received:August 26, 2015
Accepted:December 14, 2015
Published:January 11, 2016
Copyright:© 2016 Kabbara et al. This is an open access article distributed under the terms of the
Creative Commons Attribution License, which permits unrestricted use, distribution, and reproduction in any medium, provided the original author and source are credited.
Data Availability Statement:I uploaded my data to Zenodo.com, please find the link of the data directory:
https://zenodo.org/record/30084#.VeWi-JdOKR8.
Funding:This work was supported by Mazloum Hospital and Azm center for research in
biotechnology and its applications, Tripoli, Lebanon.
output pathways of peripheral nerves and muscles [1]. One of the most popular non-invasive BCIs is the so called 'P300 speller' that helps people suffering from severe neuromuscular disor-ders like amyotrophic lateral sclerosis (ALS), multiple sclerosis, cerebral palsy, spinal cord inju-ries and stroke. These disorders usually result in loss of voluntary muscle control due to the destruction of motor neurons with intact cognitive abilities [2][3]. Therefore, their only way to communicate with the environment is using brain activities.
A typical pipeline for a BCI involves several steps: the first one is the recording of brain activity using either invasive [4] or non-invasive recording system [1,5–6]. The second step involves the pre-processing of the recorded data. This step is essentially realized to remove arti-facts or non-useful information. The pre-processing step is followed by a feature extraction procedure such as time, frequency, time-frequency or spatial domain features. Finally, the extracted features are then processed for classification purpose and can be translated into actions [7]. To date, the most used features in P300 systems are derived from single channels, such as amplitude variations [8], calculation of area [7], matched filter [9], peak picking [7] and template-based cross correlation method [10]. In addition, more advanced techniques have been reported including stepwise linear discriminant analysis (SWLDA) [11][7], support vector machines [12][13][14], spatial filtering using xDAWN algorithm [15] and information geometry framework [16].
On the other side, it became evident to consider that the brain is a large-scale complex net-work [17]. Cognition as well as brain disorders were reported to be network phenomena [18–
20]. Several studies have demonstrated that brain functions require the integration of distrib-uted brain areas [21–25].
In this context, the functional connectivity approach has been used for motor imagery and has provided encouraging results for the classification of mental tasks in the context of BCIs [26–30]. Concerning the P300 Speller, a‘qualitative’MEG-fMRI based analysis have been recently reported in [31] using the coherence function. Authors showed that the coherent activity in the bilateral parieto-occipital cortices could play a significant role in the P300-BCI. However, an appropriate approach using functional connectivity in an economical P300 speller based on scalp electroencephalographic (EEG) signals has never been established yet, which is the objective of the presented paper.
Here, we propose a novel way to analyze the P300 waves obtained for target and non-targets cases. The new approach is based on the phase synchronization between the scalp EEG signals. The method was applied on ten subjects performing a task of recognizing Arabic letters pre-sented on a screen. Results were compared with the widely used features and classification techniques. Finally, the possible combination of the existed approaches with the phase syn-chrony was also investigated.
Materials and Methods
1. Data acquisition and experimental setup
EEG signals were recorded at MAZLOUM hospital (Tripoli, Lebanon) using a 19-channel EEG system (The NicoletOne™Neurodiagnostic system). Electrodes were placed in accordance with the revised international 10/20 system [32] at Fp1, Fp2, F3, F4, F7, F8, C3, C4, P3, P4, O1, O2, T3, T4, T5, T6, Fz, Pz and Cz. Electrode impedance was always kept under 5 kO. The ground electrode was placed at the center of the forehead. The EEGs were sampled at 500 Hz, bandpass filtered at 0.1–80 Hz, and stored in EDF format.
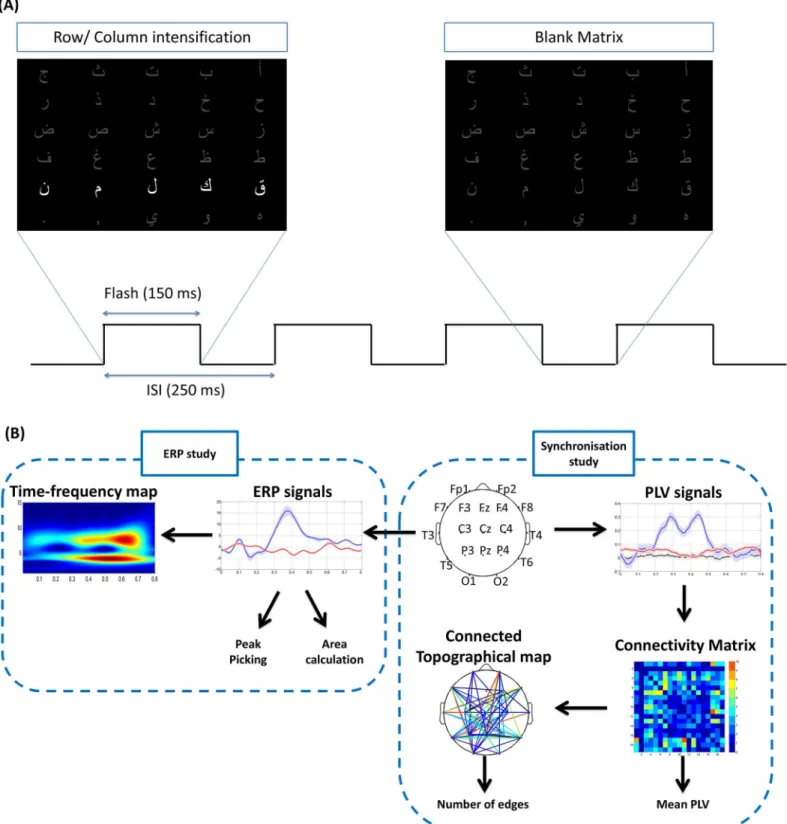
informed consent before their participation. Participant was sitting in a comfortable chair in front of a computer monitor (344 x 194 mm) located at 60 cm away from his eyes. Participant was supposed not to have any muscle movements during the EEG recording. During the exper-iment, a 5x6 matrix containing Arabic letters (Fig 1) was presented on the computer screen. In a random order, each row or column was intensified for a short period of time ("Flash dura-tion"). At each run, the participant was asked to focus on a specified letter of the matrix, and count silently the number of times of the flashes of this letter. Flashes of row or column con-taining the desired symbol constituted target stimuli and suppose to evoke a P300 wave, while all other flashes of rows and columns constituted non-target stimuli and may not evoke a P300. The P300 wave can be found theoretically in exactly one row and one column and their inter-section was considered as the selected stimulus. This paradigm was adopted from [7].
In our system, row/column intensifications were randomized in blocks of 11 (5 row and 6 columns). Sets of 11 intensifications were repeated 15 times for each character. This repetition was necessary in order to reduce the measurement's noise recorded for each row and column's flash. Based on [7], the flash duration was equal to 150 ms, and the brief pause between two flashes was defined as inter-stimulus interval (ISI) and equal to 250 ms, as shown inFig 1. A Matlab-based (MATLAB R2012, MathWorks) Graphical User Interface (GUI) was developed for presenting the stimuli.
Four sessions were realized for each subject. The first and the second sessions consisted of a series of separated characters. The third and the fourth sessions consisted of words. The ses-sions were separated by a break of 5–10 min. Each session contained 14 runs. After each run, the matrix was blank for 3s. This period informed the user that the previous character was completed and to focus on the next character that was displayed on the left of the screen. Thus, the dataset for each subject contained four raw signals in total. A total of 420 target trials (14 characters152) and 1890 non-target trials (14 characters159) was obtained.
2. Pre-processing
We extracted a window of length 1 s ranging from−200 ms before flash stimuli to 800 ms after flash stimuli (500 samples per trial). All EEG signals were filtered using FIR band-pass filter with 1–12 Hz cut-off frequencies [9]. This temporal filter was also performed to remove vari-ous undesired signals such as slow variations of the EEG signal (due to electrode polarization) or power-line interference (50 Hz in Lebanon). Moreover, eye blinks artifacts were rejected using an automatic method based on the Independent component analysis (ICA). The algo-rithm consisted of decomposing the raw EEG signals into 19 independent components (ICs), then removing the artifactual components automatically, based on the ratio between the weights of frontal sensors and those of other sensors [33].
3. Feature extraction
3.1. Time domain features. To extract the P300 wave from EEG signals, we first compute the time-locked average across trials of the same type. All trials of a given type were aligned to a trigger that indicates the onset of the stimulus and then averaged over all trials and electrodes. A normalization step with respect to the baseline window was then performed. To investigate the changes of event-related potentials in brain activity before and after the stimulus, we used the pre-stimulus period as a baseline [-200 0] ms and perform a "z-score approach" normaliza-tion on the window [0 800 ms] already defined. This approach was adopted as it supposed to take into account the variability of the baseline values [34].
Fig 1. Paradigm design and the steps of analysis.(A) Paradigm design: The Arabic alphabets were presented on a screen. The time course of events was about 250 ms ISI. 11 stimuli (6 rows and 5 columns) were intensified in a random order for 150 ms. (B) The different steps of the phase synchronization and the ERPs study.
• Peak picking feature [7]: Peak picking represents the difference between the lowest negative point prior to the P300 window (the window for the P300 ranged typically between 220 and 500 ms) and the highest positive point in the P300 window.
• Area feature [7]: This feature represents the sum of the data points present in the P300 window.
3.2. Time-frequency features. Time-frequency EEG analyses may provide additional information about dynamical changes of the electrical activity, not apparent in the temporal signal [35]. In the present study, continuous wavelet transform (CWT) was used to compute the time-frequency maps of the normalized ERP signals. A wavelet is a small wave that has an oscillating wavelike characteristic and has its energy concentrated in time [36]. The definition of continuous wavelet transform is given byEq (1):
Xða;bÞ ¼ 1ffiffiffi
b p
ð
11
xðtÞC t a b
dt ð1Þ
wherex(t) is the analyzed signal, a shifts time, b (>0) modulates the width, andC(t) is a
mother wavelet.
In this paper, we used the complex Morlet wavelet as it is most commonly used in the EEG time-frequency analysis, defined as follows [37]:
CðtÞ ¼ 1ffiffiffiffiffiffiffi
pf
b
p e
i2pfct
e t 2
f b ð2Þ
where fbis the bandwidth parameter, fcis the wavelet center frequency, and p is an integer
parameter.
The time-frequency transform was computed in each trial and then averaged over all trials and electrodes.
3.3. Proposed feature: Phase synchronization. Phase synchronization (PS) was used here as it provides an amplitude-free measure of connectivity between cortical regions. PS was shown to be less susceptible to the effects of artifacts and inter-trial / inter-subject amplitude variability [38]. The first step for estimating the phase synchrony is to extract the instantaneous phase of each signal. We used the method based on Hilbert transform in our study. The second step is the definition of an appropriate index to measure the degree of synchronization between estimated instantaneous phases. To measure phase synchrony, the phase locking value (PLV) method was used as described in [39]. For each source pair,xandy, at timet (t=t1,. . .,tT
whereT=Dfs;Dandfsdenote the signal length relative to the onset and the sampling
fre-quency, respectively) for theTrtrials and for subjectk(k= 1. . .M, whereMdenotes the num-ber of subjects), PLV is defined as:
PLVk xyðtÞ ¼
1
Tr
j
XN
n¼1
expðjðFxðtÞ FyðtÞÞÞ
j
ð3ÞIn our study, the data was recorded from 19 EEG electrodes, this implies 171 possible instantaneous PLV signal for every condition. PLV time courses were computed over multiple trials of a same stimulus, and the transient changes in connectivity were observed in the pre-defined time window of analysis.
To statistically validate the significance of the identified networks, we compared them with PLVs computed from surrogate data [40]. A set of 200 surrogate time series was generated by randomizing the phase of the original signals. We only retained results when the difference between PLVs computed on the surrogate data and PLVs computed on the original time series was significant (p<0.01).
To obtain the connectivity matrix, the instantaneous PLV signals were then averaged within a time window. Selecting the time window was a delicate part. Based on the facts that the evoked potentials appear about 300 ms after the stimulus, we chose the [200 500] ms time window.
In order to visualize the PLV values between electrodes, topographical connected maps were illustrated. We were interested in displaying only the significant edges retained from the surrogates test. A statistical analysis was performed using the Wilcoxon test, in order to quantify the differences between target and non-target stimulus, in the ERPs, PLVs and TF maps.
4. Classification methods
After extracting the number of edges of the topographical maps as a feature (Fig 1), data were classified as‘target’or‘non-target’responses using a support vector machine classifier. We used different methods existing in the state-of-the art of“P300 speller”to compare them with the proposed method:
• xDAWN algorithm [15]: xDAWN is a spatial filtering algorithm based on SVD and PCA. It attempts to define an estimation of the subspace that contains P300 evoked potentials. Then a Bayesian Linear Discriminant Analysis (BLDA) is used to classify epochs as either‘target’
or‘non-target’.
• Stepwise linear discriminant analysis (SWLDA) [11]: The ability of SWLDA to provide good results in classifying P300 waves has been confirmed in [41]. The stepwise LDA applies a reg-ular LDA after reducing the feature space by selecting suitable features to be included in the discriminant function.
• Peak Picking algorithm: After extracting the peak picking feature of the ERP signals, a linear support vector machine (SVM) classifier was used for classification.
• Area algorithm: A SVM classifier was used for classification after extracting the area feature. In order to evaluate the classification performance of each of the algorithm, the following steps were realized: (a) A feature vector was built from the large set of NtotalERP signals
gener-ated from the four raw EEG signals of each subject (as mentioned in Section 1), (b) Data were divided into training/testing sets using the cross-validation procedure to prevent over-fitting, (c) The classifier was trained using the training data set(d) The classifier was then applied to the rest of the Ntestcharacters and the accuracy values were calculated, the (b)-(c)-(d) processes
were repeated 10 times, and finally (e) the accuracy was defined as the average of the accuracies calculated over the repetitions. To analyze the statistical differences in the performances obtained from the different classification algorithms, the Wilcoxon rank-sum test (p<0.05) was used.
Results
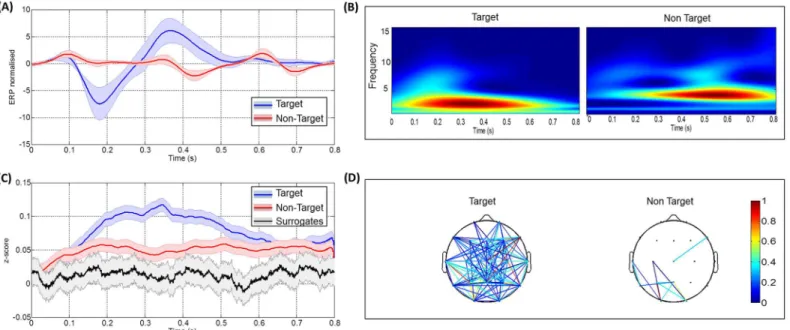
related potentials of target and non-target conditions (Fig 2A), the corresponding time-frequency maps (Fig 2B) and the phase synchrony (Fig 2C). InFig 2C, a clear difference between the target and non-target was found in the time range between 100 ms and 650 ms after stimuli. TheFig 2Dshows the PLV connectivity maps obtained for each condition.
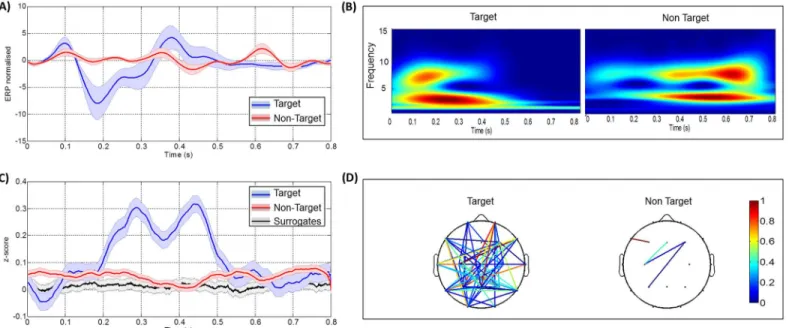
InFig 3, a typical example of the results obtained for a given subject is reported (seeS1,S2, S3,S4andS5Figs for more examples). In both analyses, a statistical difference between target and non-target was reported in the case of ERPs (p<0.05) and PLVs (p<0.005). However, no significant difference between the two conditions was detected in the time-frequency analysis (p= 0.34 andp= 0.5 in Figs2and3respectively). After the comparison with surrogates data, a large number of edges were remained in the connected topographical map in the case of target trials (left), while a very few connected edges were conserved in the case of non-target trials (right).
In this section, we present the results obtained after reducing the number of trials to that corresponding to one character (the number of trials of target responses was 30 trials, and the number of trials of non-target responses was 135 trials). For each subject, PLVs and ERPs were averaged over all the characters per session (14 characters). Figs4and5show the results obtained for two different subjects. Figs4Aand5Ademonstrate the difference in ERP signals while Figs4Band5Bshow the difference in the PLVs. The different connectivity maps are shown in Figs4Cand5C. TheFig 5Ddisplays how the different extracted features differentiate between target and non-target trials. For the first subject, the mean PLV value was greater in the case of target than non-target condition. The chart at the top right ofFig 4Dshows the presence of more edges in the target condition. Results obtained using the peak picking and the area features indicate similar results. Note that no error was detected in the case of mean PLV, the peak picking, and the number of edges features while 4 errors were observed in the case of the area feature.
Fig 2. Results obtained after averaging over all trials, electrodes and subjects.(A) The target and non-target ERP responses, (B) The two frequency maps corresponding to both conditions, (C) The target, non-target PLV responses. The black line represents the phase synchrony computed on surrogate data and the grey strip indicates dispersion of these data±standard deviation and (D) The two connected topographical scalps for target and non-target responses.
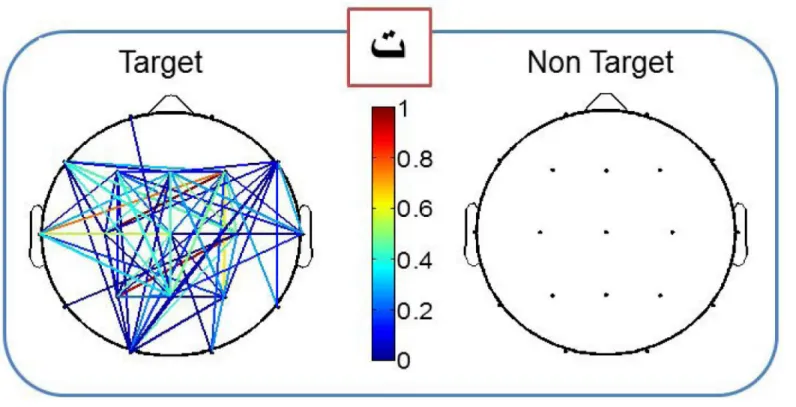
For the second subject, an error in classification was detected with the mean PLV feature (character 4), and two errors were detected (character 3 and character 6) when counting the number of edges. No error was detected with the peak picking feature, and two errors were detected with the area feature (character 9 and character 10). InFig 6, we illustrate the differ-ence between the two connected map corresponding to target and non-target conditions for one character (seeS6,S7,S8,S9andS10Figs for more examples).
We then realized the same process on the trials corresponding to one row/column intensifi-cation (15 trials). A typical example of the connectivity maps of the eleven stimuli is shown in Fig 7. We show that the number of edges corresponding to the target row (row 3 in this exam-ple) was the highest between all rows. Similarly, the number of edges corresponding to the tar-get column (column 4 in this example) was the highest between all columns. By considering the intersection of the predicted row and the predicted column, we obtain for the given subject, 48 well-predicted letters of 56 letters.
Additionally, we have compared the performance of using only the classical features (the peak picking and the area) or combining them with the phase synchrony. Results are shown in Fig 8. TheFig 8Ashows that the performance over subjects was improved when combining both approaches.Fig 8Bshows the performance over each of the ten subjects. The phase syn-chrony dramatically improved the performance of the peak picking method on subjects 4 (72.72% vs. 80.52%), 6 (67.53% vs. 74.03%) and 8 (64.93% vs. 81.81%).
Results also showed that the combination of the two traditional features does not lead to better performance. However, a higher performance was obtained when combining the three features (peak amplitude, area and PLV).
Finally, the effect of the number of trials on the classification performance was evaluated in Fig 9. For each classification algorithm, we compute the Area Under ROC Curve (AUC) values in function of the number of trials. The illustrated AUC values represent the median values across all analyzed subjects. TheFig 9reveals that increasing the number of trials lead to better Fig 3. Results obtained for a given subject after averaging over all trials and electrodes.(A) The target and non-target ERP responses. (B) The two frequency maps corresponding to each condition. (C) The target, non-target PLV responses. The black line represents the phase synchrony computed on surrogate data and the grey strip indicates dispersion of these data±standard deviation and (D) The two connected topographical scalps for target and non-target responses.
Fig 4. Results obtained from subject 1, after averaging the trials corresponding to 14 characters.(A) The target and non-target ERP responses, (B) The target, non-target PLV responses. The black line represents the phase synchrony computed on surrogate data and the grey strip indicates dispersion of these data±standard deviation. (C) The two connected topographical scalps for target and non-target responses and (D) Comparison between the different features extracted with respect to the 14 characters.
Fig 5. Results obtained from subject 2, after averaging the trials corresponding to 14 characters.(A) shows the target and non-target ERP responses. (B) shows the target, non-target PLV responses. The black line represents the phase synchrony computed on surrogate data and the grey strip indicates dispersion of these data±standard deviation. (C) shows the two connected topographical scalps for target and non-target responses. (D) shows a comparison between the different features extracted with respect to the 14 characters.
performance accuracy for all the classification methods. One can notice also that the classifica-tion based on phase synchrony achieves better performance than methods based on peak picking or area features. The results of the Wilcoxon rank-sum test indicated a significant dif-ference between the phase synchrony and the classification based on peak picking feature (p<0.01), area feature (p<0.01) and their combination (p<0.01). However, while our method provides better performance than SWLDA using 28 or more trials, it underperforms xDAWN and SWLDA algorithms for a small number of trials. The Wilcoxon test shows that there is a significant difference between xDAWN and PLV algorithms (p<0.01). No significant differ-ence was observed between SWLDA and the phase synchrony.
Discussion
In this paper, we used the functional connectivity analysis to characterize the evoked responses (ERPs) obtained for target and non-targets visual stimuli in the context of P300 speller. The functional connectivity was computed using the Phase Locking Value (PLV). The results obtained have demonstrated that the synchronization between different brain areas allows the classification of different type (target vs. non target) of visual stimuli. The results showed that the separation was also possible in case of 30 trials for the same condition. Compared to the classical features (mainly the peak picking and the area), the PLV provided globally better sepa-ration between target and non-target trials.
The results reported that the reduction of trials number has an important impact on the PLV performance. The results of PLV on 15 trials have provided good classification results for only 3 subjects. We then tested the possible combination of PLV with the peak picking and area.
The detection of target from a single trial was very challenging task in our application. Many recent researches have proposed different ways to reduce the number of trials while keeping a high accuracy rate. Some studies have proposed a boosting approach [42] or applying a complex classifier rather than a simple average based on applying an ensemble of SVM classi-fiers [12]. Another approach was presented in [16], where authors have classified a single trial ERP epoch, while reducing the number of repetitions needed for the training phase. Authors have also dealt with the problem of inter-session and inter-subject variability. Methodologi-cally, PLV is measuring the‘consistency’in the phase difference between two signals, and con-sistency is measured across trials. Therefore, the application of PLV in single-trial context seems to be inadequate.
Here, our main objective was to introduce the functional connectivity as a new feature for the classification of visual evoked responses. The functional connectivity quantified by PLV revealed interesting results in characterizing both target and non-target evoked responses. We then investigated the feasibility of the functional connectivity in the P300-speller context. Results obtained by the phase synchrony showed higher performance than the classical features (such as peak picking and area). However, the phase synchrony method offered comparable Fig 7. Typical example of results obtained after averaging all trials corresponding to each row/column response.The focused target character is from row 3, column 4: 'ﺹ'.
Fig 8. The performance of the different features applied solely or in combination with the phase synchrony.(A) Performance over participants (B) Performance for each participant.
results to the more advanced classification algorithms (SWLDA and xDAWN) when using a large number of trials.
Finally, we showed encouraging results about the use of the functional connectivity in the context of ERP analyses and P300 speller when using large number of trials. Nevertheless, we believe that several methodological issues should be tackled to achieve a good performance when applying the functional connectivity for a small number of trials in the context of a
“P300 speller”. A possible direction in this context could be the reduction of trials number when computing functional connectivity [43] such as the so-called‘single-trial’connectivity methods. The dynamical behaviors of the functional networks can be also investigated to improve the classification results [44].
Fig 9. The performances of the different classification algorithms as a function of the number of trials.
In addition, it is important to keep in mind that measuring the functional connectivity at the EEG scalp level may be affected by the problem of volume conduction. To address this problem, the phase slope index method suggested by [45] could be a good alternative. More-over, the‘EEG source connectivity’analysis was shown to reduce the effect of the volume con-duction and improve the spatial resolution of the networks [46]. We are, however, aware that methodological efforts are required to adapt these approaches in‘real time’perspective.
Conclusion
In this paper, we showed that functional connectivity computed using the phase locking value is a very efficient tool to characterize visual evoked responses. Functional connectivity was applied on data recorded from subjects performing the task of recognizing Arabic letters pre-sented on a screen, in the context of“P300 speller”paradigm. Results revealed a clear difference between functional networks obtained in the case of target and non-targets visual stimuli. In the context of the P300 speller, our findings reported that the phase synchrony is very powerful in the presence of a large number of trials. Other connectivity measures (mainly the single-trial methods) could be applied for faster and more efficient“P300 speller”system. We speculate that the proposed method can be easily extended to other Brain Computer Interface (BCI) systems.
Supporting Information
S1 Fig. Results obtained for subject 1, after averaging over all trials and electrodes.(A) The target and non-target ERP responses. (B) The two frequency maps corresponding to each condi-tion. (C) The target, non-target PLV responses. The black line represents the phase synchrony computed on surrogate data and the grey strip indicates dispersion of these data ± standard deviation and (D) The two connectivity maps for target and non-target responses.
(TIF)
S2 Fig. Results obtained for subject 2, after averaging over all trials and electrodes.(A) The target and non-target ERP responses. (B) The two frequency maps corresponding to each condi-tion. (C) The target, non-target PLV responses. The black line represents the phase synchrony computed on surrogate data and the grey strip indicates dispersion of these data ± standard deviation and (D) The two connectivity maps for target and non-target responses.
(TIF)
S3 Fig. Results obtained for subject 3, after averaging over all trials and electrodes.(A) The target and non-target ERP responses. (B) The two frequency maps corresponding to each condi-tion. (C) The target, non-target PLV responses. The black line represents the phase synchrony computed on surrogate data and the grey strip indicates dispersion of these data ± standard deviation and (D) The two connectivity maps for target and non-target responses.
(TIF)
S4 Fig. Results obtained for subject 4, after averaging over all trials and electrodes.(A) The target and non-target ERP responses. (B) The two frequency maps corresponding to each condi-tion. (C) The target, non-target PLV responses. The black line represents the phase synchrony computed on surrogate data and the grey strip indicates dispersion of these data ± standard deviation and (D) The two connectivity maps for target and non-target responses.
(TIF)
each condition. (C) The target, non-target PLV responses. The black line represents the phase synchrony computed on surrogate data and the grey strip indicates dispersion of these data ± standard deviation and (D) The two connectivity maps for target and non-target responses.
(TIF)
S6 Fig. Results obtained after averaging all trials of target and non-target conditions for the character 'ﺃ'.
(TIF)
S7 Fig. Results obtained after averaging all trials of target and non-target conditions for the character 'ﺱ'.
(TIF)
S8 Fig. Results obtained after averaging all trials of target and non-target conditions for the character 'ﺽ'.
(TIF)
S9 Fig. Results obtained after averaging all trials of target and non-target conditions for the character 'ﻙ'.
(TIF)
S10 Fig. Results obtained after averaging all trials of target and non-target conditions for the character 'ﻡ'.
(TIF)
S11 Fig. Results obtained after averaging all trials of target and non-target conditions for the character 'ﻑ'.
(TIF)
Acknowledgments
The authors would like to thank Miss Ramia Al-Jammal for her help during the EEG acquisition.
Author Contributions
Conceived and designed the experiments: AK MH WEF. Performed the experiments: AK HE MH WEF. Analyzed the data: AK MK MH WEF. Contributed reagents/materials/analysis tools: MK WEF MH. Wrote the paper: AK MH.
References
1. Wolpaw JR, Birbaumer N, McFarland DJ, Pfurtscheller G, Vaughan TM. Brain—computer interfaces for communication and control. Clinical neurophysiology. 2002; 113(6):767–91. PMID:12048038
2. Röttig D, Leplow B, Eger K, Ludolph AC, Graf M, Zierz S(2006) Only subtle cognitive deficits in non—
bulbar amyotrophic lateral sclerosis patients. Journal of neurology 253: 333–339. PMID:16208524
3. Lakerveld J, Kotchoubey B, Kübler A (2008) Cognitive function in patients with late stage amyotrophic lateral sclerosis. Journal of Neurology, Neurosurgery & Psychiatry 79: 25–29.
4. Maynard EM, Nordhausen CT, Normann RA. The Utah intracortical electrode array: a recording struc-ture for potential brain-computer interfaces. Electroencephalography and clinical neurophysiology. 1997; 102(3):228–39. PMID:9129578
6. Sitaram R, Caria A, Veit R, Gaber T, Rota G, Kuebler A, et al. FMRI brain-computer interface: a tool for neuroscientific research and treatment. Computational intelligence and neuroscience. 2007.
7. Farwell LA, Donchin E. Talking off the top of your head: toward a mental prosthesis utilizing event-related brain potentials. Electroencephalography and clinical Neurophysiology. 1988; 70(6):510–23. PMID:2461285
8. Hoffmann U, Vesin J-M, Ebrahimi T, Diserens K. An efficient P300-based brain—computer interface for disabled subjects. Journal of Neuroscience methods. 2008; 167(1):115–25. PMID:17445904
9. Serby H, Yom-Tov E, Inbar GF. An improved P300-based brain-computer interface. IEEE Transactions on Neural Systems and Rehabilitation Engineering. 2005; 13(1):89–98. PMID:15813410
10. Bayliss JD. Use of the evoked potential P3 component for control in a virtual apartment. IEEE Transac-tions on Neural Systems and Rehabilitation Engineering. 2003; 11(2):113–6. PMID:12899249
11. Donchin E, Spencer KM, Wijesinghe R (2000) The mental prosthesis: assessing the speed of a P300-based brain-computer interface. IEEE Transactions on Rehabilitation Engineering, 8: 174–179. PMID: 10896179
12. Kaper M, Meinicke P, Grossekathoefer U, Lingner T, Ritter H (2004) BCI competition 2003-data set IIb: support vector machines for the P300 speller paradigm. IEEE Transactions on Biomedical Engineering, 51: 1073–1076. PMID:15188881
13. Rakotomamonjy A, Guigue V (2008) BCI competition III: dataset II-ensemble of SVMs for BCI P300 speller. IEEE Transactions on Biomedical Engineering, 55: 1147–1154.
14. Meinicke P, Kaper M, Hoppe F, Heumann M, Ritter H. Improving transfer rates in brain computer inter-facing: a case study; 2002. pp. 1107–1114.
15. Rivet B, Souloumiac A, Attina V, Gibert G (2009) xDAWN algorithm to enhance evoked potentials: application to brain—computer interface. IEEE Transactions on Biomedical Engineering, 56: 2035–
2043. doi:10.1109/TBME.2009.2012869PMID:19174332
16. Barachant A, Congedo M (2014) A Plug&Play P300 BCI Using Information Geometry. arXiv preprint arXiv:14090107.
17. Sporns O, Tononi G, Kötter R. The human connectome: a structural description of the human brain. PLoS Comput Biol. 2005; 1(4):e42. PMID:16201007
18. Crossley NA, Mechelli A, Scott J, Carletti F, Fox PT, McGuire P, et al. The hubs of the human connec-tome are generally implicated in the anatomy of brain disorders. Brain. 2014; 137(8):2382–95.
19. Laufs H. Functional imaging of seizures and epilepsy: evolution from zones to networks. Current opin-ion in neurology. 2012; 25(2):194–200. doi:10.1097/WCO.0b013e3283515db9PMID:22322414
20. Bressler SL, Menon V. Large-scale brain networks in cognition: emerging methods and principles. Trends in cognitive sciences. 2010; 14(6):277–90. doi:10.1016/j.tics.2010.04.004PMID:20493761
21. Varela FJ. Resonant cell assemblies: a new approach to cognitive functions and neuronal synchrony. Biological research. 1994; 28(1):81–95.
22. Friston K, Buechel C, Fink G, Morris J, Rolls E, Dolan R. Psychophysiological and modulatory interac-tions in neuroimaging. Neuroimage. 1997; 6(3):218–29. PMID:9344826
23. Tononi G, Edelman GM. Consciousness and complexity. Science. 1998; 282(5395):1846–51 PMID: 9836628
24. Rodriguez E, George N, Lachaux J-P, Martinerie J, Renault B, Varela FJ. Perception's shadow: long-distance synchronization of human brain activity. Nature. 1999; 397(6718):430–3. PMID:9989408
25. Lachaux J, Phase synchronization and large-scale integration. Biological psychiatry; 2002; Elsevicer science inc 360 park ave south, New York, NY 10010–1710 USA.
26. Wei Q, Wang Y, Gao X, Gao S. Amplitude and phase coupling measures for feature extraction in an EEG-based brain—computer interface. Journal of Neural Engineering. 2007; 4(2):120. PMID: 17409486
27. Gysels E, Celka P. Phase synchronization for the recognition of mental tasks in a brain-computer inter-face, IEEE Transactions on Neural Systems and Rehabilitation Engineering 2004; 12(4):406–15. PMID:15614996
28. Hamner B, Leeb R, Tavella M, Millán JdR, editors. Phase-based features for motor imagery brain-com-puter interfaces. Engineering in Medicine and Biology Society, EMBC, 2011 Annual International Con-ference of the IEEE; 2011: IEEE.
30. Gysels E, Renevey P, Celka P. SVM-based recursive feature elimination to compare phase synchroni-zation computed from broadband and narrowband EEG signals in brain—computer interfaces. Signal Processing. 2005; 85(11):2178–89.
31. Takano K, Ora H, Sekihara K, Iwaki S, Kansaku K. Coherent activity in bilateral parieto-occipital corti-ces during P300-BCI operation. Frontiers in neurology. 2014; 5.
32. Sharbrough F, Chatrian G, Lesser R, Lüders H, Nuwer M, Picton T. American Electroencephalographic Society guidelines for standard electrode position nomenclature. J clin Neurophysiol. 1991; 8(2):200–
2. PMID:2050819
33. Kabbara A, Hassan M, Khalil M, Eid H, El-falou W. An efficient P300-speller for Arabic letters. Interna-tional Conferences on Biomedical Engineering (ICABME); IEEE, Lebanon 2015.
34. Roach BJ, Mathalon DH. Event-related EEG time-frequency analysis: an overview of measures and an analysis of early gamma band phase locking in schizophrenia. Schizophrenia bulletin. 2008; 34 (5):907–26. doi:10.1093/schbul/sbn093PMID:18684772
35. Rosso O, Martin M, Figliola A, Keller K, Plastino A. EEG analysis using wavelet-based information tools. Journal of neuroscience methods. 2006; 153(2):163–82. PMID:16675027
36. Mallat S. A wavelet tour of signal processing: Academic press; 1999.
37. Mørup M, Hansen LK, Herrmann CS, Parnas J, Arnfred SM. Parallel factor analysis as an exploratory tool for wavelet transformed event-related EEG. NeuroImage. 2006; 29(3):938–47. PMID:16185898
38. Truccolo WA, Ding M, Knuth KH, Nakamura R, Bressler SL. Trial-to-trial variability of cortical evoked responses: implications for the analysis of functional connectivity. Clinical Neurophysiology. 2002; 113 (2):206–26. PMID:11856626
39. Lachaux J-P, Rodriguez E, Martinerie J, Varela FJ. Measuring phase synchrony in brain signals. Human brain mapping. 1999; 8(4):194–208.
40. Faes L, Pinna GD, Porta A, Maestri R, Nollo G. Surrogate data analysis for assessing the significance of the coherence function. IEEE Transactions on Biomedical Engineering. 2004; 51(7):1156–66. PMID:15248532
41. Krusienski DJ, Sellers EW, Cabestaing F, Bayoudh S, McFarland DJ, Vaughan TM, et al. (2006) A comparison of classification techniques for the P300 Speller. Journal of neural engineering 3: 299. PMID:17124334
42. Hoffmann U, Garcia G, Vesin J-M, Diserens K, Ebrahimi T. A boosting approach to P300 detection with application to brain-computer interfaces; 2005. IEEE. pp. 97–100.
43. Ansari-Asl K, Senhadji L, Bellanger J-J, Wendling F. Quantitative evaluation of linear and nonlinear methods characterizing interdependencies between brain signals. Physical Review E. 2006; 74 (3):031916.
44. Mheich A, Hassan M, Khalil M, Berrou C, Wendling F (2015) A new algorithm for spatiotemporal analy-sis of brain functional connectivity. Journal of neuroscience methods 242: 77–81 doi:10.1016/j. jneumeth.2015.01.002PMID:25583381
45. Nolte G, Ziehe A, Nikulin VV, Schlögl A, Krämer N, Brismar T, et al. (2008) Robustly estimating the flow direction of information in complex physical systems. Physical review letters 100: 234101. PMID: 18643502