Composition of Plants and Soil along a Precipitation
Gradient in Northern China
Jian-Ying Ma1,2, Wei Sun3*, Xiao-Ning Liu1, Fa-Hu Chen2
1Cold and Arid Regions Environmental and Engineering Research Institute, Chinese Academy of Sciences, Lanzhou, People’s Republic of China,2Key Laboratory of Western China’s Environmental Systems (Ministry of Education), Lanzhou University, Lanzhou, People’s Republic of China,3Institute of Grassland Science, Key Laboratory of Vegetation Ecology (Ministry of Education), Northeast Normal University, Changchun, People’s Republic of China
Abstract
Water availability is the most influential factor affecting plant carbon (d13C) and nitrogen (d15N) isotope composition in arid and semi-arid environments. However, there are potential differences among locations and/or species in the sensitivity of plantd13C andd15N to variation in precipitation, which are important for using stable isotope signatures to extract paleo-vegetation and paleo-climate information. We measuredd13C and d15N of plant and soil organic matter (SOM) samples collected from 64 locations across a precipitation gradient with an isotherm in northern China.d13C andd15N for both C3
and C4plants decreased significantly with increasing mean annual precipitation (MAP). The sensitivity ofd13C to MAP in C3
plants (-0.660.07%/100 mm) was twice as high as that in C4 plants (20.360.08%/100 mm). Species differences in the
sensitivity of plantd13C andd15N to MAP were not observed among three main dominant plants. SOM became depleted in
13C with increasing MAP, while no significant correlations existed betweend15N of SOM and MAP. We conclude that water
availability is the primary environmental factor controlling the variability of plantd13C andd15N and soild13C in the studied
arid and semi-arid regions. Carbon isotope composition is useful for tracing environmental precipitation changes. Plant nitrogen isotope composition can reflect relative openness of ecosystem nitrogen cycling.
Citation:Ma J-Y, Sun W, Liu X-N, Chen F-H (2012) Variation in the Stable Carbon and Nitrogen Isotope Composition of Plants and Soil along a Precipitation Gradient in Northern China. PLoS ONE 7(12): e51894. doi:10.1371/journal.pone.0051894
Editor:Minna-Maarit Kyto¨viita, Jyva¨skyla¨ University, Finland
ReceivedMarch 29, 2012;AcceptedNovember 9, 2012;PublishedDecember 18, 2012
Copyright:ß2012 Ma et al. This is an open-access article distributed under the terms of the Creative Commons Attribution License, which permits unrestricted use, distribution, and reproduction in any medium, provided the original author and source are credited.
Funding:This research was supported by National Basic Research Program of China (2009CB825101 and 2009CB421306), National Natural Science Foundation of China (41071032, 31270445), Talents Foundation of Cold and Arid Regions Environmental and Engineering Research Institute (2011) and West Light Foundation of the Chinese Academy of Science (2009). The funders had no role in study design, data collection and analysis, decision to publish, or preparation of the manuscript.
Competing Interests:The authors have declared that no competing interests exist.
* E-mail: sunwei@nenu.edu.cn
Introduction
In drought-prone ecosystems, water availability controls eco-system structure and processes by affecting long-term balances between ecosystem inputs and outputs of elements and the cycling of carbon and nutrients within ecosystems [1]. The effects of water availability on nutrient cycling in ecosystems are complex. Studies along natural gradients of water availability are helpful and can address these controls [2]. Plant performance along environmental gradients offers one way to evaluate potential plant responses to climate change [3]. Stable carbon and nitrogen isotopic signatures (d13C and d15N) of plants and soil can serve as valuable non-radioactive tracers and nondestructive integrators of how plants today and in the past have integrated with and responded to their abiotic and biotic environments [4,5,6].
Plants discriminate against13CO2during photosynthetic CO2
fixation in ways that reflect plant metabolism and environmental conditions. Differences between carboxylation reactions induce the disparate photosynthetic 13C fractionation and response to changes in environmental conditions between the C3 and C4
photosynthetic pathways [7]. Carbon isotopic composition is affected by the ratio of ambient and intercellular humidities and should therefore reflect changes in the energy budgets of leaves,
which are themselves influenced by stomatal conductance [8]. C3
plants growing under water-stressed conditions are expected to be enriched in13C compared to plants growing under optimal water conditions [8]. Indeed, negative correlations between mean annual precipitation (MAP) and d13C value of C
3 plants have been
demonstrated in a number of studies [5,9,10,11]. In contrast to C3
plants, thed13
C values of C4plants are expected to be less sensitive
to water stress [12]. Accordingly, no correlation between thed13
C values of C4 plants and water availability (e.g. precipitation) is
commonly observed [5,10,13].
The13C/12C ratios of soil organic matter (SOM) are influenced by both the relative abundance andd13
C values of C3 and C4
species as plants are the primary C sources of SOM. Therefore, thed13
C values of SOM in loess and paleosols can be used to extract paleoclimate and associated vegetation composition in-formation [10,14]. However, paleovegetation reconstruction using
d13
C of SOM could introduce errors without correction for the effects of precipitation on plantd13
C [10]. Plant and soil nitrogen isotopic composition (d15
N) is related to the environmental variables and availability of nutrients and water; therefore, it can be used as an indicator of ecosystem N cycling on different spatial and temporal scales [6,15]. The changes in d15
[5,13,20,21]. For example,d15
N in N2-fixing plant is expected to
be not sensitive to changes in precipitation [21,22].
Water availability, measured as rainfall, is argued to be the most influential factor affecting plantd13
C andd15
N in semi-arid and arid environments [5,11,15,21]. The relationships between rainfall and plant C and N isotopic composition have been demonstrated in many regions, but the sensitivity of plant C and N isotopic composition to variation in precipitation varies significantly among different locations and/or different species composition [10]. In this study, in order to eliminate the temperature influence and focus on precipitation effect, we examined large-scale patterns in
d13
C andd15
N of plant and soil organic matter across a regional precipitation gradient along an isotherm with mean annual temperature of 8uC in northern China (Fig. 1). Questions addressed include: what is the response of C and N isotopic signatures in both plant and soil to a precipitation gradient in northern China; how do C3and C4plants differ in their response
to changes in precipitation; and whether there are species specific differences in the response of stable carbon and nitrogen isotopic signatures to the precipitation gradient.
Results
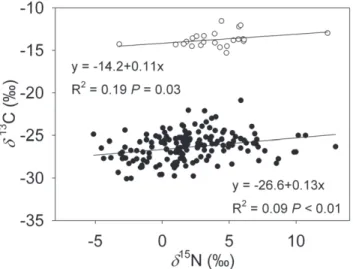
Plant Carbon and Nitrogen Stable Isotope Composition
The d13
C values of all samples ranged from 231.1% to
211.6%and fell into two distinct groups. Thed13
C values of C3
plants varied from231.1%to220.9%, while thed13
C values of C4plants had a much narrower range from215.3%to211.6%
(Table S1). The d15
N values of C3 and C4 plants ranged from 25.1%to 13.0%and from23.2%to 12.4%, respectively (Table S1). Although plant d13
C and d15
N values were significantly correlated, the model explained very little of the variation (Fig. 2;
R2,0.2,P,0.05). There were no significant differences between C3 and C4 photosynthetic pathways in the slope of linear
correlation (Table 1;P= 0.45).
Correlations between Mean Annual Precipitation and Plant Stable Isotope Composition
Significant negative correlations were found between plantd13
C values and mean annual precipitation in both C3(Fig. 3;R2= 0.35, P,0.01) and C4(Fig. 3;R2= 0.31,P,0.01) plants. The regression
slope of d13
C to precipitation (Table 1; P,0.01) in C3 plants
(20.660.07%/100 mm) was significantly greater than that of C4
plants (20.360.08%/100 mm).
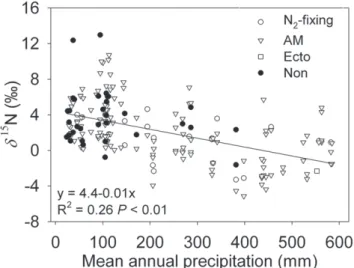
Plant d15
N showed a significantly negative correlation with precipitation (Fig. 4;R2= 0.26,P,0.01). The regression slope of
d15
N to precipitation is21.060.1%/100 mm. The d13
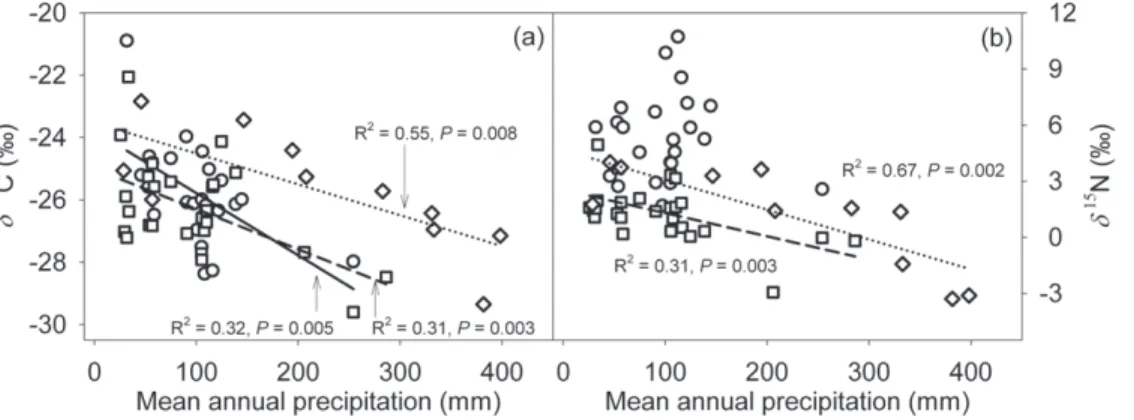
C value of three dominant C3 species was correlated
negatively with the amount of precipitation (Fig. 5a). There were no differences among Nitraria sibirica Pall., Reaumuria soongorica
d C and d N tended to decrease with increasing mean annual precipitation, but only the relationship between thed13
C values of soil organic matter and precipitation was significant (Fig. 6a;
R2= 0.17, P= 0.003). The response of soild13
C to precipitation amount is 20.460.1%/100 mm for the precipitation range of
25–600 mm. No significant correlations existed between d15
N values of soil organic matter and mean annual precipitation (Fig. 6b;R2= 0.012,P= 0.45).
Discussion
Carbon Isotopes
Plants balance their needs between CO2intake for
photosyn-thesis and conservation of water by adjusting the conductance of their leaf stomata. An increase in precipitation (water availability) would result in an increase in the stomatal conductance that in turn causes a decrease in the plant d13
C value [10,12]. For C3
species, significant negative correlation between plant d13
C and water availability, indicated by precipitation, has been observed in many regions [3,9,10,11,23,24,25,26]. Similarly, we observed that plant d13
C correlated negatively with MAP across a rainfall gradient ranging from 25 mm to 600 mm in northern China. The sensitivity ofd13
C response of C3plants to annual precipitation
(20.660.07%/100 mm) in our study was comparable with that reported for the Chinese Loess Plateau (20.7%/100 mm) [10].
Negative correlations between plant d13
C and MAP may have resulted from water availability associated variation in photosyn-thetic discrimination.
Some uncertainties still exist in the correlation betweend13
C of C4 plants and environmental factors. Depending on how much
CO2 and HCO3-in bundle sheath cells leak out into mesophyll
cells (w,leakiness), the response of C4 photosynthetic carbon
isotope discrimination to precipitation can be positive, zero or negative [27]. Positive correlations between C4 photosynthetic
carbon isotope discrimination and precipitation suggest wvalues above 0.34, aswwill affect the discrimination of Rubisco against
13
C [28,29]. In southern Africa, thed13
C values of C4plants are
not sensitive to changes in the MAP [5]. Van de Water et al. [3] reported a significant decrease ofd13
C value in a C4speciesAtriplex confertifoliawith elevation (precipitation increase with elevation) in the Southwest United States. Wang et al [30] found thatd13
C of C4 plants in the dry season was lower than in the wet season,
which suggests that there is a positive correlation betweend13C of
C4 plants and precipitation in the Loess Plateau of China. We
observed thatd13
C value of C4plants was negatively correlated
with MAP (20.360.08%/100 mm), which is comparable to the
results of Liu et al (20.43%/100 mm) [10]. Positive correlations between C4 photosynthetic carbon isotope discrimination and
precipitation suggest leakiness values above 0.34 [28,29], which were likely given the studied C4 plants are growing in
importance of leakiness in determining the response ofd13
C of C4
plants to environmental factors. The regression slope ofd13
C of C4
plants (20.360.08%/100 mm) on precipitation was much lower
than that of C3plants (20.660.07%/100 mm), which suggests
thatd13
C of C4plants is less sensitive to variation in environmental
water availability than that of C3plants.
The sensitivity of leafd13
C to changes in water availability also varies substantially among locations or C3 species. In eastern
Australia, leaf d13C of C
3 species exhibited significant negative
correlation with precipitation from 300 to 1700 mm [9], while in northern Australia, the response of plantd13
C to precipitation was shown only within a precipitation range from 200 to 450 mm, whereas average plant d13
C of sites remained constant between 450 and 1800 mm precipitation [13]. In addition, Miller et al [25] Figure 1. Location of study area in China.The thin solid dark blue lines are isolines of mean annual precipitation. Triangles are sampling sites. doi:10.1371/journal.pone.0051894.g001
Figure 2. Correlations betweend13C andd15N values of the studied C3 (filled circles) and C4 plants (open circles). Linear
regression equations,R2andPvalues are provided. doi:10.1371/journal.pone.0051894.g002
Table 1.Degrees of freedom (df), F andPvalues from slope comparison analysis to assess differences in sensitivity between C3and C4species, as well as among the three
studied shrubs:Nitraria sibirica(NS),Reaumuria soongorica
(RS) andHedysarum mongolicum(HM).
df F P
Sensitivity ofd13C to MAP C
3vs C4 1 7.78 ,0.01
NS vs RS 1 0.91 0.35
NS vs HM 1 1.39 0.25
RS vs HM 1 0.46 0.50
Sensitivity ofd15N to MAP NS vs RS 1 0.88 0.35
NS vs HM 1 2.05 0.16
RS vs HM 1 0.37 0.55
Correlation betweend13C and
d15N C3vs C4 1 0.72 0.45
studied a series of co-occurring and replacementEucalyptusspecies along a rainfall gradient in Australia, suggesting leaf carbon isotope discrimination in five of 13 species decreased with decreasing rainfall, seven exhibited no trend, and one increased. We found no differences in the sensitivity of leafd13
C to variation in precipitation among the three desert shrubs, 2 nonN2-fixing
plants (N. sibirica and R. soongorica) and a legume shrub H.
mongolicum. The observed sensitivity of leaf d13
C to MAP in the three shrubs was slightly higher than the result (21.1%/100 mm)
of a study conducted in arid northwest China [10]. The inconsistency may have resulted from both differences in sampling area and plant life forms. Liu et al. [10] collected the grass species from the precipitation range of 200–700 mm while we sampled desert shrubs within a precipitation range from 25 to 600 mm. Similar, or even slightly higher sensitivity of leaf d13
C to MAP between desert shrubs and grasses suggest desert shrubs are also very sensitive to changes in water availability.
Communityd13
C is a successful empirical predictor of water availability within the usual range of C3whole-leafd13C values. In
this context thed13
C signature can be used as an indicator of the environmental influences over plant function, especially at the community level.
Thed13
C value of soil organic matter reflects the relatively long-term isotopic composition of the standing biomass [14,32]. The
d13
C of the soil organic matter significantly increased from
223.3% in the southeast to 218% in the northwest along the declining precipitation gradient (Fig. 6a), which may have resulted from both increased plant d13
C values with decreasing pre-cipitation for the examined C3 and C4 species and enhanced
contribution of C4plants to soil organic carbon at the drier sites
(Fig. 3).
Nitrogen Isotopes
The observed mean leaf nitrogen isotope values are comparable to the published data set collected from the Loess Plateau of China [33] and Mount Kinabalu, Borneo [34]. The range of variation in leaf d15
N (25.1% to 13.0%) (Table S1) is greater than that in Chinese Loess Plateau [33] and Mount Kinabalu [34], however the observed shifts in leafd15
N are within the range of foliard15
N (from .210% to ,15%) reported by Craine et al. [21]. The observed large variation in leaf d15
N is possible given that we
sampled multiple plant species across a broad range of climate and ecosystem types.
The observed negative correlations between plant d15
N and precipitation (Fig. 4) are in agreement with the results of previous studies [5,11,15,17,18,33]. However, there are differences in the sensitivity of plantd15N to variation in mean annual precipitation.
In southern Africa, nitrogen isotope composition of C3plants was
significantly correlated with mean annual precipitation, with plant
d15
N values declining 0.68% with every 100 mm increased in precipitation [5]. Data from Zambia, Namibia and South Africa indicated that plant d15
N values declined 0.47% with every 100 mm increase in precipitation [18]. We observed a 1.060.1%
decrease in plant d15
N values with every 100 mm increase in precipitation, which is greater than the results of those studies conducted in Africa, but similar to the results obtained in the Chinese Loess Plateau [33].
Plantd15
N is related to the availability of nutrients and water; therefore, it is an indicator of N cycling on both spatial and temporal scales [5]. Under high N availability conditions, isotopically depleted N is preferentially lost from the ecosystem through the processes of NH3 volatilization, denitrification and
leaching of NO32, which results in an enrichment of soil N pools
in15N and subsequent increases in leaf d15
N. Conversely, plants growing under low N availability conditions are likely to depend on mycorrhizal fungi for N acquisition than at high N availability, plant N obtained via mycorrhhizal fungi is depleted in 15N [35,36]. The observed increase in plant and soil d15
N with decreasing MAP suggests the arid and semi-arid regions are more open in terms of their N cycling relative to those that are more humid [5], with higher N losses relative to turnover [2].
Plantd15
N values are determined by the availability, distribu-tion and isotopic signature of soil N sources, preferential uptake of isotopcially different N compounds, plant metabolic processes involved N fractionation, especially the formation of mycorrhizal symbiosis [19,36,37]. Plants fix C directly from the atmosphere, while they obtain N from soil or through a symbiotic relationship with N-fixing microorganisms [11], so soil processes can play an important role in plant isotopic signatures [17]. In a synthesis study, Craine et al. [21] observed that non-mycorrhizal plants are enriched in15N relative to species having mycorrhizal symbiosis. Figure 3. Plantd13C values (C
3, filled circles; C4, open circles) as a function of mean annual precipitation. Linear regression equations,R2andPvalues are provided.
doi:10.1371/journal.pone.0051894.g003
Figure 4. Plantd15N values (N2-fixing, open circles; AM, open triangles; Ecto, open squares; Non, filled circles) as a function of mean annual precipitation.Linear regression equations,R2andP
values are provided.
Moreover, plant d15
N differed among mycorrhizal types, with
d15
N in arbuscular mycorrhizal plants greater than ectomycor-rhizal plants. In our study, we observed that the averaged15
N in non-mycorrhizal plants (3.6%) is greater than mycorrhizal plants (1.9%), which is in agreement with the result of Craine et al. [21].
Lower d15
N values in mycorrhizal plants suggests mycorrhizal fungi create 15N-depleted compounds that are subsequently transferred to host plants [36].
The d15
N values of H. mongolicum (21.660.4%/100 mm;
R2= 0.67,P= 0.002) showed the most significant correlation and the steepest regression slope across the precipitation gradient than that of the other two speciesR. soongarica (21.260.4%/100 mm;
R2= 0.31, P= 0.003) and N. sibirica (20.361.1%/100 mm;
R2= 0.002, P= 0.827), which is contrary to our prediction. Legume species obtain their N through symbiotic N2-fixing
bacteria, therefore the d15
N of N2-fixing plants might be
independent of climate and not reflect soil processes [21,22]. However, the observed significant correlation between leafd15
N and MAP in legume speciesH. mongolicumsuggests potential shift in the reliance of legume species on N2-fixing bacteria as N source in
high nitrogen availability habitats.
We observed no significant correlation betweend15
N values of soil organic matter and mean annual precipitation, which is inconsistent with the results of previous studies [15,18,33]. Strong negative correlations of d15
N values of soil organic matter and mean annual precipitation have been observed in the Chinese Loess Plateau (1.31%/100 mm) [33] and in the Kalahari region of
southern Africa (0.56%/100 mm) [18]. In general,d15
N values of soils and plants depleted with increasing precipitation suggests that accumulated losses of nitrogen relative to pools are greater in the drier sites. Nitrogen cycling is more open in drier sites and becomes less open with increasing precipitation [2]. Although N cycling on a regional scale involves numerous and complex processes, our study showed that spatial variability of precipitation play a significant role on isotopic signatures and the N cycle in the soil-plant system [18].
The correlation between precipitation gradient and community-averaged plant C and N isotope values provide insights into the cycling of terrestrial N and water status of plants in response to climatic change. Given that plant isotope value is a biological expression of environmental conditions integrated over time, it may indeed provide us a more meaningful measure of water availability than rainfall data [9]. In this respect, we can argue that the d13
C and d15
N of plants might be used as an indicator of environmental influences on plant functioning, and further evaluate how plants respond to their habitats.
In conclusion, along the precipitation gradient with an isotherm in northern China,d13
C andd15
N values of C3and C4plants were
significantly negatively correlated with MAP. Thed13
C values of C3plants are more sensitive to variation in MAP thand13C values
of C4plants. There were no species differences in the sensitivity of
plantd13
C andd15
N to MAP among three dominant speciesH. mongolicum, R. soongarica and N. sibirica. The d13
C values of soil organic matter became significantly more depleted with increasing Figure 5. Leafd13C (a) andd15N (b) values as a function of mean annual precipitation inNitraria sibirica(circle, solid line),Reaumuria
soongorica(square, dash line) andHedysarum mongolicum(diamond, dotted line).R2and P values of linear correlations are provided. doi:10.1371/journal.pone.0051894.g005
Figure 6. Soil organic matterd13C (a) andd15N (b) values as a function of mean annual precipitation.Linear regression equations,R2and
Pvalues are provided.
113u429(Fig. 1). The climate of the study area is temperate arid and semi-arid. The dominant control over the amount of precipitation is the strength of East Asian monsoon system, which is mostly accompanied with cool, dry winters and hot, wet summers, with most of the rain falling in the summer season [38]. From southeast to northwest of the study area, the amount of annual rainfall decreases from 600 mm to 25 mm along an isotherm of 8uC. The meteorological data were obtained from the Cold and Arid Regions Environmental and Engineering Research Institute, Chinese Academy of Sciences. The vegetation is dominated by shrubs and grasses of both C3 and C4 plants in
this region. In general, the vegetation of the study area changes progressively from forest steppe, dry steppe to desert steppe with decreasing precipitation [39].
Field Sampling
In September 2006, leaf and soil samples were collected from 64 sites along the southeast to northwest precipitation gradient with an isotherm (Fig. 1). Detailed information of the sampling sites, including location, vegetation and precipitation is provided in Table S1. In each sampling site, fully expanded leaves of each dominant species were collected from three different individuals 5 m apart from each other and pooled into one sample. During the sampling period, most of the sampled plant species were at their late growing stage. Leaf samples were air-dried in the field, rinsed and oven-dried to a constant weight at 60uC in the laboratory, and finely ground with a ball mill. During the field campaign, 576 individuals of 31 dominant species were collected. Soil samples at a depth of 2–3 cm were collected using a corer (wiping off the superficial soil in 0.5 cm depth) from each of the 64 sampling sites. For each sampling site, three soil samples (each has a volume about 100 ml) were collected and pooled into one sample. The soil samples were passed through a 2 mm sieve to remove roots and gravels. Subsamples of the sieved soil were ground to a fine powder in a mortar and pestle, acidified in 6N HCl to remove coexisting carbonate, rinsed in deionized H2O,
and dried through lyophilization [40]. Ground leaf samples and
XP continuous flow inlet isotope ratio mass spectrometer attached to a Costech EA 1108 Element Analyzer at the University of Wyoming Stable Isotope Facility. Precision of repeated measure-ments of laboratory standard was ,0.1%. d13
C values are reported relative to V-PDB andd15
N to AIR in parts per thousand (%) as:
dX~ Rsample
Rstandard{
1
whereX~13Cor15N andR~13C=
12 Cor15
N=14N [41].
Statistical Analyses
Simple linear regression analyses were used to estimate relationships between mean annual precipitation andd13
C and
d15
N values of leaf and soil. All statistical analyses were carried out using SAS version 9.0 (SAS Institute Inc. Cary, NC, USA).
Supporting Information
Table S1 Sample sites information (Location, Altitude, Mean annual precipitation, Vegetation type and collected species) being presented.
(DOC)
Acknowledgments
We sincerely thank two anonymous reviewers for their helpful comments on earlier drafts of this manuscript which greatly improved this paper. We also thank Prof. Dunsheng Xia and Dr. Haitao Wei (Key Laboratory of Western China’s Environmental Systems, Ministry of Education, Lanzhou University) for their comments and assistance in field work.
Author Contributions
Conceived and designed the experiments: JYM WS FHC. Performed the experiments: JYM XNL WS. Analyzed the data: JYM WS XNL. Contributed reagents/materials/analysis tools: JYM WS. Wrote the paper: JYM WS XNL FHC.
References
1. Huxman TE, Snyder KA, Tissue D, Leffler AJ, Ogle K, et al. (2004) Precipitation pulses and carbon fluxes in semiarid and arid ecosystems. Oecologia 141: 254–268.
2. Austin AT, Vitousek PM (1998) Nutrient dynamics on a precipitation gradient in Hawai’i. Oecologia 113: 519–529.
3. Van de Water PK, Leavitt SW, Betancourt JL (2002) Leafd13
C variability with elevation, slope aspect, and precipitation in the southwest United States. Oecologia 132: 332–343.
4. Wittmer MHOM, Auerswald K, Bai YF, Schaufele R, Schnyder H (2010) Changes in the abundance of C3/C4 species of Inner Mongolia grassland: evidence from isotopic composition of soil and vegetation. Global Change Biology 16: 605–616.
5. Swap RJ, Aranibar JN, Dowty PR, Gilhooly WP, Macko SA (2004) Natural abundance of13C and15N in C3and C4vegetation of southern Africa: patterns and implications. Global Change Biology 10: 350–358.
6. Dawson TE, Mambelli S, Plamboeck AH, Templer PH, Tu KP (2002) Stable isotopes in plant ecology. Annual Review of Ecology and Systematics 33: 507– 559.
7. O’Leary MH (1981) Carbon isotope fractionation in plants. Phytochemistry 20: 553–567.
8. Farquhar GD, Sharkey TD (1982) Stomatal Conductance and Photosynthesis. Annual Review of Plant Physiology and Plant Molecular Biology 33: 317–345. 9. Stewart GR, Turnbull MH, Schmidt S, Erskine PD (1995) 13
10. Liu WG, Feng XH, Ning YF, Zhang QL, Cao YN, et al. (2005)d13 C variation of C3 and C4 plants across an Asian monsoon rainfall gradient in arid northwestern China. Global Change Biology 11: 1094–1100.
11. Hartman G, Danin A (2010) Isotopic values of plants in relation to water availability in the Eastern Mediterranean region. Oecologia 162: 837–852. 12. Farquhar GD, O’Leary MH, Berry JA (1982) On the relationship between
carbon isotope discrimination and the intercellular carbon dioxide concentration in leaves. Australian Journal of Plant Physiology 9: 121–137.
13. Schulze ED, Williams RJ, Farquhar GD, Schulze W, Langridge J, et al. (1998) Carbon and nitrogen isotope discrimination and nitrogen nutrition of trees along a rainfall gradient in northern Australia. Australian Journal of Plant Physiology 25: 413–425.
14. Balesdent J, Girardin C, Mariotti A (1993) Site-relatedd13
C of tree leaves and soil organic matter in a temperate forest. Ecology 74: 1713–1721.
15. Amundson R, Austin AT, Schuur EAG, Yoo K, Matzek V, et al. (2003) Global patterns of the isotopic composition of soil and plant nitrogen. Global Biogeochemical Cycles 17: 1–10.
16. Aranibar JN, Anderson IC, Epstein HE, Feral CJW, Swap RJ, et al. (2008) Nitrogen isotope composition of soils, C3and C4plants along land use gradients in southern Africa. Journal of Arid Environments 72: 326–337.
17. Handley LL, Austin AT, Robinson D, Scrimgeour CM, Raven JA, et al. (1999) The15N natural abundance (d15
N) of ecosystem samples reflects measures of water availability. Australian Journal of Plant Physiology 26: 185–199. 18. Aranibar JN, Otter L, Macko SA, Feral CJW, Epstein HE, et al. (2004) Nitrogen
cycling in the soil-plant system along a precipitation gradient in the Kalahari sands. Global Change Biology 10: 359–373.
19. Handley LL, Raven JA (1992) The use of natural abundance of nitrogen isotopes in plant physiology and ecology. Plant Cell and Environment 15: 965–985. 20. Spear RW, Davis MB, Shane LCK (1994) Late Quaternary History of
Low-Elevation and Mid-Low-Elevation Vegetation in the White Mountains of New-Hampshire. Ecological Monographs 64: 85–109.
21. Craine JM, Elmore AJ, Aidar MPM, Bustamante M, Dawson TE, et al. (2009) Global patterns of foliar nitrogen isotopes and their relationships with climate, mycorrhizal fungi, foliar nutrient concentrations, and nitrogen availability. New Phytologist 183: 980–992.
22. Hogberg P (1997) Tansley review No 95 - N-15 natural abundance in soil-plant systems. New Phytologist 137: 179–203.
23. Anderson JE, Williams J, Kriedemann PE, Austin MP, Farquhar GD (1996) Correlations between carbon isotope discrimination and climate of native habitats for diverse eucalypt taxa growing in a common garden. Australian Journal of Plant Physiology 23: 311–320.
24. Korol RL, Kirschbaum MUF, Farquhar GD, Jeffreys M (1999) Effects of water status and soil fertility on the C-isotope signature inPinus radiata. Tree Physiology 19: 551–562.
25. Miller JM, Williams RJ, Farquhar GD (2001) Carbon isotope discrimination by a sequence of Eucalyptus species along a subcontinental rainfall gradient in Australia. Functional Ecology 15: 222–232.
26. Ma JY, Chen K, Xia DS, Wang G, Chen FH (2007) Variation in foliar stable carbon isotope among populations of a desert plant,Reaumuria soongorica(Pall.) Maxim. in different environments. Journal of Arid Environments 69: 365–374. 27. Farquhar GD, Ehleringer JR, Hubik KT (1989) Carbon isotope discrimination and photosynthesis. Annual Reviews of Plant Physiology and Plant Molecular Biology 40: 503–537.
28. Farquhar GD (1983) On the nature of carbon isotope discrimination in C4 species. Australian Journal of Plant Physiology 10: 205–226.
29. Hattersley PW (1982)d13
C values of C4types in grasses. Australian Journal of Plant Physiology 9: 139–154.
30. Wang GA, Han JM, Zhou LP, Xiong XG, Wu Z (2005) Carbon isotope ratios of plants and occurrences of C-4 species under different soil moisture regimes in arid region of Northwest China. Physiologia Plantarum 125: 74–81. 31. Williams DG, Gempko V, Fravolini A, Leavitt SW, Wall GW, et al. (2001)
Carbon isotope discrimination bySorghum bicolorunder CO2enrichment and drought. New Phytologist 150: 285–293.
32. Amundson R, Francovizcaino E, Graham RC, Deniro M (1994) The relationship of precipitation seasonality to the flora and stable-isotope chemistry of soils in the Vizcaino desert, Baja-California, Mexico. Journal of Arid Environments 28: 265–279.
33. Liu WG, Wang Z (2009) Nitrogen isotopic composition of plant-soil in the Loess Plateau and its responding to environmental change. Chinese Science Bulletin 54: 272–279.
34. Kitayama K, Iwamoto K (2001) Patterns of natural15
N abundance in the leaf-to-soil continuum of tropical rain forests differing in N availability on Mount Kinabalu, Borneo. Plant and Soil 229: 203–212.
35. Neff JC, Chapin FS, Vitousek PM (2003) Breaks in the cycle: dissolved organic nitrogen in terrestrial ecosystems. Frontiers in Ecology and the Environment 1: 205–211.
36. Hobbie EA, Colpaert JV (2003) Nitrogen availability and colonization by mycorrhizal fungi correlate with nitrogen isotope patterns in plants. New Phytologist 157: 115–126.
37. Robinson D, Handley LL, Scrimgeour CM (1998) A theory for 15N/14N fractionation in nitrate-grown vascular plants. Planta 205: 397–406. 38. Ding YH (1994) Monsoons over China. Kluwer Academics Publishers,
Dordrecht.
39. Wang T (2003) Desert and desertification in China. Hebei Science and Technology Press, Shijiazhuang.
40. Midwood AJ, Boutton TW (1998) Soil carbonate decomposition by acid has little effect ond13
C of organic matter. Soil Biology & Biochemistry 30: 10–11. 41. Coplen TB (2011) Guidelines and recommended terms for expression of