www.atmos-chem-phys.net/11/9735/2011/ doi:10.5194/acp-11-9735-2011
© Author(s) 2011. CC Attribution 3.0 License.
Chemistry
and Physics
Correlation of black carbon aerosol and carbon monoxide in the
high-altitude environment of Mt. Huang in Eastern China
X. L. Pan1,2, Y. Kanaya1, Z. F. Wang2, Y. Liu3, P. Pochanart4, H. Akimoto5, Y. L. Sun2, H. B. Dong2, J. Li2, H. Irie1,
and M. Takigawa1
1Research Institute for Global Change, Japan Agency for Marine-Earth Science and Technology, Japan
2State Key Laboratory of Atmospheric Boundary Layer Physics and Atmospheric Chemistry, Institute of Atmospheric Physics, Chinese Academy of Sciences, Beijing, China
3Institutes of Atmospheric Physics, Chinese Academy of Sciences, Beijing, China
4School of Social and Environmental Development, National Institute of Development Administration, Bangkok, Thailand 5Acid Depositions and Oxidant Research Center, Asia Center for Air Pollution Research, Japan
Received: 6 January 2011 – Published in Atmos. Chem. Phys. Discuss.: 8 February 2011 Revised: 9 August 2011 – Accepted: 17 August 2011 – Published: 20 September 2011
Abstract.Understanding the relationship between black car-bon (BC) and carcar-bon monoxide (CO) will help improve BC emission inventories and the evaluation of global/regional climate forcing effects. In the present work, the BC (PM1) mass concentration and CO mixing ratio were continuously measured at a high-altitude background sta-tion on the summit of Mt. Huang (30.16◦N, 118.26◦E, 1840 m a.s.l.). Annual mean BC mass concentration was 1004.5±895.5 ng m−3with maxima in spring and autumn, and annual mean CO mixing ratio was 424.1±159.2 ppbv. A large increase of CO was observed in the cold sea-son, implying the contribution from the large-scale domes-tic coal/biofuel combustion for heating. The BC-CO rela-tionship was found to show different seasonal features but strong positive correlation (R >0.8). In Mt. Huang area, the1BC/1CO ratio showed unimodal diurnal variations and had a maximum during the day (09:00–17:00 LST) and min-imum at night (21:00–04:00 LST) in all seasons, indicating the impact of planetary boundary layer and the intrusion of clean air masses from the high troposphere. Back tra-jectory cluster analysis showed that the1BC/1CO ratio of plumes from the Eastern China (Jiangsu, Zhejiang provinces and Shanghai) was 8.8±0.9 ng m−3ppbv−1. Transportation and industry were deemed as controlling factors of the BC-CO relationship in this region. The 1BC/1CO ratios for air masses from Northern China (Anhui, Henan, Shanxi and Shandong provinces) and southern China (Jiangxi, Fujian
Correspondence to:X. L. Pan ([email protected])
and Hunan provinces) were quite similar with mean values of 6.5±0.4 and 6.5±0.2 ng m−3ppbv−1 respectively. The case studies combined with satellite observations demon-strated that the1BC/1CO ratio for biomass burning (BB) plumes were 10.3±0.3 and 11.6±0.5ng m−3ppbv−1, sig-nificantly higher than those during non-BB impacted peri-ods. The loss of BC during transport was also investigated on the basis of the1BC/1CO-RH (relative humidity) rela-tionship along air mass pathways. The results showed that BC particles from Eastern China area was much more eas-ily removed from atmosphere than other inland regions due to the higher RH along transport pathway, implying the im-portance of chemical compositions and mixing states on BC residence time in the atmosphere.
1 Introduction
al., 2008; Kuwata et al., 2009; Liu et al., 2009). Fine-mode BC particles increase the regional atmospheric opacity (Sein-feld, 2008) and have detrimental health effects (Oberd¨orster and Yu, 1990). Severe environmental problems such as the acceleration of glacier melting have been found to be asso-ciated with BC deposition on snow surfaces (Ming et al., 2008; Ramanathan and Carmichael, 2008; Ming et al., 2009; Thevenon et al., 2009). Recently, observations and modeling have increasingly suggested a relatively strong positive cli-mate forcing effect of black carbon. BC forcing at the top-of-atmosphere was estimated to be as much as 55 % of the CO2 forcing with a mean value of 0.9 W m−2(and range from 0.4 to 1.2 W m−2)(Ramanathan and Carmichael, 2008). The ex-tent of BC-induced warming is highly determined by the at-mospheric loading of soot particle mass concentrations (Sato et al., 2003), sulfate and organic coatings (Ramana et al., 2010), their shapes (Adachi et al., 2010) and mixing state (Jacobson, 2001; Schwarz et al., 2008; Naoe et al., 2009).
Significant emissions of pollutants (e.g., BC and CO) in East Asia due to ever-quickening industrial development, surging automobile ownership, and intensive seasonal burn-ing of biomass are well known (Streets et al., 2001; Bond et al., 2004; Streets and Aunan, 2005; Zhang et al., 2009). Bottom-up statistical methods, widely used to investigate regional emission inventories (Streets et al., 2001; Cao et al., 2006; Ohara et al., 2007), indicate that more than one-fourth of BC originates from China; however, variations in the emission strengths of different fuel types and com-bustion conditions produce large uncertainties (Bond et al., 2004). Long-term measurements of BC in highly polluted and remote areas are of importance for a better estimating regional characteristics (Wang et al., 2006) and constraining the highly uncertain emission rate of BC (Kondo et al., 2006; Han et al., 2009). Carbon monoxide (CO) is another by-product of the incomplete oxidation. A remarkable correla-tion between BC and CO has been found in a number of stud-ies (Jennings et al., 1996; Derwent et al., 2001; Badarinath et al., 2007; Spackman et al., 2008), which make1BC/1CO (BC minus background BC, and CO minus background CO) as a good indicator both for distinguishing different pollutant sources in case studies (Kondo et al., 2006; Spackman et al., 2008; Han et al., 2009; Subramanian et al., 2010) and val-idating BC emission inventories for models (Derwent et al., 2001; Dickerson et al., 2002). In present work, we mainly fo-cus on the BC-CO relationships from anthropogenic sources in Eastern China (Sect. 4) based on concurrently measured BC and CO mass concentrations at Mt. Huang. Seasonal and diurnal variations of BC and CO (Sect. 3) are reported, and the impact of biomass burning on BC-CO relationship (Sect. 5), and factors affecting BC-CO relationship (Sect. 6) are discussed. Photochemical production of CO through oxi-dation of CH4 and other volatile organic compounds, com-paratively smaller than direct anthropogenic emissions in East Asia, would not be addressed in this study.
2 Experimental
2.1 Site description and meteorology
BC and CO concentrations were continuously measured at a meteorological station on the summit of Mt. Huang (30.16◦N, 118.26◦E, 1840 m a.s.l., Anhui province). The site is located at the southern edge of the North China Plain, a heavy polluted region owing to its intense indus-trial/residential activities (Li et al., 2008) and open burning of biomass during harvest seasons (Yamaji et al., 2010). Pol-lution emitted from the Yangtze River Delta metropolis clus-ters (about 200 km to the northeast) was also easily trans-ported to the site with the prevailing northeast wind. Ac-cording to the NASA INTEX-B emission inventory (Zhang et al., 2009), about 4585 Gg yr−1PM2.5, 607 Gg yr−1BC and
61210 Gg yr−1CO were emitted in 2006 via anthropogenic activity in the region of the North China Plain, accounting for more than 35 % of total emissions in China. According to bottom-up statistical techniques, emission of BC and CO were usually constructed on the basis of energy consump-tions from different economic sectors and available experi-mental emission factors (Streets et al., 2001; Cao et al., 2006; Zhang et al., 2009). A map of 1BC/1CO ratio for East China was shown in Fig. 1. Other considerations in the site selection were that the region was uninhabited, the surround-ing 1500 km2had over 80 % vegetation coverage of decidu-ous/coniferous mixed forest and grass, and local-source pol-lution produced by tourists was very limited. Mt. Huang has a subtropical monsoon climate, distinct seasons and abundant rainfall in summer (peaking in July). According to statis-tical analysis of 48-hour air mass back trajectories (Hysplit4 version 4.9u, http://ready.arl.noaa.gov/HYSPLIT.php), about 38 %, 45 % and 17 % of air mass were from northerly (NE– W section), southerly (W-ESE section) and easterly (ESE-NE section) directions, respectively. This obvious difference in air mass pathways allowed investigation of the origins and transport of pollutants.
2.2 Measurements and error analysis
45
40
35
30
25
20
Latitude
125 120
115 110
105 100
Longitude BJ HEB
SD
JS
ZJ FJ GD
HUN HUB
JX AH HEN SX
SC
SNX
GZ GX HLJ
SHA 20
10 0
BC/CO ratio (ng/m3/ppbv)
Fig. 1. Spatial distribution of1BC/1CO ratio with grid
resolu-tion of (0.5◦×0.5◦) from INTEX-B anthropogenic emission
inven-tory. The black circles indicate the location of the observation site.
Correspondingly 1BC/1CO ratios are converted from Gg Gg−1
to ng m−3ppbv−1by assuming that in Standard Temperature and
Pressure condition. Abbreviations in the plot are BJ (Beijing), HEB (Hebei), SX (Shanxi), SD (Shandong), HEN (Henan), JS (Jiangsu), SNX (Shaanxi), HUB (Hubei), SC (Sichuan), SH (Shanghai), AH (Anhui), HUN (Hunan), JX (Jiangxi), ZJ (Zhejiang), FJ (Fujian), GD (Guangdong), GX (Guangxi), and GZ (Guizhou).
fixedσapvalue of 6.6 m2g−1at 637 nm to convert the absorp-tion coefficient to mass concentraabsorp-tion following the manu-facture’s recommendations. Although the calculation for the present instrument (MAAP) already took into account cor-rections for removing the multi-scattering effect, this tech-niques could still overestimated the BC mass concentration by 5–50 % due to coating effects of non-absorbing particles on soot particles (Hitzenberger et al., 2006; Slowik et al., 2007; Chow et al., 2009). The largest discrepancy has been found to be associated with the contributions of “brown car-bon” (Reisinger et al., 2008). According to inter-comparison experiments performed at a high mountain site over central Eastern China (Kanaya et al., 2008), the MAAP-measured BC mass concentration in fine mode (<1 µm) was approx-imately the same as that measured by the particle soot ab-sorption photometer (PSAP, Radiance Research, with inlet heated at 400◦C). Nevertheless, the concentration was ap-proximately 40 % higher than that obtained using an ECOC semi-continuous analyzer (Sunset Laboratory, USA, NIOSH protocol). We divided the all BC data with a factor of 1.4 in converting the MAAP-measured BC mass concentration to an “EC” category. Therefore the expression of “BC” from
our observation was exactly referred to ECa which opera-tionally defined as the fraction of carbon that is oxidized above a certain temperature threshold in the presence of an oxygen containing atmosphere (Andreae and Gelencs´er, 2006). Studies carried out in Tokyo (Kondo et al., 2006) showed that mass concentrations based on the NIOSH proto-col were about 20 % less than those based on the IMPROVE protocol, and the uncertainty in the absorbance determined using the MAAP was estimated to be 12 % (Petzold et al., 2005); therefore, the overall uncertainty was about 25 %.
In situ measurement of the CO mixing ratio was carried out with a commercial gas filter non-dispersive infrared CO gas analyzer (Thermo Scientific. Model 48C, USA, time res-olution of 1 min; detection limit: 30 ppbv for a 2-min av-erage) equipped with a Nafion dryer to reduce interference by water vapor in the sampled air. The zero point (base-line of the instrumental signal) was routinely checked in the first 10 min of each hour using purified air, and span cal-ibrations were performed in the ambient environment be-fore (May 2006) and in the middle of the field experiments (December 2007) by injecting standard span gas (1.04 parts per million by volume (ppmv), produced by Nissan-Tanaka Corp., Japan). The difference between the span and zero points demonstrated that the measured CO mixing ratio was about 46 ppbv higher than the standard value, and the ratio was adjusted by 95 % afterward. The instrument baseline in the observation period has a stable linear increasing trend with a drift ratio of 0.4 ppb h−1; however, this influence was easily removed by zero-point-deduction operations in subse-quent data procedures. The overall uncertainty was estimated to be 5 %. Additional meteorological parameters (wind, RH and temperature) were acquired from the NCEP reanal-ysis dataset (ftp://ftp.cdc.noaa.gov/Datasets/ncep.reanalreanal-ysis/ surface/) with a time interval of 6 h at the site grid.
3 BC and CO temporal variations
3.1 Seasonal variations
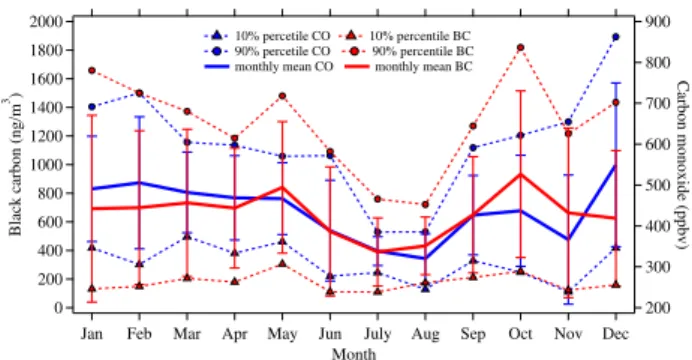
shifting of air masses from the clean continent interior and heavily polluted urban plumes in the heating period (nor-mally from November to March in Northern China). In summer, the CO concentration in the Mt. Huang region ap-parently decreased owing to frequent intrusions of clean air mass from the Pacific Ocean, and this seasonal trend was confirmed by observations in Eastern China made by MO-PITT (http://www.acd.ucar.edu/mopitt/). A slight reduction in the CO concentration with large variations in November might relate to the uncertainty of having a limited number of data (N=720) because no obvious changes in pollutant emissions were expected for that season. Seasonal varia-tions in the BC loading show a bimodal distribution with two enhancement periods of BC loading in May and October, consistent with the large-scale burning of crop residues in these two months. The exacerbation of BC pollution proba-bly resulted from the combustion of biomasses. Considering the regional climatology, the increase in the BC concentra-tion was also related to the dynamic transport and planetary boundary layer (PBL) evolution characteristics in the tran-sitional periods of the summer monsoon (May) and winter monsoon (October). In summer (from June to August), the BC concentration decreased to 319.5 (±225.0) ng m−3, and back trajectory analysis indicated that more than 80 % of air mass in that season came from southern China where the BC emission was relatively weak than north China plain (Streets et al., 2001; Cao et al., 2006, 2009; Chen et al., 2009). Wet removal was another key factor of BC declination, albeit there was summer strong thermal vertical convection and the full development of the PBL, which was favorable for uplift-ing surface pollutants to the high-altitude environment. In winter and spring, monthly mean BC mass concentrations were relatively stable with a mean value of 486.9 ng m−3the large variations (standard deviation of 372.4 ng m−3)mostly resulted from meteorology (PBL stratification, turbulence and transportation) and regional pollutant emissions in sur-rounding regions.
3.2 Diurnal variations
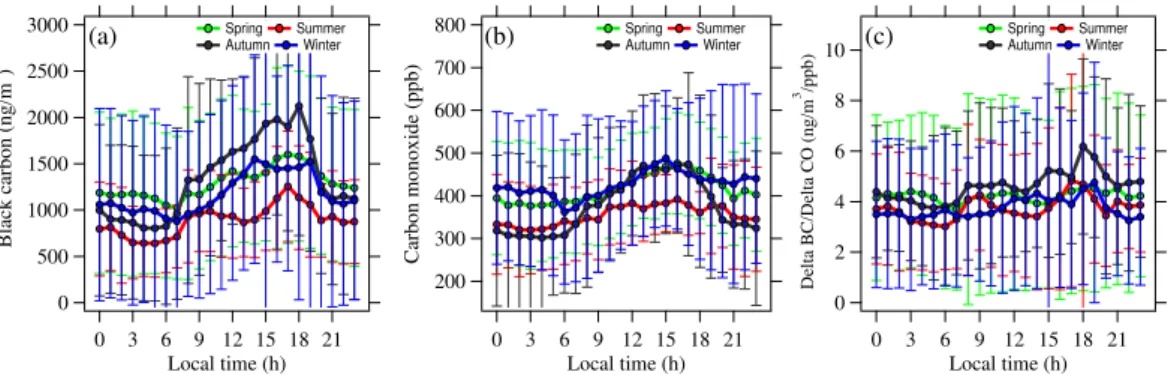
Diurnal variations in BC, CO and 1BC/1CO at ob-servation site in dry condition (RH<40 %) were shown in Fig. 3. As expected, BC showed pronounced uni-modal distributions with generally higher concentrations in the afternoon (1200∼1600 Local Standard Time (LST)) owing to the development of the PBL and pol-lution lifting with the valley breeze during the day; the BC concentrations in the daytime (09:00–16:00 LST) were 1359.4±801.8 ng m−3, 961.9±438.9 ng m−3, 1662.8±918.7 ng m−3and 1300.3±1179.9 ng m−3 respec-tively for spring (March–May), summer (June–August), autumn (September–November) and winter (December, January and February), respectively as shown in Fig. 3a. With suppression of the PBL at night (18:00∼06:00 LST), the BC concentrations at the site decreased to 1164.0 ng m−3
900 800 700 600 500 400 300 200
Carbon monoxide (ppbv)
Jan Feb Mar Apr May Jun July Aug Sep Oct Nov Dec Month
2000 1800 1600 1400 1200 1000 800 600 400 200 0
Black carbon (ng/m
3 )
10% percetile CO 10% percentile BC 90% percetile CO 90% percentile BC monthly mean CO monthly mean BC
Fig. 2. Seasonal variations in BC (red) and CO (blue)
concentra-tions during the observation period. Circles and triangles represent 90 % and 10 % percentiles of hourly mean BC and CO concentra-tions respectively. Error bars are also plotted in the figure to indicate monthly variations.
on average in spring, autumn and winter and 822.9 ng m−3 in summer. This pattern was different from that in the urban area where higher BC and CO concentrations reach to maximum in the early morning due to the traffic emissions and shallow boundary layer. In winter the BC concentration peaked earlier at approximately 1500 LST, and decreased quickly afterward owing to the short duration of sunshine. Diurnal variations in CO have seasonal features. As shown in Fig. 3b, fluctuations in the CO concentration were weaker in winter and summer than in other seasons; the mean mixing ratios were 426.4±29.4 and 354.7±23.1 ppbv respectively. As seen in the figure, relatively high CO atmosphere loadings in winter time was observed, which might be due to large-scale fossil fuels burning for heating in Northern China. In summer the stable and lower CO loading were strongly related to the strong mixing of clean air masses from marine regions and urban plumes within the PBL. In autumn, the CO concentration increased obvi-ously from 332.3±167.0 ppbv at night (18:00-06:00 LST) to a maximum (473.7±214.2 ppbv) in the afternoon (17:00 LST).
The correlation of BC-CO indicated pollution from cer-tain source categories. In this study, the1BC/1CO ratio was derived using the equation (BC-BC0)/(CO-CO0). CO0 (baseline concentrations of CO) were determined as values of the 1.25 percentile of data for spring, summer, autumn and winter, and the results were 109.21, 118.71, 90.81 and 116.1 ppbv for CO0respectively. This criterion was applied to investigate the1BC/1CO variations in Tokyo, and also Beijing (Kondo et al., 2006; Han et al., 2009). BC0, the background of BC concentration was assumed as zero. The
800 700 600 500 400 300 200
Carbon monoxide (ppb)
21 18 15 12 9 6 3 0
Local time (h) 3000
2500 2000 1500 1000 500 0
Black carbon (ng/m
3 )
21 18 15 12 9 6 3 0
Local time (h)
(a) (b) 10
8 6 4 2 0
Delta BC/Delta CO (ng/m
3 /ppb)
21 18 15 12 9 6 3 0
Local time (h) (c)
Spring Summer
Autumn Winter
Spring Summer
Autumn Winter
Spring Summer
Autumn Winter
Fig. 3.Diurnal variations of BC, CO and1BC/1CO for spring, summer, fall and winter time. In the plot, only data with RH less than 40 %
at observation site are taken into considerations. Spring comprises March, April and May; summer comprises June, July and August; autumn comprises September, October and November; and winter comprises December, January, February.
variations of1BC/1CO at urban sites were quite different from this study. In Beijing a high 1BC/1CO ratio peak (approximately 8 ng m−3ppbv−1in the very early morning) was observed due to increased emission from heavy vehicles with diesel engines (Kondo et al., 2006; Han et al., 2009). With gradually cease of heavy duty transportation activities in the urban site and increase of gasoline engine vehicles,
1BC/1CO ratio gradually decreased till∼14:00 LT in the afternoon. On the contrary,1BC/1CO ratio at Mt. Huang was relatively lower at night owing to intrusion of clean air from the tropopause, and increasing with the development of PBL which transport pollution upwardly at day time. The
1BC/1CO ratio measured at top of mountain was almost well mixed from different emission sources owing to con-vections.
4 Cluster analysis of regional BC and CO correlations
To investigate the relationship between the1BC/1CO ratio and the origin of the air mass, 48-hour back trajectory analy-sis was performed with ensemble approach. For each hour 27 back trajectories with horizontal offset of 1 grid and vertical shift of 0.01 in sigma unit were calculated in the meantime. Input meteorological fields were produced by NCEP Global Data Assimilation System (GDAS) model for four times a day at 00:00, 06:00, 12:00 and 18:00 UTC, the grid resolu-tion was 1◦×1◦. To eliminate the effect of local wet re-moval, only BC data for which ambient RH was less than 40 % for their entire air mass pathway were included in the calculations. Normally emission at surface was of particular interest, therefore only the back trajectories passed through mixing layer (determined by Hysplit model), were applied into cluster calculations. Furthermore we also removed the period when number of hotspots detected by MODIS satel-lite over 10 in the footprint regions. All back trajectory air mass pathways were grouped into three clusters. Cluster #1 indicated air masses from north China and moved across heavily polluted regions in Shanxi, Hebei, Henan and
Shan-dong provinces (Fig. 4a); air masses in Cluster #2 mainly came from eastern sector and passed through densely popu-lated urban area in Eastern China regions (Jiangsu, Zhejiang provinces and Shanghai, Fig. 4b). Cluster #3 comprised the air masses originated from southern of China (Jiangxi, Fujian and Hunan provinces, Fig. 4c). In Fig. 4, cities with popula-tion over 1 million were also presented for each cluster, and the size of circles was proportional to the yearly mean PM10 mass concentrations which derived from daily API values for 85 Chinese cities using the government-published routine method as described by Qu et al. (2010).
20 25 30 35 40 45 50
Latitude(deg)
100 105 110 115 120 125 130 Longitude(deg)
20 25 30 35 40 45 50
Latitude(deg)
100 105 110 115 120 125 130 Longitude(deg)
20 25 30 35 40 45 50
Latitude(deg)
100 105 110 115 120 125 130 Longitude(deg)
(a)
(c)
(b)
5000
4000
3000
2000
1000
0
BC
concentration (ng/m
3 )
800 700 600 500 400 300 200 100
CO (ppb) Cluster #1: Intercept = 184.7+/-17.5 Slope = 6.5+/-0.4
Cluster #2: Intercept = 163.4+/-13.6 Slope = 8.8+/-0.9
Cluster #3: Intercept = 175.2+/-5.91 Slope = 6.5+/-0.2
(d) 5
4 3 2 1
5 4 3 2 1
5 4 3 2 1 50
200 50200
50
200
Fig. 4.Footprint regions of air masses 48-h back trajectories using ensemble approach(a, b, c)and a scatter plot of the BC-CO correlation
for each cluster(d). Shading colors (unit: natural logarithm of residence hour in each grid) in the plots indicate the possible source region of
pollution. The size of circle represents the yearly mean PM10mass concentration for the metropolis (population over 1 million) included in
the footprint region.
Table 1.Statistical results of BC and CO concentrations and BC-CO correlations for each cluster.
Cluster BC CO 1BC/1COa intercepts Rb Nc
category (ng m−3) (ppbv) (ng m−3ppbv−1) (ppbv)
mean S.D mean S.D
#1 1357.0 1173.5 395.6 161.9 6.5±0.4 184.±17.5 0.90 3660
#2 645.1 877.4 237.0 84.7 8.8±0.9 163.4±13.6 0.94 1860
#3 740.9 849.0 285.8 122.8 6.5±0.2 175.2±5.91 0.87 14520
avalues are written as mean±3σ,bat the 95 % significance level,cnumber of one-minute averaged data
two species near the source region despite the different ther-mal velocities and diffusion coefficients of BC and CO. (4) BC and CO from different emissions were well mixed during 48 h of convection, and1BC/1CO here referred to a typi-cal value on a regional stypi-cale instead of ratios of one specific emission types. Statistical results of BC and CO concentra-tions and BC-CO correlation were summarized in Table 1.
For Cluster #1, the mean CO and BC mass concentration was 395.6±161.9 ppbv and 1357.0±1173.5 ng m−3
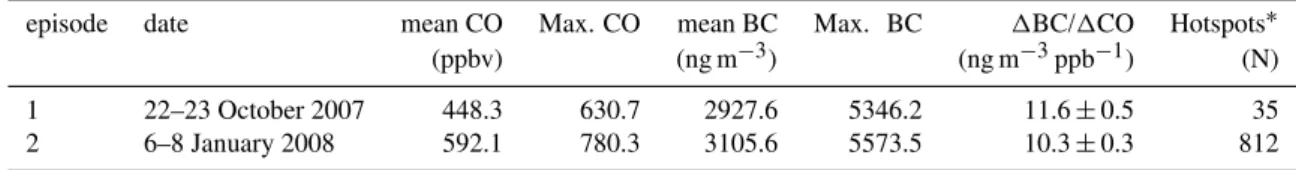
Table 2.The BC-CO relationships in BB pollution dominant episodes.
episode date mean CO Max. CO mean BC Max. BC 1BC/1CO Hotspots∗
(ppbv) (ng m−3) (ng m−3ppb−1) (N)
1 22–23 October 2007 448.3 630.7 2927.6 5346.2 11.6±0.5 35
2 6–8 January 2008 592.1 780.3 3105.6 5573.5 10.3±0.3 812
* statistical results possibly underestimate the total number of hotspots because some fire points are likely blocked by clouds.
CO emissions(Streets et al., 2006). It was the same as the situation in Shanxi province; domestic activities contributed about 63.5 % of BC emission and only 15.5 % of CO emis-sions respectively, and industry such as coal and chemical production, power generation, and metal refining hold over 47.3 % of CO emissions, which could have great influence on BC-CO relationship. According to INTEX-B inventory, the mean1BC/1CO ratios of anthropogenic emissions were ap-proximately 9.7 and 8.4 ng m−3ppbv−1for Henan and Anhui provinces in Standard Temperature and Pressure state, about 39 % higher than our results averagely.
BC and CO concentrations from Cluster #2 had means of 645.1 ng m−3and 237.0 ppbv. Studies at Nanjing (Lati-tude: 32.1◦N, Longitude: 118.7◦E) showed that the yearly mean CO and NO concentration were 1130±880 ppbv and 10.6±24.5 ppbv, respectively and the high CO con-centration in Nanjing was attributed to the low traffic speed and the congested traffic in the local urban area and gas/oil consumptions in surrounding industrial areas (Tu et al., 2007). In this study, 1BC/1CO ratio value was 8.8±0.9 ng m−3ppbv−1, comparable to the value (10.1
1gBC/1gCO, about 8.1 ng m−3ppbv−1 assuming in STP conditions) obtained in Shanghai mega city (Zhou et al., 2009), and higher than that in Beijing mega city (Han et al., 2009) for1BC/1CO ratio ranging from 3.5 ng m−3ppbv−1 (winter) to 5.8 ng m−3ppbv−1 (fall). The relatively high
1BC/1CO ratio from Cluster #2 mostly resulted from sig-nificant contributions of carbonaceous matter from domes-tic, transportation and industry sources. According to China Energy Statistics Yearbook 2006, percentage of diesel ve-hicles in Shanghai area was about 2 times higher than that in Beijing, and diesel fuel consumption was even about 5.3 times higher in 2005, even with nearly same gasoline and kerosene (C11–C16) consumption (Zhou et al., 2009). Stud-ies at Tokyo and Beijing urban site also highlighted the sig-nificant impact of heavy diesel duty vehicles on1BC/1CO ratios. As a large container port in China the densely ship-ping and combustion of low-quality bunker fuels in contain-ers and other marine vessels could be another reason for the higher1BC/1CO ratio from this Region. Our result was 50 % higher than the1BC/1CO ratios of anthropogenic emissions from Jiangsu (6.1 ng m−3ppbv−1) and Zhejiang (5.9 ng m−3ppbv−1) province in Standard Temperature and Pressure state.
In Cluster #3, CO and BC mass concentrations of air masses arriving at the study site were 285.8±122.8 ppbv and 740.9±849.0 ng m−3 respectively. Footprint analysis demonstrated that pollution emission from northern Jiangxi and northwestern of Fujian provinces substantially con-tributed to high BC and CO loading at the site. The
1BC/1CO ratio had a mean of 6.5±0.2 ng m−3ppbv−1, relatively lower than the 1BC/1CO ratios derived from inventory (9.0 ng m−3ppbv−1 for Fujian provinces and 7.8 ng m−3ppbv−1for Jiangxi province).
5 Characteristics in open biomass burning cases
Combining with hotspots information detected by MODIS and CALIPSO satellites, two cases when biomass burn-ing played a dominant role on high BC mass concentra-tions were selected. Table 2 summarized statistic results of BC and CO mass concentrations, and the BC-CO scatter plots for two cases were shown in Fig. 5. As shown, High Pearson correlation coefficient (R >0.9) for each episode were observed. All RH of air masses were less than 40 % along 48-hour back trajectories, indicating that the loss of BC during the transport could be minor. On October 22– 23 (Case 1), air masses were nearly stagnant south of the observation site (Fig. 6), and 35 hotspots were confidently detected by the MODIS satellite. CALIPSO satellite re-sults also indicated heavy “smoke” plumes at a 2–3 km altitude distributed over 25◦N–30◦N in Southern China (Fig. 6b). CO and BC mass concentrations significantly in-creased to 2927.6±1354.5 ng m−3, the maximum BC con-centration even reached to 5346.2 ng m−3, and the mean
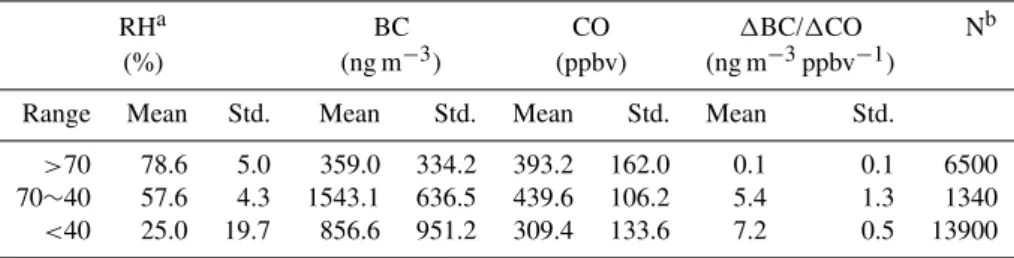
Table 3.Relationship between the1BC/1CO ratio and RH for all data.
RHa BC CO 1BC/1CO Nb
(%) (ng m−3) (ppbv) (ng m−3ppbv−1)
Range Mean Std. Mean Std. Mean Std. Mean Std.
>70 78.6 5.0 359.0 334.2 393.2 162.0 0.1 0.1 6500
70∼40 57.6 4.3 1543.1 636.5 439.6 106.2 5.4 1.3 1340
<40 25.0 19.7 856.6 951.2 309.4 133.6 7.2 0.5 13900
aRH is the mean value for episodes when meteorology along air mass pathways meet with the required RH condition.bNumber of min averaged data points.
provided by CALIPSO observations, the pollution in the 25◦N–32◦N latitude range was related to “smoke” and “pol-luted continental” plumes (Fig. 6d), and the aerosol opti-cal depth at 550 nm observed by MODIS in this region ex-ceeded 0.9 (http://gdata1.sci.gsfc.nasa.gov/daac-bin/G3/gui. cgi?instance id=aerosol daily). Mean BC and CO concen-trations were 3105.6 µg m−3 and 592.2 ppbv respectively, and the1BC/1CO ratio was 10.3±0.3 ng m−3ppbv−1. Ac-cording to footprint analysis, open biomass burning events mostly occurred in Hunan and Jiangxi provinces where over 32.9 % and 10.7 % of crop residues were burned outdoors annually (2007 Rural statistical Yearbook of China), and un-husked rice and ramie were their major commercial crops there. Observations in India indicated strong BC emissions during the forest fire season, with a1BC/1CO ratio of 28.5 (µg m−3)/(µg m−3) (Badarinath et al., 2007), much higher than our results. The types of burning mass and combus-tion condicombus-tions could be of great importance to investigate the BC-CO relationship.
6 BC loss rate on RH
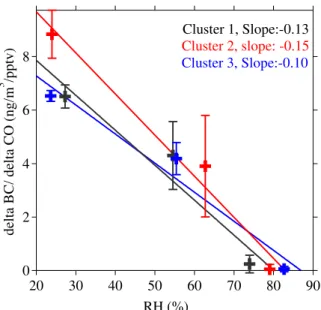
As mentioned above, major uncertainties of1BC/1CO ra-tio came from rain washout and the dry deposira-tion processes (they collide or absorb with other hydrophilic substances, gradually grew larger in the higher RH environment, and subsequently were removed from atmosphere according to gravitational settling and turbulence transportation) of BC particles. To highlight the loss rate of BC on RH, the re-lationship between1BC/1CO ratio and RH was presented. Figure 7 showed scatter plot of the1BC/1CO ratio on RH in the absent of rain along transportation path. For better expression, RH was divided into three ranges (RH>70 %, 70 %>RH>40 % and RH<40 %), and only BC data that met the required RH criterion for the entire air mass path-way were used in calculations. Statistical results for each cluster were summarized in Table 3. The Table showed that more than 90 % of BC could become hygroscopic as a result of coagulation and aging processes and was lost during the 48 h transport. The linear fitting result showed that the de-pendency of1BC/1CO ratio on RH have slope of−0.13,
8000
7000
6000
5000
4000
3000
2000
1000
0
Black carbon (ng/m
3 )
700 600 500 400 300 200 100
Carbon monoxide (ppb) Fitting results:
Case1: intercept = 190.9 ± 10.8; slope =11.6 ± 0.5 Case2: intercept = 291.6 ± 10.6; slope =10.3 ± 0.3
Fig. 5.Scatterplot and linear regression results of the BC-CO
corre-lation during biomass burning episodes. Cases 1 (red) represents the
episode on 22–23 October 2007 and Case 2 (black) for 6 January∼8
2007.
25 30 35
Latitude(deg)
110 115 120 125
Longitude(deg) 6 4 2 0
500
400
300
200
100
0
(a)
(b)
25 30 35 40
Latitude(deg)
105 110 115 120 125
Longitude(deg) 6 4 2 0
500
400
300
200
100
00 200 400 600 800 1000 1200
(c)
(d)
Fig. 6. Footprint regions of air masses and hotspots detected by MODIS satellite for open-burning events. Left panels indicate the spatial
distribution of hotspots (red cross), air mass footprint region (shading color is in unit of natural logarithm of residence hour in each grid), and orbit of CALIPSO satellite (blue line); Right panels show the vertical profile of aerosol types along the CALIPSO satellite orbit, Black
color blocks indicate the “smoke” aerosols are presented.(a)∼(b)for Case 1, and(c)∼(d)for Case 2.
matters in PM2.5 particulate matters throughout whole ob-servation period at downtown of Shanghai city (Yang et al., 2005), and about 30 % of the total carbon was water solu-ble, and unresolved complex mixture and fatty acids were the most abundant components quantified in solvent extractable organic compounds in Shanghai city (Feng et al., 2006). Be-sides, the high proportion of primary organic matter (nor-mally hydrophobic) in the PM2.5 category from southeast China than that from Eastern China might be another rea-son for a lower loss rate of aerosol particles for Cluster #3 (Han et al., 2008).
7 Comparison with other studies and discussions
Table 4 listed 1BC/1CO ratios measured by some pre-vious studies in different regions, and variations in the
1BC/1CO ratio for urban plumes and burning biomass were observed. For urban plumes, observations of the
1BC/1CO ratio have not always agreed well from re-gion to rere-gion owing to the diverse mixture of emission sources. According to footprint analysis, the 1BC/1CO ratio of urban plumes in Yangtze River Delta Region was 8.8±0.9 ng m−3ppbv−1, larger than the results (1BC/1CO ratio of 5.7±0.14 ng m−3ppbv−1) reported in Tokyo area
(Kondo et al., 2006), and that (3.5∼5.8 ng m−3ppbv−1) in Beijing area (Han et al., 2009). Their studies emphasized the intake air temperature dependence of vehicles engines on BC and CO emissions, and CO emissions would in-crease during the warming-up of a vehicle under cold con-ditions when the temperature of the catalyst was not suffi-ciently high. As mentioned in Section 4 relatively higher
Table 4.Comparisons with results of other observation studies.
Location Study period EC/CO ratio ng m−3ppbv−1
Instrument Method References
Beijing All seasons, 2005–2006 3.5–5.8 Semi-continuous ECOC analyzer, RT3052, NIOSH
TOT Han et al. (2009) Beijing Summer, 2005 3.7 Aethalometer, Magee Scientifc,
Model AE-21
Opt1 Zhou et al. (2009)
Shanghai 10.1
Guangzhou October, November 2004 7.9±0.2 Thermal/optical aerosol carbon analyzer, NIOSH
TOT Andreae et al. (2006) Tokyo All seasons 2003–2005 5.7±1.4 Semi-continuous ECOC
analyzer, RT3052, NIOSH
TOT Kondo et al. (2006) Taiwan All seasons 2003–2007 5.3 DRI2001A carbonaceous
aerosol analyzer, IMPROVE
TOR Chou et al. (2010) Mexico March 2006 2.89±0.89 Single particle soot photometer LII Subramanian et al. (2010) Texas End of summer 2006 7.2* Single particle soot photometer LII Spackman et al. (2008) Europe April–September 2008 0.8 to 6.2 Single particle soot photometer LII McMeeking et al. (2010) Mt.Huangshan All seasons 2007 6.5 for NCP
8.8 for ECR 10.3∼11.6 for BB
multiple-angle absorption photometer, Model 5012
Opt2 This study
TOT: thermal optical transmittance;
Opt1: converted from values in unit of BC(µg m−3)/CO(µg m−3), absorption of light at a wavelength of 880 nm, and BC concentration (with a±50 % error) reported here didn’t rule out the interference from light scattering by aerosol components and the filter matrix owing lack of universal correction method available.
TOR: thermal optical reflectance; LII: laser-induced incandescence;
Opt2: absorption of light at a wavelength of 637 nm, and influence from multi-scattering effects were taken into consideration. *: converted from ng BC (kg dry air)−1(ppb CO)−1assuming air density of 1.25 kg m−3in STP stats.
NCP: North China Plain; ECR: Eastern China Regions; BB: Biomass Burning.
8
6
4
2
0
delta BC/ delta CO (ng/m
3 /pptv)
90 80 70 60 50 40 30 20
RH (%)
Cluster 2, slope: -0.15
Cluster 1, Slope:-0.13
Cluster 3, Slope:-0.10
Fig. 7.Dependence of the observed1BC/1CO ratio on RH at Mt.
Huang for all non-rain periods. Relationships between1BC/1CO
and RH are fitted by linear regression method. The black, red and blue lines represent for Cluster #1, Cluster #2 and Cluster #3, re-spectively.
region, about 50 % lower than the our results. McMeeking et al. (2010) pointed out that the 1BC/1CO ratio in Eu-rope urban plumes ranged from 0.8 to 6.2 ng m−3ppbv−1,
and the highest 1BC/1CO ratio was observed for the areas classified as far-outflow and background (ratio of O3/NOx>10), where air masses were more chemically pro-cessed. This attribution highlights the importance of emis-sion sources over BC or CO processing and removal mech-anisms (McMeeking et al., 2010). In the present work, the1BC/1CO ratio for episodes of burning biomass were 12.4±1.5 ng m−3ppbv−1, comparable to the measurements for Texas (Spackman et al., 2008) and values reported for re-gions in India (Dickerson et al., 2002). Regional Emission inventory in Asia also reported 1BC/1CO ratios of 11.0, 11.2, 11.8, 11.4 and 11.0 ng m−3ppbv−1 for open burning of crop residue in Anhui, Hebei, Henan, Jiangsu and Shan-dong provinces respectively (Yamaji et al., 2010). Owing to such large observed variations and uncertainties concern-ing the photochemical processconcern-ing, great concern should be taken when implementing evaluating emission inventories, and more comprehensive analyses of carbonaceous chemical and physical properties were urgently needed.
8 Conclusions
and October, when there was large-scale burning of crop residues. The CO concentration increased sharply in the win-ter “heating period” in Northern China, and the yearly mean BC and CO concentrations were 1004.5±895.5 ng m−3and 424.1±159.2 ppbv respectively. At Mt. Huang,1BC/1CO ratio showed slightly unimodal diurnal variations, with max-ima during the day (09:00–17:00 LST) and minmax-ima at night (21:00–04:00 LST) owing to the uplift of pollution with the transport of valley breeze and PBL development during the day and intrusions of clean air from the upper troposphere at night. Cluster analysis using data for which the ambient RH was less than 40 % for the whole 48 hour back trajectories indicated that the1BC/1CO ratios of plumes from north-ern, eastern and southern regions of China were 6.5±0.4, 8.8±0.9 and 6.5±0.2 ng m−3ppbv−1 respectively. Two biomass burning cases were presented in this study, and the 1BC/1CO ratios were 10.3±0.3 ng m−3ppbv−1 and 11.6±0.5 ng m−3ppbv−1. Furthermore, the loss of BC during transport was also estimated on the basis of the 1BC/1CO-RH relationship along air mass path-ways. Results showed that BC can be significantly scav-enged when air mass traveled under higher RH con-ditions for 2 days and linear fitting result indicated that the slope of 1BC/1CO-RH relationship for East-ern China was −0.15 ng m−3ppbv−1%−1, which imply-ing a quick loss rate of BC than that from other regions (−0.13 ng m−3ppbv−1%−1and−0.10 ng m−3ppbv−1%−1 for northern, and southern parts of China). Coatings of aged particles by water soluble compound from this Region would be the most likely explanations.
Acknowledgements. The authors would like to thank all staff of
the meteorological station at Mt. Huang for providing lots of
conveniences in daily instrument maintenance and data
requi-sition during the observations. We gratefully acknowledge the
anonymous reviewers and many Japanese researchers, Hisahiro Takashima, Fumikazu Taketani at the JAMSTEC for their helpful comments and suggestions. This work was supported by National Basic Research 973 project (2010CB4951804) and NSFC grant (40775077) and the Global Environment Research Fund (S-7, C-081, B-051) by the Ministry of the Environment, Japan.
Edited by: M. Kopacz
References
Adachi, K., Chung, S., and Buseck, P.: Shapes of soot aerosol par-ticles and implications for their effects on climate, J. Geophys. Res. , 115(D15), D15206, doi:10.1029/2009JD012868, 2010. Andreae, M. O. and Gelencs´er, A.: Black carbon or brown
car-bon? The nature of light-absorbing carbonaceous aerosols, At-mos. Chem. Phys., 6, 3131–3148, doi:10.5194/acp-6-3131-2006, 2006.
Babu, S. S., Satheesh, S. K., and Moorthy, K. K.:, Aerosol radiative forcing due to enhanced black carbon at an urban site in India,
Geophys. Res. Lett., 29(18), 4 pp., doi:10.1029/2002GL015826, 2002.
Badarinath, K. V. S. and Latha, K. M.: Direct radiative forcing from black carbon aerosols over urban environment, Adv. Space Res., 37(12), 2183–2188, 2006.
Badarinath, K. V. S., Kharol, S. K., Chand, T. R. K., Parvathi, Y. G., Anasuya, T., and Jyothsna, A. N.: Variations in black carbon aerosol, carbon monoxide and ozone over an urban area of Hy-derabad, India, during the forest fire season, Atmos. Res., 85(1), 18–26, 2007.
Baumgardner, D., Raga, G., Peralta, O., Rosas, I., Castro,
T., Kuhlbusch, T., John, A., and Petzold, A.:
Diagnos-ing black carbon trends in large urban areas usDiagnos-ing car-bon monoxide measurements, J. Geophys. Res.-Atmos., 107, doi:10.1029/2001JD000626, 2002.
Bond, T. C., Streets, D. G., Yarber, K. F., Nelson, S. M., Woo, J.-H., and Klimont, Z.: A technology-based global inventory of black and organic carbon emissions from combustion, J. Geophys. Res., 109(D14), D14203, doi:10.1029/2003jd003697, 2004. Cao, G. L., Zhang, X. Y., and Zheng, F. C.: Inventory of black
car-bon and organic carcar-bon emissions from China, Atmos. Environ., 40(34), 6516–6527, 2006.
Cao, J. J., Zhu, C. S., Chow, J. C., Watson, J. G., Han, Y. M., Wang, G. H., Shen, Z. X., and An, Z. S.: Black carbon relationships with emissions and meteorology in Xi’an, China, Atmos. Res., 94(2), 194–202, 2009.
Chen, Y. J., Zhi, G. R., Feng, Y. L., Liu, D. Y., Zhang, G., Li, J., Sheng, G. Y., and Fu, J. M.: Measurements of Black and Organic Carbon Emission Factors for Household Coal Combus-tion in China: ImplicaCombus-tion for Emission ReducCombus-tion, Environ. Sci. Technol., 43(24), 9495–9500, 2009.
Chou, C. C.-K., Lee, C. T., Cheng, M. T., Yuan, C. S., Chen, S. J., Wu, Y. L., Hsu, W. C., Lung, S. C., Hsu, S. C., Lin, C. Y., and Liu, S. C.: Seasonal variation and spatial distribution of carbona-ceous aerosols in Taiwan, Atmos. Chem. Phys., 10, 9563–9578, doi:10.5194/acp-10-9563-2010, 2010.
Chow, J. C., Watson, J. G., Doraiswamy, P., Chen, L. W. A., Sode-man, D. A., Lowenthal, D. H., Park, K., Arnott, W. P., and Mo-tallebi, N.: Aerosol light absorption, black carbon, and elemental carbon at the Fresno Supersite, California, Atmos. Res., 93(4), 874–887, 2009.
Chung, S. H. and Seinfeld, J. H.: Climate response of direct ra-diative forcing of anthropogenic black carbon, J. Geophys. Res.-Atmos., 110(D11), 25 pp., doi:10.1029/2004JD005441, 2005.
Conant, W. C., Nenes, A., and Seinfeld, J. H.: Black
car-bon radiative heating effects on cloud microphysics and implications for the aerosol indirect effect – 1. Extended Kohler theory, J. Geophys. Res.-Atmos., 107(D21), 4604, doi:10.1029/2002JD002094, 2002.
Cooke, W. F. and Wilson, J. J. N.: A global black carbon
aerosol model, J. Geophys. Res., 101(D14), 19395–19409, doi:10.1029/96jd00671, 1996.
Cozic, J., Mertes, S., Verheggen, B., Cziczo, D. J., Gallavardin, S. J., Walter, S., Baltensperger, U., and Weingartner, E.: Black car-bon enrichment in atmospheric ice particle residuals observed in lower tropospheric mixed phase clouds, J. Geophys. Res.-Atmos., 113(D15209), doi:10.1029/2007JD009266, 2008.
Croft, B., Lohmann, U., and von Salzen, K.: Black carbon
analysis atmospheric general circulation model, Atmos. Chem. Phys., 5(7), 1931–1949, doi:10.5194/acp-5-1931-2005, 2005. Derwent, R. G., Ryall, D. B., Jennings, S. G., Spain, T. G., and
Simmonds, P. G.: Black carbon aerosol and carbon monoxide in European regionally polluted air masses at Mace Head, Ireland during 1995–1998, Atmos. Environ., 35(36), 6371–6378, 2001. Dickerson, R. R., Andreae, M. O., Campos, T., Mayol-Bracero,
O. L., Neusuess, C., and Streets, D. G.: Analysis of black car-bon and carcar-bon monoxide observed over the Indian Ocean: Im-plications for emissions and photochemistry, J. Geophys. Res.-Atmos., 107(D19), 8017, doi:10.1029/2001JD000501, 2002. Du, H. H., Kong, L. D., and Chen, T. T.: Insights into
summer-time haze pollution events over Shanghai based on online water-soluble ionic composition of aerosols, Atmos. Environ., 45(29), 5131-5137, 2011.
Feng, J., Chan, C. K., Chan, M., Fang, M., Hu, L., He, X., and Tang,
X. Y.: Characteristics of organic matter in PM2.5in Shanghai,
Chemosphere, 64(8), 1393–1400, 2006.
Han, Z., Zhang, R., Wang, Q. G., Wang, W., Cao, J.,
and Xu, J.: Regional modeling of organic aerosols over
China in summertime, J. Geophys. Res., 113(D11), D11202, doi:10.1029/2007jd009436, 2008.
Han, S., Kondo, Y., Oshima, N., Takegawa, N., Miyazaki, Y., Hu, M., Lin, P., Deng, Z., Zhao, Y., Sugimoto, N., and Wu, Y.: Tem-poral variations of elemental carbon in Beijing, J. Geophys. Res., 114(D23), D23202, doi:10.1029/2009jd012027, 2009.
Hitzenberger, R., Petzold, A., Bauer, H., Ctyroky, P., Pouresmaeil, P., Laskus, L., and Puxbaum, H.: Intercomparison of thermal and optical measurement methods for elemental carbon and black carbon at an urban location, Environ. Sci. Technol., 40(20), 6377–6383, 2006.
Jacobson, M. Z.: Strong radiative heating due to the mixing state of black carbon in atmospheric aerosols, Nature, 409(6821),
695–697, http://www.nature.com/nature/journal/v409/n6821/
suppinfo/409695a0 S1.html, 2001.
Jennings, S. G., Spain, T. G., Doddridge, B. G., Maring, H., Kelly, B. P., and Hansen, A. D. A.: Concurrent measurements of black carbon aerosol and carbon monoxide at Mace Head, J. Geophys. Res.-Atmos., 101(D14), 19447–19454, 1996.
Kanaya, Y., Komazaki, Y., Pochanart, P., Liu, Y., Akimoto, H., Gao, J., Wang, T., and Wang, Z.: Mass concentrations of black carbon measured by four instruments in the middle of Central East China in June 2006, Atmos. Chem. Phys., 8, 7637–7649, doi:10.5194/acp-8-7637-2008, 2008.
Kondo, Y., Komazaki, Y., Miyazaki, Y., Moteki, N., Takegawa,
N., Kodama, D., Deguchi, S., Nogami, M., Fukuda,
M., and Miyakawa, T.: Temporal variations of
elemen-tal carbon in Tokyo, J. Geophys. Res, 111, D12205,
doi:10.1029/2009JD012027, 2006.
Kondo, Y., Sahu, L., Kuwata, M., Miyazaki, Y., Takegawa, N., Moteki, N., Imaru, J., Han, S., Nakayama, T., Oanh, N. T. K., Hu, M., Kim, Y. J., and Kita, K.: Stabilization of the Mass Absorp-tion Cross SecAbsorp-tion of Black Carbon for Filter-Based AbsorpAbsorp-tion Photometry by the use of a Heated Inlet, Aerosol Sci. Technol., 43(8), 741–756, 2009.
Kuwata, M., Kondo, Y., and Takegawa, N.: Critical condensed mass for activation of black carbon as cloud condensation nu-clei in Tokyo, J. Geophys. Res.-Atmos., 114, D20202, 9 pp., doi:10.1029/2009JD012086, 2009.
Li, C., Marufu, L. T., Dickerson, R. R., Li, Z., Wen, T., Wang, Y., Wang, P., Chen, H., and Stehr, J. W.: In situ measurements of trace gases and aerosol optical properties at a rural site in North-ern China during East Asian Study of Tropospheric Aerosols: An International Regional Experiment 2005, J. Geophys. Res., 112(D22), D22S04, doi:10.1029/2006jd007592, 2007.
Li, J., Wang, Z., Akimoto, H., Yamaji, K., Takigawa, M., Pochanart, P., Liu, Y., Tanimoto, H., and Kanaya, Y.: Near-ground ozone source attributions and outflow in central Eastern China during MTX2006, Atmos. Chem. Phys., 8, 7335–7351, doi:10.5194/acp-8-7335-2008, 2008.
Liu, X. H., Penner, J. E., and Wang, M. H.: Influence of an-thropogenic sulfate and black carbon on upper tropospheric clouds in the NCAR CAM3 model coupled to the IMPACT global aerosol model, J. Geophys. Res.-Atmos., 114, D03204, doi:10.1029/2008JD010492,, 2009.
McMeeking, G. R., Hamburger, T., Liu, D., Flynn, M., Morgan, W. T., Northway, M., Highwood, E. J., Krejci, R., Allan, J. D., Minikin, A., and Coe, H.: Black carbon measurements in the boundary layer over western and northern Europe, Atmos. Chem. Phys., 10, 9393–9414, doi:10.5194/acp-10-9393-2010, 2010. Ming, J., Cachier, H., Xiao, C., Qin, D., Kang, S., Hou, S., and
Xu, J.: Black carbon record based on a shallow Himalayan ice core and its climatic implications, Atmos. Chem. Phys., 8, 1343– 1352, doi:10.5194/acp-8-1343-2008, 2008.
Ming, J., Xiao, C. D., Cachier, H., Qin, D. H., Qin, X., Li, Z. Q., and Pu, J. C.: Black Carbon (BC) in the snow of glaciers in west China and its potential effects on albedos, Atmos. Res., 92(1), 114–123, 2009.
Naoe, H., Hasegawa, S., Heintzenberg, J., Okada, K., Uchiyama, A., Zaizen, Y., Kobayashi, E., and Yamazak, A.: State of mix-ture of atmospheric submicrometer black carbon particles and its effect on particulate light absorption, Atmos. Environ., 43(6), 1296–1301, 2009.
Nenes, A., Conant, W. C., and Seinfeld, J. H.: Black carbon radia-tive heating effects on cloud microphysics and implications for the aerosol indirect effect – 2. Cloud microphysics, J. Geophys. Res.-Atmos., 107(D21), 4605, 2002.
Oberd¨orster, G. and Yu, C.: The carcinogenic potential of inhaled diesel exhaust: a particle effect?, J. Aerosol Sci., 21, S397–S401, 1990.
Ohara, T., Akimoto, H., Kurokawa, J., Horii, N., Yamaji, K., Yan, X., and Hayasaka, T.: An Asian emission inventory of anthropogenic emission sources for the period 19802020, At-mos. Chem. Phys., 7, 4419–4444, doi:10.5194/acp-7-4419-2007, 2007.
Pan, X. L., Yan, P., Tang, J., Ma, J. Z., Wang, Z. F., Gbaguidi, A., and Sun, Y. L.: Observational study of influence of aerosol hygroscopic growth on scattering coefficient over rural area near Beijing mega-city, Atmos. Chem. Phys., 9, 7519–7530, doi:10.5194/acp-9-7519-2009, 2009.
Petzold, A., Schloesser, H., Sheridan, P. J., Arnott, W. P., Ogren, J. A., and Virkkula, A.: Evaluation of Multiangle Absorption Photometry for Measuring Aerosol Light Absorption, Aerosol Sci. Technol., 39(1), 40–51, 2005.
doi:10.5194/acp-10-5641-2010, 2010.
Ramana, M. V., V. Ramanathan, Y. Feng, S. C. Yoon, S. W. Kim, G. R. Carmichael, and J. J. Schauer, Warming influenced by the ratio of black carbon to sulphate and the black-carbon source, Nature Geosci, 3(8), 542–545, 2010.
Ramanathan, V., and Carmichael, G.: Global and regional climate changes due to black carbon, Nat. Geosci., 1(4), 221–227, 2008. Reisinger, P., Wonaschutz, A., Hitzenberger, R., Petzold, A., Bauer, H., Jankowski, N., Puxbaum, H., Chi, X., and Maenhaut, W.: In-tercomparison of measurement techniques for black or elemental carbon under urban background conditions in wintertime: Influ-ence of biomass combustion, Environ. Sci. Technol., 42(3), 884– 889, 2008.
Sato, M., Hansen, J., Koch, D., Lacis, A., Ruedy, R., Dubovik, O., Holben, B., Chin, M., and Novakov, T.: Global atmospheric black carbon inferred from AERONET, P. Natl. A. Sci., 100(11), 6319–6324, 2003.
Schwarz, J. P., Spackman, J. R., Fahey, D. W., Gao, R. S., Lohmann, U., Stier, P., Watts, L. A., Thomson, D. S., Lack, D. A., Pfister, L., Mahoney, M. J., Baumgardner, D., Wilson, J. C., and Reeves, J. M.: Coatings and their enhancement of black carbon light ab-sorption in the tropical atmosphere, J. Geophys. Res.-Atmos., 113(D3), D03203, doi:10.1029/2007JD009042, 2008.
Seinfeld, J.: Atmospheric science – Black carbon and brown clouds, Nat. Geosci., 1(1), 15–16, 2008.
Slowik, J. G., Cross, E. S., Han, J. H., Davidovits, P., Onasch, T. B., Jayne, J. T., Williams, L. R., Canagaratna, M. R., Worsnop, D. R., Chakrabarty, R. K., Moosmuller, H., Arnott, W. P., Schwarz, J. P., Gao, R. S., Fahey, D. W., Kok, G. L., and Petzold, A.: An inter-comparison of instruments measuring black carbon content of soot particles, Aerosol Sci. Technol., 41(3), 295–314, 2007. Spackman, J. R., Schwarz, J. P., Gao, R. S., Watts, L. A.,
Thom-son, D. S., Fahey, D. W., Holloway, J. S., de Gouw, J. A., Trainer, M., and Ryerson, T. B.: Empirical correlations be-tween black carbon aerosol and carbon monoxide in the lower and middle troposphere, Geophys. Res. Lett., 35(19), L19816, doi:10.1029/2008GL035237, 2008.
Streets, D. G. and Aunan, K.: The importance of China’s household sector for black carbon emissions, Geophys. Res. Lett., 32(12), L12708, doi:10.1029/2005GL022960, 2005.
Streets, D. G., Gupta, S., Waldhoff, S. T., Wang, M. Q., Bond, T. C., and Bo, Y. Y.: Black carbon emissions in China, Atmos. En-viron., 35(25), 4281–4296, 2001.
Streets, D. G., Zhang, Q., Wang, L., He, K., Hao, J., Wu, Y., Tang, Y., and Carmichael, G. R.: Revisiting China’s CO emis-sions after the Transport and Chemical Evolution over the Pacific (TRACE-P) mission: Synthesis of inventories, atmospheric mod-eling, and observations, J. Geophys. Res. , 111(D14), D14306, doi:10.1029/2006JD007118, 2006.
Subramanian, R., Kok, G. L., Baumgardner, D., Clarke, A., Shi-nozuka, Y., Campos, T. L., Heizer, C. G., Stephens, B. B., de Foy, B., Voss, P. B., and Zaveri, R. A.: Black carbon over Mex-ico: the effect of atmospheric transport on mixing state, mass ab-sorption cross-section, and BC/CO ratios, Atmos. Chem. Phys., 10, 219–237, doi:10.5194/acp-10-219-2010, 2010.
Thevenon, F., Anselmetti, F. S., Bernasconi, S. M., and Schwikowski, M.: Mineral dust and elemental black carbon records from an Alpine ice core (Colle Gnifetti glacier) over the last millennium, J. Geophys. Res.-Atmos., 114, D17102, doi:10.1029/2008JD011490, 2009.
Tu, J., Xia, Z. G., Wang, H., and Li, W.: Temporal variations in surface ozone and its precursors and meteorological effects at an urban site in China, Atmos. Res., 85(3–4), 310–337, 2007. Wang, Z., Li, J., Wang, X., Pochanart, P., and Akimoto, H.:
Mod-eling of regional high ozone episode observed at two mountain sites (Mt. Tai and Huang) in East China, J. Atmos. Chem., 55(3), 253–272, 2006.
Yamaji, K., Li, J., Uno, I., Kanaya, Y., Irie, H., Takigawa, M., Komazaki, Y., Pochanart, P., Liu, Y., Tanimoto, H., Ohara, T., Yan, X., Wang, Z., and Akimoto, H.: Impact of open crop resid-ual burning on air qresid-uality over Central Eastern China during the Mount Tai Experiment 2006 (MTX2006), Atmos. Chem. Phys., 10, 7353–7368, doi:10.5194/acp-10-7353-2010, 2010.
Yang, F., He, K., Ye, B., Chen, X., Cha, L., Cadle, S. H., Chan, T., and Mulawa, P. A.: One-year record of organic and elemental carbon in fine particles in downtown Beijing and Shanghai, At-mos. Chem. Phys., 5, 1449–1457, doi:10.5194/acp-5-1449-2005, 2005.
Zhang, Q., Streets, D. G., Carmichael, G. R., He, K. B., Huo, H., Kannari, A., Klimont, Z., Park, I. S., Reddy, S., Fu, J. S., Chen, D., Duan, L., Lei, Y., Wang, L. T., and Yao, Z. L.: Asian emis-sions in 2006 for the NASA INTEX-B mission, Atmos. Chem. Phys., 9, 5131–5153, doi:10.5194/acp-9-5131-2009, 2009. Zhou, X., Gao, J., Wang, T., Wu, W., and Wang W.: Measurement