ACPD
14, 4905–4956, 2014Vehicular emissions in China in 2006 and
2010
N. Chao et al.
Title Page
Abstract Introduction
Conclusions References
Tables Figures
◭ ◮
◭ ◮
Back Close
Full Screen / Esc
Printer-friendly Version Interactive Discussion
Discussion
P
a
per
|
D
iscussion
P
a
per
|
Discussion
P
a
per
|
Discuss
ion
P
a
per
|
Atmos. Chem. Phys. Discuss., 14, 4905–4956, 2014 www.atmos-chem-phys-discuss.net/14/4905/2014/ doi:10.5194/acpd-14-4905-2014
© Author(s) 2014. CC Attribution 3.0 License.
Atmospheric Chemistry and Physics
Open Access
Discussions
This discussion paper is/has been under review for the journal Atmospheric Chemistry and Physics (ACP). Please refer to the corresponding final paper in ACP if available.
Vehicular emissions in China in 2006 and
2010
N. Chao1,2, G. Tang2, Y. Wang1,2, H. Wang1, J. Huang3, and J. Chen4
1
Gansu Agricultural University, Lanzhou 730070, China
2
State Key Laboratory of Atmospheric Boundary Layer Physics and Atmospheric Chemistry (LAPC), Institute of Atmospheric Physics, Chinese Academy of Sciences, Beijing 100029, China
3
Institute of Remote Sensing and Digital Earth, Chinese Academy of Sciences, Beijing 100029, China
4
Key Laboratory for Aerosol-Cloud-Precipitation of China Meteorological Administration, Nanjing University of Information Science and Technology, Nanjing 210044, China
Received: 5 December 2013 – Accepted: 31 January 2014 – Published: 21 February 2014
Correspondence to: G. Tang ([email protected])
ACPD
14, 4905–4956, 2014Vehicular emissions in China in 2006 and
2010
N. Chao et al.
Title Page
Abstract Introduction
Conclusions References
Tables Figures
◭ ◮
◭ ◮
Back Close
Full Screen / Esc
Printer-friendly Version Interactive Discussion
Discussion
P
a
per
|
D
iscussion
P
a
per
|
Discussion
P
a
per
|
Discuss
ion
P
a
per
Abstract
Vehicular emissions are one of the most important sources of pollution in China, and they can increase the ambient concentrations of air pollutants and degrade the air quality. Using data released by the National Bureau of Statistics, vehicular emissions in China in 2006 and 2010 were calculated at a high spatial resolution, by taking the
5
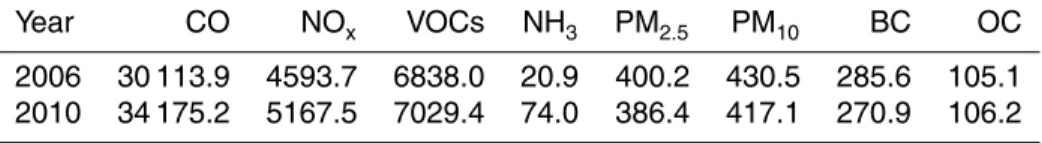
emission standards into consideration. The results show that China’s vehicular emis-sions of CO, NOx, VOCs, NH3, PM2.5, PM10, black carbon (BC), and organic carbon (OC) were 30113.9, 4593.7, 6838.0, 20.9, 400.2, 430.5, 285.6, and 105.1 Gg, respec-tively, in 2006 and 34175.2, 5167.5, 7029.4, 74.0, 386.4, 417.1, 270.9, and 106.2 Gg, respectively, in 2010. CO, VOCs, and NH3 emissions were mainly from motorcycles
10
and light-duty gasoline vehicles, whereas NOx, PM2.5, PM10, and BC emissions were
mainly from rural vehicles and heavy-duty diesel trucks. OC emissions were mainly from motorcycles and heavy-duty diesel trucks. Euro 0 and Euro I vehicles were the primary contributors to all of the pollutant emissions except NH3, which was mainly from
Euro III and Euro IV vehicles. The spatial distribution of vehicular emissions in China in
15
2006 and 2010 were developed at a high resolution of 0.25◦×0.25◦, by using the road traffic density to characterize the busyness of a road. This method could overcome the problem of getting traffic flow information and make the spatial allocation more closed to the actual road emissions. The results showed that vehicular emissions presented significant regional spatial distribution, and emissions in the eastern and southern parts
20
of China were much higher than those in western and northern China in both years. The North China Plain, Yangtze River Delta, and Pearl River Delta regions jointly ac-counted for nearly half of the emissions. NH3emissions increased greatly in big cities
from 2006 to 2010. Emissions of CO, NOx, and VOCs could increase 52 %, 9 %, and
68 %, if the emission standard and oil quality remained in the Euro I stage, so the
poli-25
ACPD
14, 4905–4956, 2014Vehicular emissions in China in 2006 and
2010
N. Chao et al.
Title Page
Abstract Introduction
Conclusions References
Tables Figures
◭ ◮
◭ ◮
Back Close
Full Screen / Esc
Printer-friendly Version Interactive Discussion
Discussion
P
a
per
|
D
iscussion
P
a
per
|
Discussion
P
a
per
|
Discuss
ion
P
a
per
|
the sulfur level because NOx emission is very sensitive to it. By comparing with coal consumption and NO2column density observed by SCIA satellite, the increase of NOx
emission in China from 2006 to 2010 was mainly caused by coal consumption.
1 Introduction
As China’s economy has developed, the total number of civilian motor vehicles has
5
surged from 14.5 million in 1999 to 78.1 million in 2010, an increase of 437.0 % in 12 yr. Especially in recent years, the annual growth rate of civilian vehicles has been approximately 20 % (National Bureau of Statistics, 1999–2010). This increase in motor vehicles has caused vehicle use to be an important contributor to China’s air pollution. In 2004, half of the NOx in Chinese cities was emitted from motor vehicles, and
ve-10
hicles were considered one of the main sources of China’s air pollution by the State Environmental Protection Administration of China (2004). The northern and southeast-ern coasts of China, which represent a small share of the Chinese territory but include many of its vehicles, produce a substantial amount of pollution per unit area, aggravat-ing the regional air pollution. Among the pollutants emitted by motor vehicles, black
car-15
bon (BC), organic carbon (OC), PM2.5, and PM10 can lower visibility by the extinction process. CO, NH3, VOCs, and NOx are important precursors of secondary aerosols
and O3 because they can generate a series of photochemical reactions once they
reach a certain concentration in the atmosphere. These reactions may have a great influence on regional visibility, accelerate the formation of haze, and exacerbate the
20
photochemical pollution problem (Zhang et al., 1998). To satisfy the Euro III emission standards for motor vehicles, newly registered motors vehicles must install three-way catalytic converters (TWCs); however, these devices can lead to NH3emissions while reducing CO, NOx, and VOCs through redox reactions (Heeb et al., 2006a; Kean et al.,
2009). NH3 in the atmosphere is highly reactive, and heterogeneous atmospheric re-25
ACPD
14, 4905–4956, 2014Vehicular emissions in China in 2006 and
2010
N. Chao et al.
Title Page
Abstract Introduction
Conclusions References
Tables Figures
◭ ◮
◭ ◮
Back Close
Full Screen / Esc
Printer-friendly Version Interactive Discussion
Discussion
P
a
per
|
D
iscussion
P
a
per
|
Discussion
P
a
per
|
Discuss
ion
P
a
per
Beijing–Tianjin–Hebei (BTH) region five times in January 2013, and vehicular emis-sions made significant contributions to this pollution (Wang et al., 2013). Therefore, calculating vehicular emissions is a convenient way to describe the characteristics of regional vehicular pollution in China and can supply reliable data for regional air quality modeling, pollution prevention, and policy-making.
5
In the 1990s, a number of foreign scholars developed pollutant inventories for East Asia, with China, as a dominant country, as a primary focus. Vehicular emissions were considered as well. Van Aardenne et al. (1999) used the Regional Air Pollution Informa-tion and SimulaInforma-tion (RAINS-ASIA) methodology to calculate the energy consumpInforma-tion over the next 30 yr based on 1990 data and then calculated Asia’s NOxemissions from
10
1990 to 2020. The results showed that NOx emissions from motor vehicles in China accounted for 7 % of the total NOx emissions in 1990, and the share would increase
to 33 % in 2020. The emissions profiles of SO2, NOx, CO, and BC for China for the
years 1995 and 2020 were presented by Streets et al. (2000, 2001) as a component of NASA’s (the National Aeronautics and Space Administration) China-MAP program,
15
and the authors suggested that motor vehicles were the main source of NOx and CO.
In addition, during the studies of the Transport and Chemical Evolution over the Pa-cific (TRAC-P) mission funded by NASA and in the Asian PaPa-cific Regional Aerosol Characterization Experiment (ACE-Asia) funded by the National Science Foundation (NSF) and the National Oceanic and Atmospheric Administration (NOAA), Streets
20
et al. (2003) improved their method incrementally by dividing the motor vehicles into categories and taking total annual mileage driven into consideration. They then de-veloped an inventory of air pollutant emissions in Asia in the year 2000. The spatial distribution of the inventory was showed at a resolution of 1◦×1◦. The global emissions inventory EDGAR (Emission Database for Global Atmospheric Research) also included
25
ACPD
14, 4905–4956, 2014Vehicular emissions in China in 2006 and
2010
N. Chao et al.
Title Page
Abstract Introduction
Conclusions References
Tables Figures
◭ ◮
◭ ◮
Back Close
Full Screen / Esc
Printer-friendly Version Interactive Discussion
Discussion
P
a
per
|
D
iscussion
P
a
per
|
Discussion
P
a
per
|
Discuss
ion
P
a
per
|
study, gridded emissions in Asia were given at a resolution of 0.5◦×0.5◦. In order to update the TRAC-P inventory to reflect the extremely rapid economic growth in Asia since 2000, the Intercontinental Chemical Transport Experiment-Phrase B (INTEX-B) was conducted by NASA. SO2, NOx, CO, NMVOC, PM10, PM2.5, BC, and OC emis-sions from motor vehicles were estimated in detail for 2006 (Zhang et al., 2009).
Com-5
pared with the previous studies, INTEX-B not only took the vehicle classifications and fuel ratio into consideration but also incorporated technological innovation when calcu-lating vehicular emissions in China, and the results showed that vehicular emissions increased markedly from 2001 to 2006. This inventory has received widespread appli-cation because of its substantially improved accuracy compared to its predecessors.
10
Because vehicles play an important role in the air pollution of China, studies on vehic-ular emissions were carried out in China. Li et al. (2003) calculated the emission factors and emissions of ten vehicular pollutants in 1995, including VOCs, CH4, CO, NOx, CO2, SO2, Pb, PM10, and N2O, based on the MOBILE5 model and fuel consumption. The
results showed that the vehicular emission factors in China were several times higher
15
than in countries of the same economic development level, and vehicular emissions had climbed rapidly because of the sustained growth in the number of motor vehicles. Song and Xie (2006) established the Chinese inventories of vehicular emissions with a resolution of 40 km×40 km using GIS in 2002, based on the statistical data from yearbooks and the emission factors of each vehicle category in each province
calcu-20
lated by the COPERT III program. Their results showed that motorcycles and light-duty gas vehicles contributed greatly to the emissions and that the emissions in the Beijing– Tianjin–Hebei (BTH) region, Yangtze River Delta (YRD), and Pearl River Delta (PRD) were much higher than in other regions of China. Multi-year inventories of vehicular emissions at a high spatial resolution of 40 km×40 km in China were established by
25
de-ACPD
14, 4905–4956, 2014Vehicular emissions in China in 2006 and
2010
N. Chao et al.
Title Page
Abstract Introduction
Conclusions References
Tables Figures
◭ ◮
◭ ◮
Back Close
Full Screen / Esc
Printer-friendly Version Interactive Discussion
Discussion
P
a
per
|
D
iscussion
P
a
per
|
Discussion
P
a
per
|
Discuss
ion
P
a
per
fects in traditional methods of spatial allocation, Zheng et al. (2009b) proposed a new approach, named “standard road length”, that makes use of GIS-based road network information and traffic flows to help allocate the vehicular emissions into grid cells. This approach was demonstrated to be practicable in the spatial allocation of the regional vehicular emissions in the PRD in 2004. Subsequently, another high-resolution
emis-5
sions inventory for the PRD region in 2006 was developed by similar methods (Zheng et al., 2009a). Lang et al. (2012) developed multi-year emissions inventories for NOx, CO, VOCs, and PM10 in the BTH region for the period 1999–2010 and discussed the
effects of vehicle category, fuel ratio, and emission standards. Che et al. (2009) devel-oped the vehicular emissions inventories of PRD in 2006 and thoroughly analyzed the
10
emission contributions of different vehicle categories and fuel types. Fu et al. (2013) de-veloped a high-resolution emission inventory of primary air pollutants for YRD region, including Shanghai and 24 cities in Zhejiang and Jiangsu. Cao et al. (2011) took the traffic source into account when calculating the emission of primary particles and pol-lutant gases in China in 2007, and the national emissions were gridded with resolution
15
of 0.5◦×0.5◦for the air-quality models. Other scholars have also developed municipal-level vehicular emissions inventories (Fu et al., 2000; He, 2011; Li et al., 2010; Ma, 2008; Wang et al., 2012; Yao et al., 2012a; Yu, 2007; Zhang, 2005).
In summary, the target years of the existing vehicular emissions inventories are al-most from 1999 to 2007. However, there have been dramatic changes in China in
re-20
cent years, particularly in vehicle ownership and emissions standards. Therefore, much of the published research is not applicable to the current situation in China. In addition, the difference in emissions factors among vehicles with different emission standards (from Euro 0 to II in 2006 and to Euro IV in 2010) was often overlooked in previous studies. As a result, the emissions from the vehicles registered earlier were
underesti-25
ACPD
14, 4905–4956, 2014Vehicular emissions in China in 2006 and
2010
N. Chao et al.
Title Page
Abstract Introduction
Conclusions References
Tables Figures
◭ ◮
◭ ◮
Back Close
Full Screen / Esc
Printer-friendly Version Interactive Discussion
Discussion
P
a
per
|
D
iscussion
P
a
per
|
Discussion
P
a
per
|
Discuss
ion
P
a
per
|
for all of Asia, which may lead to great uncertainty for the lack of detailed information of China. However, studies within China have often examined small regions, such as the BTH or PRD regions, or cities; studies at these scales cannot describe China’s ve-hicular emissions systematically or satisfy the requirements for numerical simulations because of their low resolution. For these reasons, developing a new, complete, and
5
high-resolution vehicular emissions inventory is necessary.
To study the characteristics of vehicular emissions, meet the needs of the regional air-quality simulation, and provide a reference for policy-making, the vehicular emis-sions of CO, NOx, VOCs, NH3, PM2.5, PM10, BC, and OC in China in 2006 and 2010
were estimated in the present study. The vehicle emissions standards, categories, and
10
fuel types were incorporated to improve the accuracy and reliability of the findings. The spatial distributions of vehicular emissions for the whole China were examined at a resolution of 0.25◦×0.25◦. For further study, the emissions calculated in this work were compared with the existing inventories, and the results of the spatial distribu-tions were compared with the fuel consumption and NO2 column density observed by 15
satellite. The effects of emission standards and oil quality improvement were analyzed. The Monte Carlo method was used to calculate the uncertainties associated with the emissions.
2 Data and methodology
2.1 Emissions calculation method
20
2.1.1 Calculation formula
Vehicular emissions of CO, NOx, VOCs, NH3, PM2.5, PM10, BC, and OC in different
ACPD
14, 4905–4956, 2014Vehicular emissions in China in 2006 and
2010
N. Chao et al.
Title Page
Abstract Introduction
Conclusions References
Tables Figures
◭ ◮
◭ ◮
Back Close
Full Screen / Esc
Printer-friendly Version Interactive Discussion
Discussion
P
a
per
|
D
iscussion
P
a
per
|
Discussion
P
a
per
|
Discuss
ion
P
a
per
standards using the following formula:
Em,n=X
j X
i
(Pm,i,j×VTMi,j×EFi,j,n)×10−6 (1)
wheremrepresents the province;nrepresents the pollutants considered in this study (i.e., CO, NOx, VOCs, NH3, PM2.5, PM10, BC, and OC);i represents the type of vehicle; 5
j represents the national vehicular emission standards (from Euro 0 to Euro IV);Em,n
represents emissions (tons) of pollutantnin province m;Pm,i,j represents the popula-tion of typei vehicle with emissions standard j in provincem; VTMi,j represents the average annual traveled mileage (km) of type i vehicle with emission standard j in provincem; and EFi,j,n represents the emission factor (g km
−1
) of pollutant nemitted
10
from typei vehicles with emission standardj.
2.1.2 Activity data research
(1) Vehicle population
We classified vehicles into light-duty gasoline vehicles (LDGVs), heavy-duty gasoline vehicles (HDGVs), light-duty gasoline trucks (LDGTs), light-duty diesel vehicles
(LD-15
DVs), heavy-duty diesel vehicles (HDDVs), light-duty diesel trucks (LDDTs), heavy-duty diesel trucks (HDDTs), rural vehicles (RVs), and motorcycles (MCs). The original data for each vehicle class in a province were obtained from the official statistical yearbooks (National Bureau of Statistics, 2006, 2010). However, there is no information about the vehicle population classified by fuel types, which have great influence on emission
fac-20
tors. To address this problem, an investigation of fuel ratios was conducted based on the production of vehicles by fuel type for the period 2002–2010 from the Automotive Industry Yearbook (China Automobile Industry Association, 2002–2006). We then took the average annual fuel ratio as the fuel ratio for this study, as shown in Table S1. Because there were no data on the RVs and MCs population, we assumed. Because
25
pop-ACPD
14, 4905–4956, 2014Vehicular emissions in China in 2006 and
2010
N. Chao et al.
Title Page
Abstract Introduction
Conclusions References
Tables Figures
◭ ◮
◭ ◮
Back Close
Full Screen / Esc
Printer-friendly Version Interactive Discussion
Discussion
P
a
per
|
D
iscussion
P
a
per
|
Discussion
P
a
per
|
Discuss
ion
P
a
per
|
ulation in 2010 was approximately the same as in 2006, and the MCs population was calculated based on the MCs ownership per 100 households and the household data from the official statistical yearbook.
To mitigate vehicular emissions, several emissions standards (from Euro I to Euro IV) have been implemented over the past decade in China, so the emission factors of
5
vehicles with different emission standards differ from one another. For this reason, it is necessary to estimate the population of vehicles with various emission standards. We assumed that after a new emission standard was introduced, newly registered vehicles must be in compliance with that standard. Therefore, the vehicle population by emission standards can be calculated by knowing the total population and the population of
10
newly registered vehicles. Details are shown in the following formula:
Pm,i,j=
P
ys
Nm,i,j,ys j6=Euro0
Pm,i,total− 4
P j=1
P
ys
Nm,i,j,ys j=Euro0 (2)
where ys represents the years when the emission standard j was implemented.
Nm,i,j,ys represents the population of newly registered vehicles of typei and emission
15
standardj in year ys in provincem.Pm,i,total represents the total population of vehicle typei in provincemfor the target calculation year.
It should be noted that if the calculated population of Euro 0 is negative, and then the value will be set to 0, and the population of Euro I will be modified accordingly. The total numbers of vehicles with each emission standard in 2006 and 2010 were listed in
20
Tables S2 and S3.
(2) Average annual vehicle traveled mileages
ACPD
14, 4905–4956, 2014Vehicular emissions in China in 2006 and
2010
N. Chao et al.
Title Page
Abstract Introduction
Conclusions References
Tables Figures
◭ ◮
◭ ◮
Back Close
Full Screen / Esc
Printer-friendly Version Interactive Discussion
Discussion
P
a
per
|
D
iscussion
P
a
per
|
Discussion
P
a
per
|
Discuss
ion
P
a
per
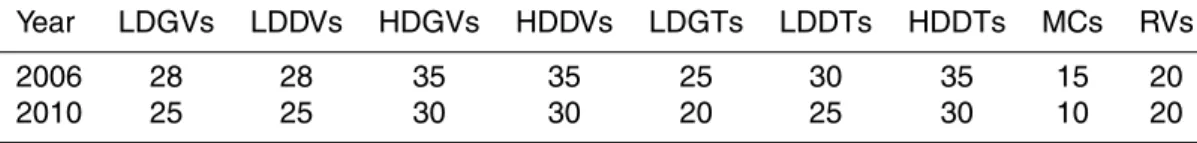
adopted the results from a previous study (Liu et al., 2008). Details are shown in Ta-ble 1.
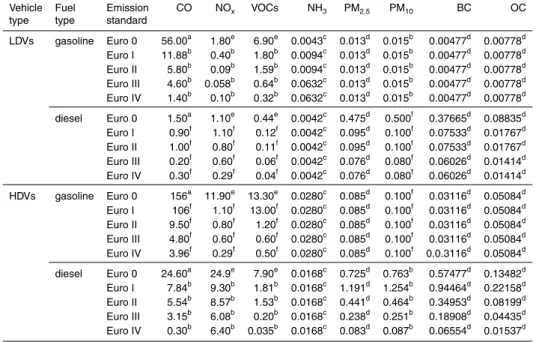
2.1.3 Emission factors
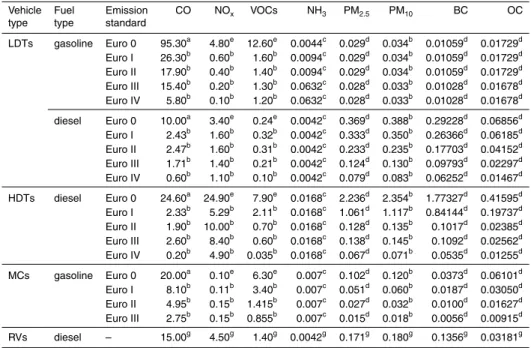
Systematic studies of vehicular emission factors are rare in China, and most studies have been limited to a city area; thus, there is no complete and suitable emission factor
5
database for all of China. We obtained the emission factors needed in our study through a comprehensive literature search and a thorough analysis.
CO, NOx, VOCs, and PM10 were obtained from the results of Beijing Municipal Sci-ence and Technology Project (2012), which were calculated by the COPERT IV module recently, and we used the emission factors published by the Vehicular Emission Control
10
Center of Chinese State Environmental Protection Administration (SEPA) as a comple-ment (2005). However, the Euro 0 vehicle emission factors for these two results were substantially different; thus, the CO, VOCs, and NOx emission factors of Euro 0
vehi-cles were from Street et al. (2006) and Fu et al. (2001). For the NH3, PM2.5, BC, and OC emissions, little research has been conducted in China. NH3emission factors were 15
obtained from the Emission Inventory Improvement Program of the US EPA (Environ-mental Protection Agency of US) (2005); PM2.5, BC, and OC emission factors were calculated according to the fraction of these three particulate matters in relation to the total PM10 (Streets et al., 2001). The RVs in our study were all assigned the same
emission factors because few research was conducted on it (Yao et al., 2011a). All of
20
the emission factors are listed in Table 2.
2.2 Spatial distribution method
Zheng et al. (2009b) proposed a GIS-based method for the spatial allocation of mobile source emissions named “standard road length”, which is based on the road network and traffic flow information. However, traffic flow information is unavailable. To use this
25
ACPD
14, 4905–4956, 2014Vehicular emissions in China in 2006 and
2010
N. Chao et al.
Title Page
Abstract Introduction
Conclusions References
Tables Figures
◭ ◮
◭ ◮
Back Close
Full Screen / Esc
Printer-friendly Version Interactive Discussion
Discussion
P
a
per
|
D
iscussion
P
a
per
|
Discussion
P
a
per
|
Discuss
ion
P
a
per
|
of transport routes from the China Statistical Yearbook (National Bureau of Statistics, 2006, 2010). to calculate the road traffic density, which was used to characterize the busyness of a road. The specific methods are as follows:
(1) Develop the county-level vehicular emission inventory
The city-level inventory should be calculated first, combined with the proportions of
5
vehicles for each city from the China Statistical Yearbook (National Bureau of Statistics, 2006, 2010). after the vehicular emissions inventory of each province is calculated using Eq. (1). Then, the sum of the values of secondary and tertiary industries of each county, which was from the China County Statistical Yearbook were used to complete the county-level vehicular emissions inventory (Investigeion General Team of Rural
10
Economic Society in State Statistical Bureau, 2006, 2010).
(2) Calculate the road traffic density for each grade of road
The road traffic density is used to replace the traffic flow to characterize the busyness of the roads and can be calculated using Eq. (3):
Fm= Tm
TLm,total
;Fm,k=Fm×Pm,k (3)
15
wherekrepresents the grade of the road;Fmrepresents the average road traffic density in provincem;Tm represents the passenger and cargo turnover volume in provincem; TLm,total represents the length of transport routes in province m; Fm,k represents the road traffic density of gradek road in provincem; and Pm,k represents the proportion
20
ACPD
14, 4905–4956, 2014Vehicular emissions in China in 2006 and
2010
N. Chao et al.
Title Page
Abstract Introduction
Conclusions References
Tables Figures
◭ ◮
◭ ◮
Back Close
Full Screen / Esc
Printer-friendly Version Interactive Discussion
Discussion
P
a
per
|
D
iscussion
P
a
per
|
Discussion
P
a
per
|
Discuss
ion
P
a
per
(3) Calculate the standard length commutation factor of each road grade
Equation (4) describes this relation.
Am,k=Fm,k
SF (4)
where Am,k represents the standard length commutation factor of grade k road in
5
provincemand SF represents the standard road traffic density (custom value).
To obtain the standard length commutation factor for each county, we assumed that the standard length commutation factor of each province is applicable to each county located in this province, that is to sayAm,k=Ac,k, wherecrepresents the county name.
(4) Calculate the emissions intensity per unit standard road length in each county
10
First, the total standard road length in each county should be calculated, and then the target value can be obtained. Equations (5) and (6) describe this relation.
SLc,total= 4
X
k=1
Ac,k×Lc,k (5)
EIc= Ec
SLc,total (6)
15
where SLc,total represents the total standard road length (km) in countyc;Lc,k repre-sents the actual length (km) of the gradek road; EIcrepresents the emissions intensity per unit standard road length in each county (t km−1); andEcrepresents the total emis-sions in countyc(t).
(5) Calculate the emissions in each cell
20
ACPD
14, 4905–4956, 2014Vehicular emissions in China in 2006 and
2010
N. Chao et al.
Title Page
Abstract Introduction
Conclusions References
Tables Figures
◭ ◮
◭ ◮
Back Close
Full Screen / Esc
Printer-friendly Version Interactive Discussion
Discussion
P
a
per
|
D
iscussion
P
a
per
|
Discussion
P
a
per
|
Discuss
ion
P
a
per
|
length, as shown in Eqs. (7) and (8):
GSLc,x=
4
X
k=1
Ac,k×GLc,x,k (7)
GEx=GSLc,x×EIc (8)
where GSLc,xrepresents the standard road length of the cellxin countyc(km); GLc,x,k
5
represents the actual length of the gradek road of the cellxin countyc(km); and GEx represents the emissions in cellx (tons).
For cells located on the boundary of multiple counties, the standard road length of each county included in the target cell is calculated first, followed by the sum of the emissions of these counties, as shown in Eqs. (9) and (10):
10
BGSLc,x=
4
X
k=1
Ac,k×BGLc,x,k (9)
BGEx= a X
c=1
BGSLc,x×EIc (10)
where BGSLc,xrepresents the standard road length of countycincluded in cellx(km); BGLc,x,k represents the actual road length of the gradek road of countycincluded in
15
cellx (km); BGFx represents the emissions of the cellx (tons); and a represents the number of counties located in cellx.
3 Results
3.1 Total vehicular emissions for China in 2006 and 2010
We estimate China’s vehicular emissions of CO, NOx, VOCs, NH3, PM2.5, PM10, BC, 20
ACPD
14, 4905–4956, 2014Vehicular emissions in China in 2006 and
2010
N. Chao et al.
Title Page
Abstract Introduction
Conclusions References
Tables Figures
◭ ◮
◭ ◮
Back Close
Full Screen / Esc
Printer-friendly Version Interactive Discussion
Discussion
P
a
per
|
D
iscussion
P
a
per
|
Discussion
P
a
per
|
Discuss
ion
P
a
per
respectively in 2006 and 34 175.2, 5167.5, 7029.4, 74.0, 386.4, 417.1, 270.9, and 106.2 Gg, respectively, in 2010. Table 3 presents the emissions of these two target years.
Compared with 2006, CO, NOx, VOCs, NH3, and OC emissions increased in 2010:
254.8 % for NH3because of the comprehensive use of the TWC, 13.5 % for CO, 12.5 %
5
for NOx, 2.8 % for VOCs, and 1.1 % for OC. In contrast, PM2.5, PM10, and BC emissions
decreased by 3.4 %, 3.2 % and 5.2 %, respectively. These emission changes can be attributed to the populations and distributions in each vehicular category between the two years.
On the national scale, the contributions of each vehicle category to the emissions of
10
the eight pollutants in 2006 and 2010 are shown in Fig. 1. According to Fig. 1a and b, the contribution of each category of vehicle in 2006 was the same as that of 2010 on the whole. MCs and LDGVs were the main contributors to CO, VOCs, and NH3
emissions, which in total accounted for approximately 66.2 %, 80.3 %, and 68.8 % of the emissions for these three pollutants in 2006, respectively, and approximately 70.9 %,
15
81.7 %, and 87.7 %, respectively, in 2010. RVs and HDDTs were the main contributors to NOx, PM2.5, PM10, and BC emissions, which accounted for approximately 68.1 %,
53.9 %, 52.7 %, and 60.9 % in 2006, and approximately 69.6 %, 53.7 %, 52.4 %, and 60.7 % in 2010, respectively. The main contributors to OC were MCs and HDDTs, which accounted for approximately 61.5 % of the OC emissions in 2006 and 58.7 % in 2010.
20
Among fuel types, gasoline-fueled vehicles were the major contributors to the CO, VOCs, and NH3 emissions and made up 72.8–90.2 % of the contributions of these
three pollutants in both years. NOx, PM2.5, PM10, and BC were mainly from
diesel-fueled vehicles, which accounted for 76.5–90.4 % of the contributions of these four pollutants in both years. OC emissions from gasoline-fueled and diesel-fueled vehicles
25
were similar, and the differences were all within 6.5 % in 2006 and 2010.
ACPD
14, 4905–4956, 2014Vehicular emissions in China in 2006 and
2010
N. Chao et al.
Title Page
Abstract Introduction
Conclusions References
Tables Figures
◭ ◮
◭ ◮
Back Close
Full Screen / Esc
Printer-friendly Version Interactive Discussion
Discussion
P
a
per
|
D
iscussion
P
a
per
|
Discussion
P
a
per
|
Discuss
ion
P
a
per
|
RVs is not considered in this part. In 2006, the Euro II emissions standard was im-plemented throughout China, and the Euro III emission standard was imim-plemented in most provinces in 2010, except in Beijing, where the Euro IV emission standard was implemented. The results show that in 2006, Euro 0 and I vehicles were the major con-tributors to emissions, accounting for approximately 69.1–91.1 % of the emissions of
5
each pollutant. The contributions of Euro I vehicles were the most significant. In 2010, Euro 0 to II vehicles made great contributions to the emissions of most pollutants (ex-cept the NH3), accounting for approximately 72.7–88.8 % of the emissions, and Euro
I vehicles were again the greatest contributors. Euro III vehicles were the major con-tributors to the emissions of NH3, and the contribution was as high as 68.0 % because 10
of the use of TWC. Therefore, eliminating the vehicles with old emission standards appropriately could effectively reduce the vehicular emissions.
3.2 The contribution of each vehicle category and emissions standard to
emissions by province
Total emissions in each province in both years were listed in the Tables S4 and S5.
15
Figures 3 and 4 illustrate the provincial differences in the contributions of vehicle cat-egories to emissions in 2006 and 2010. The contributions of each vehicle category to emissions in each province varied from one another, due to the variety of vehicle com-positions in each province. In 2006, LDGVs were the major contributors to CO, VOCs, and NH3emissions, and HDDVs were the major contributors to NOx, PM2.5, PM10, BC, 20
and OC emissions in Beijing, Tianjin, and Shanghai. In other provinces, MCs were the major contributors to CO, VOCs, NH3, and OC emissions; RVs were the major contrib-utor to NOxemission; and HDDTs were the major contributors to PM2.5, PM10, and BC
emissions (except Hebei, Anhui, Shandong, and Henan, where PM2.5, PM10, and BC
emissions were primarily from RVs). These differences could be due to the large
pop-25
ACPD
14, 4905–4956, 2014Vehicular emissions in China in 2006 and
2010
N. Chao et al.
Title Page
Abstract Introduction
Conclusions References
Tables Figures
◭ ◮
◭ ◮
Back Close
Full Screen / Esc
Printer-friendly Version Interactive Discussion
Discussion
P
a
per
|
D
iscussion
P
a
per
|
Discussion
P
a
per
|
Discuss
ion
P
a
per
motorcycles have been implemented. In 2010, LDGVs were the major contributors to CO, VOCs, NH3, and OC emissions, and HDDVs were the major contributors to NOx,
PM2.5, PM10, and BC emissions in Beijing. In other provinces, LDGVs were the major
contributors to CO and NH3emissions, MCs were the major contributors to VOCs and OC emissions, RVs were the major contributors to NOx emissions, and HDDTs were 5
the major contributors to PM2.5, PM10, and BC emissions (except in Hebei, Anhui,
Shandong, and Henan, where these emissions were primarily from RVs). Therefore, measures to reduce provincial emissions should be taken individually, according to the specific major contributors to emissions in each province.
The contributions of vehicles with different emission standards in each province in
10
2006 and 2010 were the same as the characteristics of the whole nation generally, as shown in Figs. S1 and S2. In 2006, the Euro I vehicles were the primary contributors to pollutant emissions (except NH3), followed by vehicles with Euro 0 emissions
stan-dard in most provinces. In 2010, the contributions of Euro 0 to Euro II vehicles to CO emissions both hovered 27 % approximately in most provinces. Euro III vehicles
con-15
tributed more to NOx emissions; thus, emissions from Euro 0 vehicles were reduced
accordingly from 2006 to 2010. VOCs emissions from Euro I vehicles were compara-ble to Euro II vehicles and higher than Euro 0. NH3emissions were mainly from Euro
IV vehicles in Beijing, which accounted for approximately 60.3 %, as shown in Fig. 5. The total contribution of Euro III and Euro IV vehicles was as high as 88.1 %. In other
20
provinces, the NH3emissions were mainly from Euro III vehicles, which accounted for
54.7 % to 82.5 %. Tianjin had the greatest contribution from Euro III vehicles (82.5 %), followed by Zhejiang (79.6 %), Shaanxi, Chongqing, Shanghai, Jiangsu, Guizhou, and Sichuan, where were all above 75.0 %.
3.3 Spatial distribution of vehicular emissions
25
char-ACPD
14, 4905–4956, 2014Vehicular emissions in China in 2006 and
2010
N. Chao et al.
Title Page
Abstract Introduction
Conclusions References
Tables Figures
◭ ◮
◭ ◮
Back Close
Full Screen / Esc
Printer-friendly Version Interactive Discussion
Discussion
P
a
per
|
D
iscussion
P
a
per
|
Discussion
P
a
per
|
Discuss
ion
P
a
per
|
acteristics in their spatial distribution; thus, CO and NH3 emissions in 2006 and 2010 are shown as examples in Fig. 6.
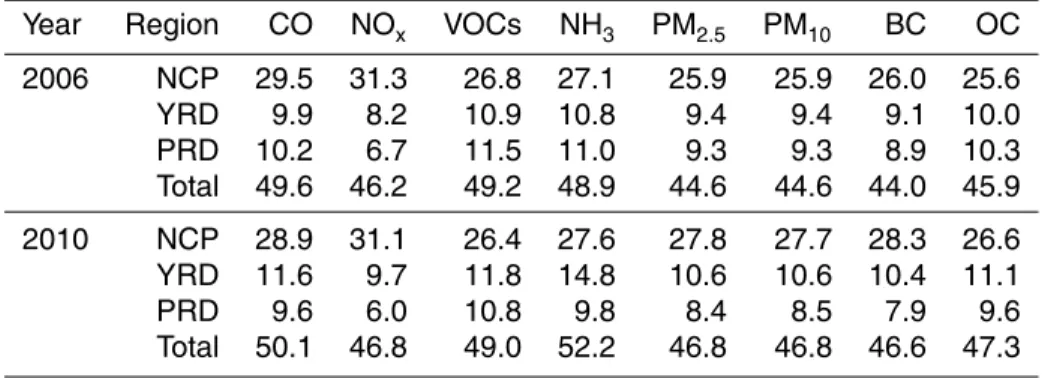
Figure 6 clearly illustrates that vehicular emissions in China presented significant re-gional spatial distributions. Emissions in the eastern and southern parts of China were much higher than those in western and northern parts in 2006 and 2010. The NCP
5
(the North China Plain, including Beijing, Tianjin, Hebei, Shandong, and Henan), YRD, and PRD regions, which cover only 8.4 % of Chinese territory, generated approximately 50 % of the total emissions in 2006 and 2010. The details are shown in Table 4. The high emissions in these regions were mainly concentrated in the large capital cities with large numbers of motor vehicles and dense networks of busy roads. The three
10
provinces of northeastern China, the Sichuan Basin, Wuhan and Urumqi regions, also had high emissions. It is worth noting that NH3emissions increased significantly from
2006 to 2010, as shown in Fig. 6a-2 and b-2, and the intensity in Beijing was signifi-cantly higher than in other cities because of the use of three-way catalytic converters on Euro III and IV vehicles, but few studies have focused on this issue domestically.
15
Most existing spatial distribution method show that pollutants are mainly centralized in areas with large populations and developed economies because they use the eco-nomic indices and demographic information to allocate information on the grid. Our methodology was able to assign emissions to remote or sparsely populated but busy regions with a high resolution by using the busyness of the roads and road network
20
information, and the results have been demonstrated to approximate the actual road emissions.
4 Discussion
4.1 Comparison with previous studies
Vehicular emissions of previous studies, both domestic and international, are
summa-25
ACPD
14, 4905–4956, 2014Vehicular emissions in China in 2006 and
2010
N. Chao et al.
Title Page
Abstract Introduction
Conclusions References
Tables Figures
◭ ◮
◭ ◮
Back Close
Full Screen / Esc
Printer-friendly Version Interactive Discussion
Discussion
P
a
per
|
D
iscussion
P
a
per
|
Discussion
P
a
per
|
Discuss
ion
P
a
per
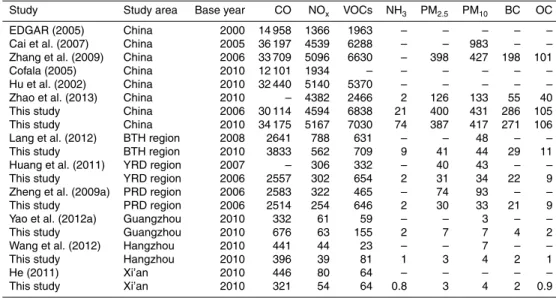
China’s total vehicular emissions for each pollutant in 2006 in our study were highly consistent with the inventory developed by Zhang et al., which was one of important achievements of the INTEX-B program executed by NASA and which has been widely acknowledged for its reliability. Specifically, the differences in CO and NOx emissions were within 10.7 % and 10.9 %, respectively; VOCs and OC emissions were within 4 %;
5
and PM2.5 and PM10 were within 1 %. In contrast, there was a large difference in BC
emissions, up to 30.7 %, which may have been caused by the uncertainties in emis-sion factors. A glaring discrepancy has emerged between the results of our study and RAINS, which calculated the vehicular emissions based on fuel consumption as esti-mated by the RAINS-ASIA module. That method used the fuel consumption in 1990
10
to predict the corresponding data in 2010, which inevitably led to uncertainties. The emissions in 2010 estimated in our study did not agree well with results calculated by Zhao et al. (2013) (except the NOxemission) either, because emission factors given in
their paper were different from ours and there were some differences in vehicle classi-fications.
15
Vehicles emissions in BTH, YRD, and PRD regions had been calculated by some scholars and were also showed in Table 5. Compared with these studies, differences could be found. These might have been caused by the sources of fuel ratio and the VTM. It should be noted that emissions from RVs were significant but were neglected in Lang’s and Huang’s study, and the emission standards were out of consideration in
20
Zheng’s study. Considering the old technology of vehicles registered earlier, emission factors of Euro 0 vehicles in our study were revised by referring previous studies, as discussed in Sect. 2.1.3. Therefore, big differences could be found in CO, NOx, and VOCs emissions, compared with these three studies. Emissions on the city scale were also compared in this study. For example, emissions in Hangzhou in our study were
25
ACPD
14, 4905–4956, 2014Vehicular emissions in China in 2006 and
2010
N. Chao et al.
Title Page
Abstract Introduction
Conclusions References
Tables Figures
◭ ◮
◭ ◮
Back Close
Full Screen / Esc
Printer-friendly Version Interactive Discussion
Discussion
P
a
per
|
D
iscussion
P
a
per
|
Discussion
P
a
per
|
Discuss
ion
P
a
per
|
been conducted in vehicular emission of NH3, and this may lead to the underestimation of total NH3emissions, therefore, more researches should be done on it.
4.2 Analysis of vehicular emissions and oil consumption
Theoretically speaking, oil consumption can generally characterize vehicular emis-sions, but it was not involved in the calculations in the present work. Therefore, the
5
correlation between oil consumption and vehicular emissions was analyzed here to analyze the accuracy of the emissions results.
As shown in Fig. 7, the spatial distribution of oil consumption, which is available from the China Energy Statistical Yearbook compiled by the National Bureau of Statistics (2006, 2010), agreed closely with vehicular emissions on the whole, with a
correla-10
tion coefficient of 0.83 in 2010. As shown in Fig. 8a, in 2010, oil consumption in the coastal areas of China was much higher than in the western region, and provinces with high oil consumption shared much contribution of emissions, such as Guangdong, Shandong, Jiangsu, and Zhejiang. But in Hebei and Henan the high emissions did not accompanied with very significant oil consumption. It was because that the
num-15
bers of RVs and MCs were large in these provinces and emission factors of these two kinds of vehicles were high. From 2006 to 2010, the oil consumption and vehicular emissions all increased in most provinces, especially in Shanxi, Liaoning, Guizhou, and Qinghai, where oil consumption increased by more than 60 % and CO emissions increased by more than 33 %. However, in Beijing, Shanghai, and Jiangsu, oil
con-20
sumption increased by approximately 40 % from 2006 to 2010, as shown in Fig. 8b, but CO emissions declined slightly. This difference could be attributed to the tighter emission standards in these cities and provinces. Beijing has played a leading role in implementing emission standards, and good results have been achieved. Shanghai and Jiangsu also actively implement the emission standards on newly registered
ve-25
ACPD
14, 4905–4956, 2014Vehicular emissions in China in 2006 and
2010
N. Chao et al.
Title Page
Abstract Introduction
Conclusions References
Tables Figures
◭ ◮
◭ ◮
Back Close
Full Screen / Esc
Printer-friendly Version Interactive Discussion
Discussion
P
a
per
|
D
iscussion
P
a
per
|
Discussion
P
a
per
|
Discuss
ion
P
a
per
4.3 Comparison with satellite data
Because both the life expectancy and transmission of NO2in the atmosphere are short,
the NO2 concentration observed by satellite can establish a direct link with the NOx
emissions on the ground. Fossil energy use is one of the important anthropogenic sources of NOx emissions, particularly fuel consumption by motor vehicles, whose 5
emissions are one of the main driving forces of NOx in the atmosphere. Therefore,
the spatial distribution of NO2observed by satellites can partially reflect the spatial dis-tribution of vehicular emissions in polluted areas. We took NOxemissions from vehicles
in 2010 and the variations from 2006 to 2010 as examples to compare with the NO2
column densities observed by the SCIA satellite, as shown in Fig. 9.
10
From Fig. 9c-1, it seems that high NO2emissions are mainly distributed in the NCP,
YRD, and PRD regions in 2010, followed by the three Northern Provinces, Sichuan Basin, Wuhan, and Urumqi regions. This pattern agrees well with the vehicular emis-sions calculated in this study, as shown in Fig. 9d-1. But there are small differences, for example, the vehicular emissions in Tianjin, south of Hebei, and north of Shandong
15
were less significant in 2010, as shown in Fig. 9d-1 compared with Fig. 9c-1. To under-stand these differences further, we collected the coal consumption, which is also one of the most important contributors of fossil energy of NOx emissions. The coal
con-sumption was obtained from the China Energy Statistical Yearbooks (2006, 2010), and then we used it to calculate the coal consumption per area in each province. As shown
20
in Fig. 10a, Tianjin, Shandong, and Hebei were among the top five provinces in coal consumption in 2010, which could have led to the high NOxemissions in these regions. Therefore, high NO2emission could be observed by satellite when vehicular emissions
were not significant. Furthermore, from 2006 to 2010, the variations of the NO2column
density were not highly consistent with the vehicular NOx emissions, e.g., in Tianjin,
25
ACPD
14, 4905–4956, 2014Vehicular emissions in China in 2006 and
2010
N. Chao et al.
Title Page
Abstract Introduction
Conclusions References
Tables Figures
◭ ◮
◭ ◮
Back Close
Full Screen / Esc
Printer-friendly Version Interactive Discussion
Discussion
P
a
per
|
D
iscussion
P
a
per
|
Discussion
P
a
per
|
Discuss
ion
P
a
per
|
in Tianjin, Shandong, Jiangsu, Hebei, and Henan. Therefore, the variations of the NO2 levels observed by satellite in these regions were also high, as shown in Fig. 9c-2 but not reflected in Fig. 9d-2. By this analysis, a conclusion can be draw that the increase of NOx in China from 2006 to 2010 can be attributed to the heavy utilization of energy, and the coal consumption shares more contribution.
5
4.4 Policy impacts on vehicular emissions
Compared with 2006, the total fuel consumption of China in 2010 increased by 46.6 % on average, and the total number of Euro 0 to I vehicles decreased by 6.5 %, whereas the total number of other emission standard vehicles rose by 385.6 %. However, a small increase was shown in vehicular emissions of CO, NOx, VOCs, and OC: 13.5 % for CO, 10
12.5 % for NOx, 2.8 % for VOCs, and 1.1 % for OC. PM2.5, PM10, and BC emissions declined, as discussed in Sect. 3.1. Therefore, an interesting conclusion was draw in our study that the number of vehicle increased dramatically from 2006 to 2010, while the vehicular emissions calculated in this study did not show significant increase trend. Driven by curiosity, further work was conducted.
15
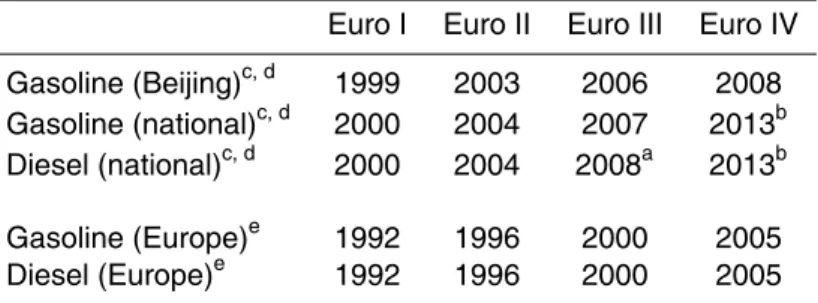
This modest increase in vehicular emissions can be attributed to the implementation of vehicle emissions standards. Table 6 illustrates the schedule of emission standard implementation for different vehicle types in China. For gasoline vehicles, the timing of implementation of the emission standards in most provinces is the same as at the na-tional level, whereas that of Beijing was much earlier. Specifically, the implementation
20
time of Euro I to III emission standards was one year earlier in Beijing than in other provinces, and the implementation of Euro IV was much earlier. Diesel vehicle stan-dards were implemented at the same time across the nation. In the target years of this study, the Euro II emission standard was implemented in 2006, and the Euro III emis-sion standard was implemented in 2010 (except in Beijing, where Euro III and IV were
25
ACPD
14, 4905–4956, 2014Vehicular emissions in China in 2006 and
2010
N. Chao et al.
Title Page
Abstract Introduction
Conclusions References
Tables Figures
◭ ◮
◭ ◮
Back Close
Full Screen / Esc
Printer-friendly Version Interactive Discussion
Discussion
P
a
per
|
D
iscussion
P
a
per
|
Discussion
P
a
per
|
Discuss
ion
P
a
per
country increased rapidly. In addition, vehicular emissions in Beijing did not increase significantly between 2006 and 2010 because of the implementation of the Euro IV emission standard, as discussed in Sect. 4.2. Therefore, the appropriate restriction of vehicular emissions can effectively reduce pollutants.
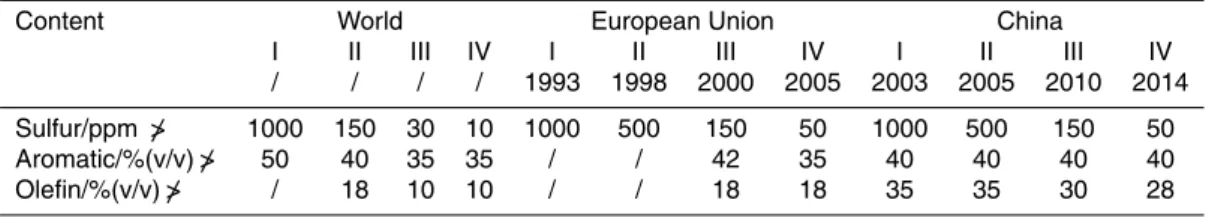
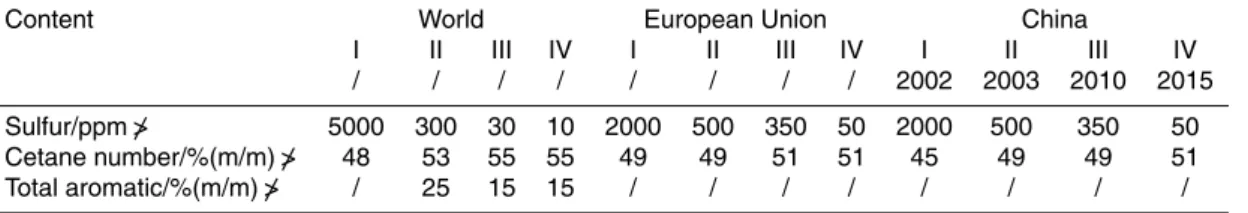
As the new emissions standards have been implemented, the oil quality has
im-5
proved correspondingly. The key parameters for gasoline and diesel with each standard are summarized in Tables 7 and 8. As shown in these tables, the sulfur content in the oil decreased incrementally, which means that catalyst pollution was reduced. Olefin in gasoline is also decreasing. As a result, oil burning can be more efficient and less PM is produced. In addition, the cetane level in diesel was increased appropriately as the
10
new standard was implemented, which can improve the efficiency of oil combustion. All of these improvements can lead to a reduction in vehicular emissions.
To analyze the effects of emission standards and oil quality (sulfur level) deeply, we proposed four scenarios (S1–S4) to calculate the vehicular emissions in 2010 by refereeing the research of Liu et al. (2008). The scenario designs and results are listed
15
in Table 9. In S1 both the emission standard and sulfur level can only meet the Euro I standard; In S2 the emission standard remains the same as S1, but sulfur level can meet Euro III standard; In S3 the emission standard can meet the Euro III standard, but sulfur level is not improve compared with S1; In S4 both of the emission standard and sulfur level are all improved to meet the Euro III standard (Euro IV for Beijing),
20
which was implemented currently.
Compared with S4, if both of the emission standard and sulfur level were not im-proved, as described in S1, vehicular emissions of CO, NOx, and VOCs could increase
52 %, 9 %, and 68 %, respectively; if only the sulfur level was improved, as described in S2, emissions of CO, NOx, and VOCs could increase 35 %, 1 %, and 49 %, respec-25
tively; if only the emission standard was improved, as described in S3, CO, NOx and
ACPD
14, 4905–4956, 2014Vehicular emissions in China in 2006 and
2010
N. Chao et al.
Title Page
Abstract Introduction
Conclusions References
Tables Figures
◭ ◮
◭ ◮
Back Close
Full Screen / Esc
Printer-friendly Version Interactive Discussion
Discussion
P
a
per
|
D
iscussion
P
a
per
|
Discussion
P
a
per
|
Discuss
ion
P
a
per
|
Therefore, stricter emission standard should be introduced accompanied by oil quality improvement.
Although China has make great efforts to improve its oil quality, the implementation of each oil standard was nearly ten years later than in the European Union, especially the IV standard, which cannot be implemented widely in China until the year of 2014
5
for gasoline and 2015 for diesel. This is one reason that the Euro IV emission standard cannot be implemented sooner. Not only are the implementation times of each stan-dard later than Europe’s, but the level of sulfur in the oil also cannot reach the world standards level, and the technology for controlling the content of aromatics and olefin in gasoline and the cetane number and aromatics in diesel is still behind the European
10
Union and world standards. Therefore, technological improvements should be contin-ued to reduce the vehicular emissions so that China can reach the world standards sooner.
4.5 Uncertainty analysis
Uncertainty analysis is an important component of a complete inventory. This process
15
comprehensively embodies the uncertainties originating from the emission factors and the corresponding activity data. There are many ways to characterize the uncertainty in emissions inventories, including qualitative, semi-quantitative, and quantitative ap-proaches (Wei et al., 2011). In this paper, the uncertainties of vehicular emission in-ventory in China were quantitatively evaluated with Monte Carlo simulations, depending
20
on the data availability. Lognormal distribution was used to describe the uncertainties of activity data and emission factors, and this distribution can avoid negative values occurring during the simulation (Wei et al., 2011; Zhao et al., 2011; Fu et al., 2013). The reliability of date sources and estimation methods were used to estimate the stan-dard deviations of the distribution based on the expert judgment. After 10 000 times
25
ACPD
14, 4905–4956, 2014Vehicular emissions in China in 2006 and
2010
N. Chao et al.
Title Page
Abstract Introduction
Conclusions References
Tables Figures
◭ ◮
◭ ◮
Back Close
Full Screen / Esc
Printer-friendly Version Interactive Discussion
Discussion
P
a
per
|
D
iscussion
P
a
per
|
Discussion
P
a
per
|
Discuss
ion
P
a
per
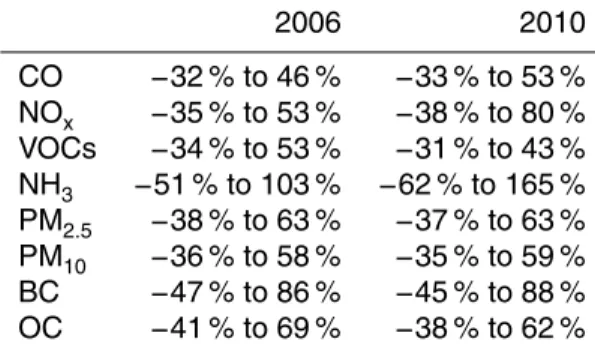
In 2006, the overall uncertainties for CO, NOx, VOCs, NH3, PM2.5, PM10, BC, and OC are−32 % to 46 %,−35 % to 53 %,−34 % to 53 %,−51 % to 103 %,−38 % to 63 %,
−36 % to 58 %,−47 % to 86 %, and−41 % to 69 %, respectively. These uncertainties mainly caused by the fuel ratio, VTM, and emission factors. As discussed in Sect. 2.1.2, the fuel ratios and VTM are not available from official statistics directly. Therefore, the
5
uncertainties were aroused inevitably. Science the emission standards were taken into consideration in this study, the emission factors would be various from one standard to another. However, there was not enough deep research on emission factors of vehi-cles with each standard, especially on the vehivehi-cles registered early, which share much contribution to the emissions. Uncertainties of BC, and OC were high than CO, NOx,
10
VOCs, PM2.5, and PM10 because the emission factors of them are calculated accord-ing to the fraction of these three particulate matters in relation to the total PM10. Few
researched were conducted on vehicular NH3emission, so NH3emission factors used
in this study were all from the results of EPA, but these might not be suitable to China. Therefore, uncertainties of NH3emissions were much higher than other pollutants. 15
Compared with 2006, uncertainties of emissions in 2010 were a little higher gener-ally. Except the major contributors mentioned before, the uncertainties might be caused for the lack of population of rural vehicles in 2010 as well. Because the rural vehicles in 2010 were not available from the statistic book, we amused that little change has taken place in the population of rural vehicles from 2006 to 2010. Uncertainties of NH3
20
emissions increased a lot in 2010 because Euro III vehicles shared much contribution to NH3 emissions, while the uncertainties of NH3emission factors were high.
5 Conclusions
Vehicular emissions in China in 2006 and 2010 were calculated based on statistical data released by the State Statistics Bureau and additional relevant emission
fac-25
ACPD
14, 4905–4956, 2014Vehicular emissions in China in 2006 and
2010
N. Chao et al.
Title Page
Abstract Introduction
Conclusions References
Tables Figures
◭ ◮
◭ ◮
Back Close
Full Screen / Esc
Printer-friendly Version Interactive Discussion
Discussion
P
a
per
|
D
iscussion
P
a
per
|
Discussion
P
a
per
|
Discuss
ion
P
a
per
|
20.9, 400.2, 430.5, 285.6, and 105.1 Gg, respectively, in 2006 and 34 175.2, 5167.5, 7029.4, 74.0, 386.4, 417.1, 270.9, and 106.2 Gg, respectively, in 2010. CO, VOCs, and NH3 emissions were mainly from motorcycles and light-duty gasoline vehicles,
whereas NOx, PM2.5, PM10, and BC were mainly from rural vehicles and heavy-duty diesel trucks. OC was mainly from motorcycles and heavy-duty diesel trucks. Euro 0
5
and Euro I vehicles were the main contributors to all emissions, except NH3, which was
mainly from Euro III and Euro IV vehicles.
The spatial distribution of emissions with a resolution of 0.25◦×0.25◦ was devel-oped using GIS. Emissions in the eastern and southern parts of China were much higher than those in western and northern parts in both years. The NCP, YRD, and
10
PRD regions generated nearly 50 % of the total emissions of each pollutant in both years, followed by the three provinces of Northeastern China, the Sichuan Basin, and the Urumqi region. These results show good agreement with satellite data and the distribution of fuel consumption, and the spatial distribution method used in this study was demonstrated to be very practical. The total emissions estimated in this study are
15
roughly equal to most previous studies.
Although the number of vehicles has increased dramatically, the total emissions of all the pollutants except NH3 changed little from 2006 to 2010. This finding can be
attributed to the implementation of strict emission standards and to improvements in oil quality. Therefore, restricting the vehicular emissions appropriately and rapidly
im-20
proving oil quality are effective measures for controlling vehicular emissions. However, the implementation of the Euro IV emission standards has been postponed repeatedly because the oil quality still cannot satisfy the needs of the new emission standard. Therefore, the responsible departments should speed the improvement of oil quality. In addition, further research on NH3emissions should be conducted.
25
ACPD
14, 4905–4956, 2014Vehicular emissions in China in 2006 and
2010
N. Chao et al.
Title Page
Abstract Introduction
Conclusions References
Tables Figures
◭ ◮
◭ ◮
Back Close
Full Screen / Esc
Printer-friendly Version Interactive Discussion
Discussion
P
a
per
|
D
iscussion
P
a
per
|
Discussion
P
a
per
|
Discuss
ion
P
a
per
in China and can provide reliable data for regional air quality modeling, policy-making, and air-quality improvement.
Supplementary material related to this article is available online at http://www.atmos-chem-phys-discuss.net/14/4905/2014/
acpd-14-4905-2014-supplement.pdf.
5
Acknowledgements. This work was supported by the Chinese Academy of Sciences Strate-gic Priority Research Program Grant (Grant No.: XDB05020000). We are grateful to all of the teammates for their sincere help and support.
References
10
Beijing University of Technology: Technical report of Beijing Municipal Science and Technology Project, Beijing, 2012.
Bouwman, A. F., Lee, D. S., Asman, W. A. H., Dentener, F. J., Van Der Hoek, K. W., and Olivier, J. G. J.: A global high-resolution emission inventory for ammonia, Global Bio-geochem. Cy., 11, 561–587, 1997.
15
Cai, H. and Xie, S.: Estimation of vehicular emission inventories in China from 1980 to 2005, Atmos. Environ., 41, 8963–8979, 2007.
Cao, G., Zhang, X., Gong, S., An, X., and Wang, Y.: Emission inventories of primary particles and pollutant gases for China, Chinese Sci. Bull., 56, 781–788, 2011.
Che, W., Zheng, J., and Liuju, Z.: Vehicle exhaust emission chatacteristics and contribution in
20
the Pearl River Delta Region (in Chinese), Research of Emvironmental Sciences, 22, 456– 461, 2009.
China Automobile Industry Association: China Automotive Industry Yearbook [M], China Ma-chine Press, Beijing, 2002–2006.
Cofala, J.: Scenarios of world anthropogenic emissions of air pollutants and methane
25
ACPD
14, 4905–4956, 2014Vehicular emissions in China in 2006 and
2010
N. Chao et al.
Title Page
Abstract Introduction
Conclusions References
Tables Figures
◭ ◮
◭ ◮
Back Close
Full Screen / Esc
Printer-friendly Version Interactive Discussion
Discussion
P
a
per
|
D
iscussion
P
a
per
|
Discussion
P
a
per
|
Discuss
ion
P
a
per
|
Durbin, T. D., Wilson, R. D., Norbeck, J. M., Miller, J. W., Huai, T., and Rhee, S. H.: Estimates of the emission rates of ammonia from light-duty vehicles using standard chassis dynamometer test cycles, Atmos. Environ., 36, 1475–1482, 2002.
Fu, L., Hao, J., He, D., and He, K.: The emisson chacteristics of pollutants from motor vehicles in Beijing, Environm. Sci., 21, 68–70, 2000 (in Chinese).
5
Fu, L., Hao, J., He, D., He, K., and Li, P.: Assessment of vehicular pollution in china, J. Air Waste Manage., 51, 658–668, 2001.
Fu, X., Wang, S., Zhao, B., Xing, J., Cheng, Z., Liu, H., and Hao, J.: Emission inventory of primary pollutants and chemical speciation in 2010 for the Yangtze River Delta region, China, Atmos. Environ., 70, 39–50, 2013.
10
Goebes, M. D., Strader, R., and Davidson, C.: An ammonia emission inventory for fertilizer application in the United States, Atmos. Environ., 37, 2539–2550, 2003.
He, C.: Study on vehicle emission pollution and control strategies in Xi’an [D], Chang’an Uni-versity, Chang’an, 2011 (in Chinese).
Heeb, N. V., Forss, A.-M., Brühlmann, S., Lüscher, R., Saxer, C. J., and Hug, P.: Three-way
15
catalyst-induced formation of ammonia–velocity- and acceleration-dependent emission fac-tors, Atmos. Environ., 40, 5986–5997, 2006a.
Heeb, N. V., Saxer, C. J., Forss, A.-M., and Brühlmann, S.: Correlation of hydrogen, ammonia and nitrogen monoxide (nitric oxide) emissions of gasoline-fueled Euro-3 passenger cars at transient driving, Atmos. Environ., 40, 3750–3763, 2006b.
20
Heeb, N. V., Saxer, C. J., Forss, A.-M., and Brühlmann, S.: Trends of NO-, NO2-, and NH3 -emissions from gasoline-fueled Euro-3- to Euro-4-passenger cars, Atmos. Environ., 42, 2543–2554, 2008.
Hu, B., Zhu, H., and Qing, W.: A detailed list for exhaust in development models of automobile technology in China, Journal of Wuhan University of Technology (Information & Management
25
Engineering), 24, 99–102, 2002 (in Chinese).
Huang, C., Chen, C. H., Li, L., Cheng, Z., Wang, H. L., Huang, H. Y., Streets, D. G., Wang, Y. J., Zhang, G. F., and Chen, Y. R.: Emission inventory of anthropogenic air pollutants and VOC species in the Yangtze River Delta region, China, Atmos. Chem. Phys., 11, 4105–4120, doi:10.5194/acp-11-4105-2011, 2011.
30