INTERNATIONAL RESEARCH JOURNAL OF PHARMACY
www.irjponline.com
ISSN 2230
–
8407
Research Article
FORMULATION AND EVALUATION OF MATRIX TABLETS BASED ON
POLYELECTROLYTE COMPLEX BETWEEN OKRA MUCILAGE AND CHITOSAN
Ashwini Rajendra
1*, Bushetti S S
21
National college of Pharmacy, Shivamogga, Karnataka, India
2
HKE College of Pharmacy, Gulbarga, Karnataka, India
Article Received on: 19/12/11 Revised on: 16/01/12 Approved for publication: 10/02/12
*Email: [email protected]
ABSTRACT
Recent years there has been greater utilization of natural polymers in the development of delivery systems. The present work is an effort towards development of matrix tablets using polyelectrolyte complex formed between the oppositely charged natural polymers like okra mucilage obtained from pods of
Abelmoschus esculentus and chitosan. The effect of pH and polymer volume ratio on yield of polyelectrolyte complex was studied. It was observed that the
yield was maximum (96.45%) at pH 5 and at polymer volume ratio of 9:1 between okra mucilage and chitosan. The prepared polyelectrolyte complex was also characterised by conductimetry, FTIR, DSC. The results confirmed the formation of polyelectrolyte complex between the natural polymers. The matrix tablets were formulated for model drug diclofenac sodium using the best polyelectrolyte complex at different drug to polymer ratios and compared with formulations containing individual polymers as well as marketed formulation. The prepared formulations showed satisfactory physical parameters. Formulations F2 and F3 extended the drug release for more than 8 h with (83.87± 0.8321%) and (77.125± 0.125%) drug release respectively in 8 h. The formulations F2 and F3 followed zero order kinetics with anomalous diffusion mechanism. The mean dissolution times were 3.6042 and 3.5935 hrs and the % dissolution efficiency were 54.9467 and 55.7203 % for formulations F2 and F3 respectively. The similarity factor f2 for formulation F2 was 61.6751 and for formulation F3, it was
found to be 60.5025.The formulations were found to be stable.
KEYWORDS Polyelectrolyte complex, matrix tablets, okra mucilage, diclofenac sodium, chitosan
INTRODUCTION
Recently there has been greater revolution in the field of pharmaceutics in design of new techniques for drug delivery. The newer drug delivery techniques not only control the rate of drug delivery, they sustain the duration of therapeutic activity and/or target the drug to specific site in the body. These newer techniques have led to the development of several novel drug delivery systems. Last few decades have witnessed a revolution in polymer science. The polymers which respond to changes in temperature, pH, electric or magnetic field have been synthesized. The chemically synthesized polymers have various drawbacks like cytotoxicity, non biodegradability and non biocompatibility, cost and difficulty in obtaining approval from regulatory authorities. There has been an increased tendency in enhancing the utility of the existing natural polymers by simple physical or chemical modifications. Most of the natural polymers are either polyanionic or polycationic in nature. This property is useful in modifications of the natural polymers.
The interaction between two oppositely charged natural polymers results in the formation of a complex, termed as polyelectrolyte complex (PEC). These PECs meet the profile of requirements of biocompatible and biodegradable polymer systems with acceptance from the regulatory authorities. They can be adapted to meet the various requirements of modern dosage forms.
The PEC formation between oppositely charged polymers like chitosan(CH)- sodium CMC1, chitosan-alginate1, chitosan-carbopol1,2, chitosan-chondroitin sulphate3, chitosan-carboxymethyl guar gum4, Chitosan carboxymethyl Tamarind Kernel Powder5 Chitosan/pectin6 , polyvinyl pyrrolidone –carbopol7, polyvinyl pyrrolidone-carboxyvinyl polymer8, chitosan-poly (ethylene oxide)9, carrageenan and
chitosan10, chitosan-alginate and chitosan-carrageenan 11 have been utilized in the design of different drug delivery systems. This work is an attempt to physically modify abundantly available, cheaper natural polymer okra mucilage (OM). Okra mucilage is obtained from the fresh unripe pods of
Abelmoschus esculentus (L.) Moench of family Malvaceae. It is a hydrophilic polymer used as a binder12, 13, disintegrant14, suspending agent15, matrix forming material.16-19 It is composed of galactouronic acid, galactose and rhamnose.20, 21
MATERIALS AND METHODS
Diclofenac Sodium I.P, was a gift sample obtained from M/s. Emcure Pharma Ltd, Pune., chitosan ( DD >85%) was purchased from Sigma Aldrich, USA. Talc and Magnesium stearate were purchased from S.D. Fine Chemicals, Mumbai. Voveran SR 100 mg (B.No: 99040A) is a product of Novartis India Ltd. Okra pods were purchased from local market. All other reagents and chemicals used were of analytical grade and used as obtained.
Extraction of okra mucilage
Fresh unripe pods of okra (Ladies finger) were obtained from the local market. The pods were cut into very thin slices and the seeds were removed and then soaked in the distilled water (previously adjusted to pH 8 with 0.1 N NaOH) for 24 hrs, the swollen slices were then squeezed through muslin bags to obtain aqueous extract. To the aqueous extract twice the volume of alcohol (90%) was added to precipitate the mucilage. The mucilage was washed with petroleum ether and final precipitation was carried out with acetone.
Effects of parameters on formation of polyelectrolytes
variables on the formation of the PEC was expressed by the practical yield of complex formed.
Effect of pH and conductivity on formation of polyelectrolytes
The change in the pH and conductivity with respect to the addition of polyions at various mixture volume ratios was determined by using pH meter and conductivity meter with cell constant 0.8 cm -1 at 25° C, respectively. In all the cases, 0.2% w/v stock solutions of okra mucilage and chitosan in sodium acetate- acetic acid buffer pH 5 were prepared separately for the study .
Effect of polymer mixing ratio on the formation of PEC
The effect of polymer ratios on the formation of PECs was studied by estimation of dry complex yield when the polymers were mixed at different volume ratios like 90, 80, 70, 50, 30, 20, 10 ml of 0.2% w/v solution of okra mucilage in sodium acetate –acetic acid buffer pH 5 were taken in a 250 ml conical flask. To each flask 10,20 ,30, 50 ,70,80 and 90 ml of 0.2% w/v solutions of chitosan in sodium acetate –
acetic acid were added respectively to obtain a ratio of 9:1,8:2,7:3,1:1,3:7,2:8 ,1:9 of OM :CH respectively. The flasks were shaken on a rotary shaker for 4 hrs and kept aside for 24 h. The complex of the OM-CH was precipitated. The complexes were centrifuged at 2000 rpm for 10 min (Remi Research Centrifuge). The supernatant was decanted and the precipitate was washed with distilled water and dried at 50° C to constant weight and the yield of the dried PEC was calculated.
Effect of pH on the formation of polyelectrolyte complex
The PECs were prepared at different pH values. At pH values below 2.5 the complex formation did not take place. Hence the pH values of 3, 4, 5 and 6 were utilized for synthesis of the complex. The polyelectrolyte complexation reaction was found to be less effective at pH 6 and above. The yields of the PECs were determined at different pH values of 3-6 by mixing the 0.2 % w/v of okra mucilage and chitosan in acetate buffer solutions at different ratio mentioned. After mixing the dry yield of the complex was calculated. The polymer volume ratio giving highest yield was selected for tablet formulations. The dry complex was milled and passed through sieve #60 and stored in desiccator until further use.
Fourier transform infra red spectroscopy (FTIR)
The samples of drug, polymer and their mixture were prepared in the form of potassium bromide pellets and subjected for scanning from 4000 cm- 1 to 400 cm-1 using FT-IR spectrophotometer (FT-IR-8400, Shimadzu, Japan).
Differential scanning calorimeter (DSC)
Approximately 2 mg samples of drug, polymer, PEC and their formulations was taken in aluminum pan, sealed with aluminum cap and kept under nitrogen purging (atmosphere). The samples were scanned from 0-300°C with the scanning rate of 10°C rise/min using differential scanning calorimeter (DSC-60, Shimadzu, Japan).
Preparation of diclofenac sodium tablets
Diclofenac sodium matrix tablets were prepared using the selected PECs. Three formulations were prepared with varying ratios of drug: PEC viz 1:0.5, 1:1 and 1:1.5. The milled PEC was passed through mesh #60.To the PEC powder; the required quantity of drug was added. Then small volume of deionized water was added for uniform mixing and mixed thoroughly to form a paste and dried in a petri plate. The dried material was powdered and passed through mesh # 22. The tablets were prepared by the direct compression
technique using single station tablet compression machine (M/s. Cadmach, Ahmadabad, India) with 10.0 mm round Concave punches. Formulations were also prepared with only OM, CH and their Physical mixture (9:1 ratio) as matrix forming material at drug to polymer ratio of 1:1.5.
Pre –compression parameters of PEC and tablet formulations
The angle of repose (θ) was measured according to the fixed funnel method.The mean diameter of the base of the powder cone was determined and the tangent of the angle of repose was obtained .
θ= tan-1 h/r
Where (h) is the height of the powder pile and (r) is the radius of the base of the pile.
Compressibility index was calculated by using the following formula:
Where (V0) was the occupied volume, (V) was occupied
volume after 500 taps (V).22, 23
Standard physical test of tablets
The prepared tablets were evaluated for physical parameters like friability, hardness, weight variation, drug content using established methods.
Swelling index determination
The swelling index of the matrix tablets was determined by placing a tablet in a solution of phosphate buffer pH 6.8 for 8 hrs. The weight of the swollen tablet was determined after 1 hr interval. The swelling index was calculated using the following formula
W2-W1
SI = --- X 100 W1
Where W1 is weight of dry tablet and W2 is weight of wet
tablet after blotting the tablet surface with a tissue paper.
Drug content estimation
Randomly selected ten tablets of each formulation were crushed separately and transferred to 100 ml volumetric flasks. 50 ml methanol was added to the flask and sonicated for 10 min. The volume was adjusted with phosphate buffer pH 6.8 and vigorously shaken for 15 min. The resulted solution was filtered through 0.45 µ filter paper and suitably diluted and the drug content was estimated using UV spectrophotometer (Shimadzu 1601, Kyato, Japan) by measuring the absorbance at 276 nm .
Dissolution studies
studies for comparison of dissolution profiles .
Drug release mechanism
The dissolution data was fitted into zero order, first order, Higuchi24, Hixson Crowell’s cube root law24, Korsmeyer peppas model25 and Weibull26 equation. The release exponent was determined. The model independent kinetic parameters like mean dissolution time (MDT)27 and % dissolution efficiency (DE %)28 were also calculated. The similarity /difference between the prepared formulations were determined by calculating f2 and f1 factors.29
Statistical analysis
One way analysis of variance was determined to compare the dissolution profiles of best formulations with the marketed formulation. The value of p<0.05 was considered statistically significant.
Stability study
The stability studies were conducted for selected tablet formulations. The tablets were placed in stability chamber according to the International Committee on Harmonization guidelines. The tablets were packaged in high density polyethylene bottles with silica gel desiccant, and stored at 25±3°C/60±5% relative humidity and at 40±2°C/75±5% relative humidity for up to 6 months. The effect of storage on the drug content, hardness and dissolution profiles were investigated.
RESULTS AND DISCUSSION
Effect of pH on the formation of polyelectrolyte complex
PEC formation is a pH-sensitive process, since the charge and charge density of the polymers vary with pH. At pH values, where the charges are no longer balanced, a reduction in the interaction between the polymers causes a reduction in the complex yield . The PEC yield between okra mucilage and chitosan at different pH ranges was studied. Okra mucilage is a weak polyacid and the pH of 1% w/v aqueous solution was found to be in the range of 5 to 6.5. The pH of 1% w/v chitosan aqueous solution was found to be 6.4. The maximum yield of complex between okra mucilage and chitosan was obtained at pH 5. Above this pH, the complex yield started decreasing. Hence, in the present study the optimum condition of pH was selected as 5.0 for okra mucilage chitosan complex formation The results of pH conductivity study indicated the formation of PEC between OM and CH. The drug to polymer ratio, pH of the medium forming the PEC influenced the complex formation. The results indicated that maximum yield of the OM-CH complex was obtained, when CH solution was added to OM solution at the volume ratio of 1:9 and at pH 5.0. Hence, in the further studies for the preparation of tablet of diclofenac sodium, the polyelectrolyte complex PEC9:1 (OM:
CH) was chosen.
Effect of polymer mixing ratio on the formation of polyelectrolyte complex
The effect of polymer mixing ratios on the formation of polyelectrolyte complexes was studied by estimation of dry complex yield when the polymers were mixed at different volume ratios.
The yield of PEC at pH < 3 was negligible. The % yield was significantly increased at pH 4 (35.2% to 81.45%), at pH 5 (24.1% to 96.45%) and at pH 6(26.8% to 83.35%).The highest % yield was obtained at pH 5.The ratio between the polymers OM: CH that gave the highest % yield was 9:1(figure 1). The supernatant solutions were subjected to % transmittance studies. The % transmittance values ranged
from 54.2 to 89.2% at pH 4, 66.4 to 94.5% at pH 5 and 58.8 to 91.7% at pH 6(figure 2). The okra mucilage in acetate buffer formed a turbid solution whereas the chitosan solution in acetic acid sodium acetate buffer was transparent. When the different volume ratio of both the solutions were mixed the polymers interacted and formed polyelectrolyte complex and the polymer volume ratio of 9:1 between OM and CH at all the pH values showed highest % transmittance for supernatant solution indicating the completion of reaction between the oppositely charged polymers. Due to absence of solutes in the supernatant solutions the transmittance was higher. The transmittance study was performed at wavelength of 498 nm as at this wavelength the absorbance was very less for the solutions. The polymer volume ratio {9:1} between OM and CH which gave highest % yield at pH 5 was selected for tablet formulations. The effect of conductivity on the formation of PEC was studied. It was observed that the conductance values decreased from 16.4 mhos to11.8mhos as the volume of chitosan solution increased but thereafter there was negligible decline in the conductance values (figure 3).The viscosity of the supernatant solutions along with the buffer solutions was determined using Ostwald viscometer. For the supernatant solutions with higher amount of unreacted solute, the viscosity was determined with Brookfield viscometer DII. The relative viscosities were calculated. It was observed that the relative viscosity was lowest for the supernatant solutions of PEC at polymer volume ratio of 9:1 between OM and CH (figure 4).
FTIR spectroscopy and DSC thermograms
The complex formation was further investigated by FTIR and DSC. The FTIR studies confirmed the interaction-taking place between the amine functional group of chitosan and carboxyl group of the okra mucilage. (figure5)
The FTIR spectra of formulation F3 showed all the characteristic peaks of diclofenac sodium. The sodium salt of carboxylic acid stretch (COONa) at 1570.03 cm -1, secondary acyl amine (-NH-) stretch at 1550 cm -1 and chloride (Cl-) stretch at 748.47 cm -1 were present in both the spectra. The FTIR spectra indicated that the PEC could be formed by electrostatic interactions between the COO- group of OM and NH3+ group of chitosan when pH of the solution was 5. In the
FTIR spectra of chitosan, okra mucilage and PEC 9:1 the amino group of 2-aminoglucose unit and the carbonyl group of the 2-acetaminoglucose unit of chitosan showed absorption band at 1595 cm-1 and 1656 cm-1. The peak at 1760 cm-1 in the IR spectrum of okra mucilage was assigned to the carbonyl group of carboxylic acid. The IR spectrum of PEC showed that the peak at 1595 cm-1 which was assigned to the amine band of chitosan was shifted to 1640 cm-1 indicating that the amine group was protonated to NH3+ group in PEC.
The bands at 1550 cm-1 and 1408 cm-1were assigned to the symmetric and asymmetric stretching of the COO- group. In addition the NH3 peak was known to appear between 1600
and 1460 cm-1 moreover the peak of NH3 groups in the
complex between chitosan and okra mucilage was known to appear at 1520cm-1. Therefore the broad peak around 1550 cm-1 was believed to be the overlapped peak of COO- and NH3.
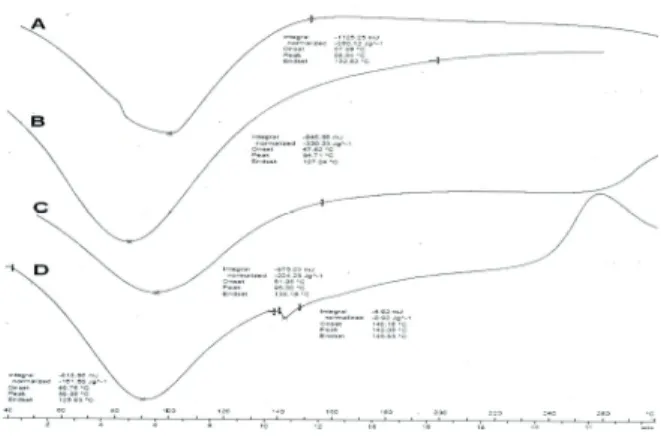
and 101.410 corresponding to dehydration and oxidative decomposition of diclofenac sodium and the sharp endothermic peak at 289.600 depicts the melting point of pure diclofenac sodium whereas the DSC thermograms of formulation F3 shows the peaks at 48.820, 90.360 and 274.030 C respectively (figure 7).
PEC matrix tablets of diclofenac sodium
Three different formulations of diclofenac sodium with PEC
9:1 at the ratio of drug to polymer 1:0.5, 1:1 and 1:1.5 were
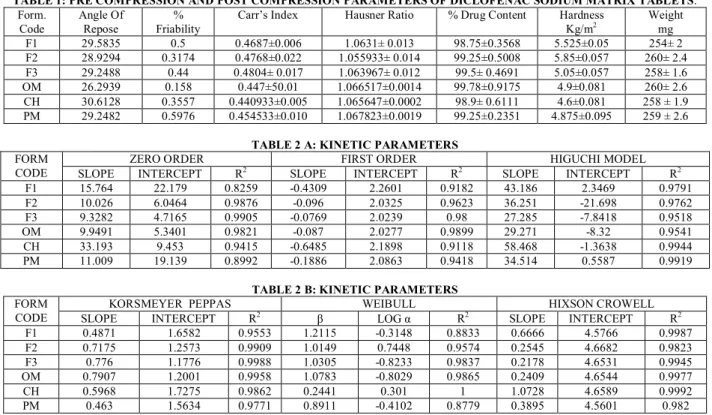
prepared. The prepared formulations showed satisfactory pre and post compression parameters (table 1). The angle of repose values ranged from 26.29390 to 30.61280. The Carr’s index values were < 10 whereas the hardness of the formulations was 4.870 to 5.85 kg/m2. The friability was less than 0.65%. The drug content for all the formulations varied between 98.832 to 99.931%.
Dissolution studies
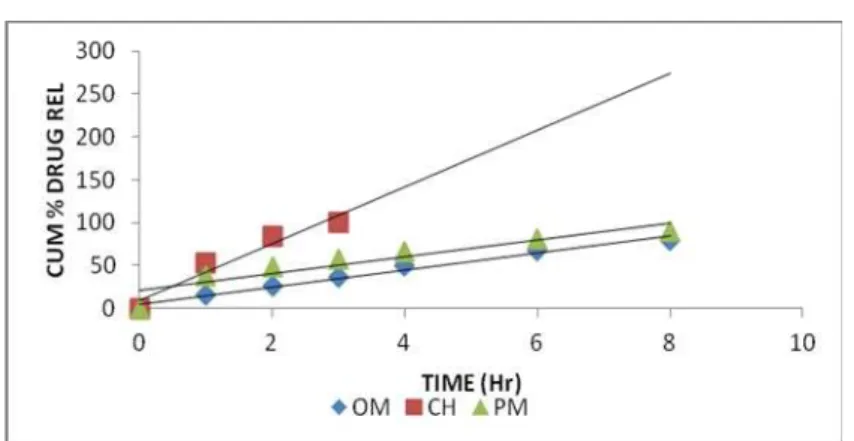
The results of pH, conductivity, FTIR, and DSC studies indicated that due to electrostatic interactions between the okra mucilage and chitosan, the formation of insoluble polyelectrolyte complex occurred. The drug is uniformly mixed in the prepared PECs by addition of small volume of deionized water. The drug release from these PEC containing formulations was uniform and extended for longer duration of time. The release from the PEC was extended for more than 8 h (figure 8). The release of drug from the PEC formulations decreased as the polymer concentration increased. The comparative dissolution profiles from the prepared formulations are shown in figure 8. The mechanism of drug release was established by constructing plots of cumulative percent drug released versus time (zero order) (figure 9 and 10), cumulative percent drug remaining versus time (first order), cumulative percent drug released versus time square root time (Higuchi diffusion) and cube root of fraction of drug remained to be released versus time (erosion). The linear correlation coefficient of the slopes for the zero order plots as shown in figure 9 and 10 indicated a good correlation for the diffusion mechanism was followed for PECs with higher concentration of polymers, whereas with low concentration of polymers the erosion mechanism was followed due to faster breakdown of the PECs into smaller particles.
Formulations F3 containing higher proportion of PEC could release the drug over an extended period of time. Formulations F2 and F3 extended the diclofenac sodium release for more than 8 h with (83.87± 0.8321%) and (77.125± 0.125%) drug release respectively in 8 h. Commercial sustained release product Voveran SR was also evaluated for comparison, which released 86.45± 0.65% of the drug over a period of 8 h. When the drug release mechanism from the PEC tablets was studied for Higuchi diffusion and erodible matrix systems, the linear relation of slopes indicated a positive correlation for both diffusion and erosion mechanisms of drug release (tables 2A and 2B). This may be due to the hydration of the tablet while dissolution causes the erosion and removal surface particles. The diffusion mechanism avoids the possibility of drug dumping due to the burst effect of matrix systems. Diclofenac sodium release from the prepared formulation F2, F3 and F4 showed a linear correlation for zero-order kinetics (r2=0.9876, 0.9905 and 0.9821 respectively. The release exponent value ‘n’ was 0.7 < n <1 indicating anomalous drug release from the above formulations. The commercial sustained release product
showed a favourable correlation for first-order kinetics with the diffusion mechanism. Hence, the release of diclofenac sodium from the experimental tablets is by anamolous diffusion with zero-order kinetics. The mean dissolution times for formulations F2 and F3 were 3.6042 and 3.5935 hr and the % dissolution efficiency was 54.9467 % and 55.7203 % respectively (table 3).
Evaluation of similarity and difference factor
The dissolution profiles of these tablets were also subjected for model independent methods proposed by Moore and Flanner.The difference factor (f1) and similarity factors (f2)
were calculated. In order to consider the similar dissolution profiles, the f1 values should be close to 0 and values f2
should be between50-100 and close to 100. In general, f1
values lower than 15 (0-15) and f2 values higher than 50
(50-100) show the similarity of dissolution profiles. The f1 and f2
values indicated a good correlation for F2 (f2 = 61.6751 and f1=9.4018) and for formulation F3 f2= 60.5025 and f1
=16.8927) when compared with commercial product.
Statistical evaluation
The in vitro dissolution profiles of the prepared formulations were compared with marketed formulation. The in vitro dissolution profile of formulation F3 was significantly different from that of marketed formulation (p<0.05) whereas the in vitro dissolution profile of formulation F2 was not statistically significant (p>0.05) (table 4).. This indicates that the formulation F3 shows extended release than the marketed formulation.
Stability study
The prepared formulations did not show change in hardness, drug content and in vitro drug release upon storage for 6 months.
CONCLUSION
From the results of the studies it can be concluded that formulations F2 and F3 were promising formulations in controlling the release of diclofenac sodium for extended period of time with zero-order release profile. The polyelectrolyte complex between okra mucilage and chitosan was successfully used for design of extended release formulations of diclofenac sodium.
ACKNOWLEDGMENT
The authors thank the principal and management of National College of Pharmacy, Shivamogga for their kind permission to carry out this work and their constant support.
REFERENCES
1. Saleem M.A., Azharuddin SK.MD. , Sadat Ali, C.C.Patil. Studies on different chitosan polyelectrolyte complex hydrogels for modified release of diltiazem hydrochloride. Int J. Pharm Pharm Sci. 2010; 2(4): ISSN- 0975-1491
2. Sung –Hyun Park, Chun M K, Hoo-Kyun Choi, Preparation of an extended release matrix tablet using chitosan/carbopol interpolymer complex, Int J. Pharm., 2008;347: 39-44.
3. Kaur G, Rana V, Jain S, Tiwary AK. Colon delivery of budesonide: Evaluation of chitosan-chondroitin sulphate interpolymer complex. AAPS Pharm Sci Tech2009; 11:36-45.
4. Vikas Kumar, Tiwary AK, Kaur G, Investigations on chitosan-carboxymethyl guar gum complexes interpolymer complexes for colon delivery of Fluticasone. Int. J. Drug Del. 2010; 2: 242-250.
5. Kaur G, Jain S, Tiwary AK. Chitosan carboxymethyl Tamarind Kernel Powder Interpolymer complexation:Investigations for Colon Drug Delivery. Sci. Pharm. 2010;78; 57-78.
6. Bigucci F, Luppi B, Cerchiara T et al Chitosan/pectin polyelectrolye complexes: selection of suitable preparative conditions for colon specific delivery of vancomycin. Euro J. Pharm Sci. 2006; 35: 435-441. 7. Srinivas L, Ramana Murthy KV. Preparation and evaluation of
interpolymer complexation of polyvinylpyrrolidone/carboxyvinyl polymer to control of drug release. Chem. Pharm. Bull.1987; 35: 4921-4927.
8. Patel VR., Amiji MM. Preparation and characterization of freeze-dried chitosan-poly (ethylene oxide) hydrogels for site-specific antibiotic delivery in the stomach. Pharmaceutical Research.1996; 13: 588–593. 9. Tomida, H.Nakamura, CKiryu, S. A novel method for the preparation of
controlled-release theophylline capsules coated with a polyelectrolyte complex of carrageenan and chitosan. Chem. Pharm. Bull.1994; 42: 979-981
10. Tapia C; Escobar Z; Costa E; Sapag-Hagar J; Valenzuela F; Basualto C; Gai MN; Yazdani-Pedram, M Comparative studies on polyelectrolyte complexes and mixtures of chitosan-alginate and chitosan-carrageenan as prolonged diltiazem clorhydrate release systems Eur J Pharm Biopharm 2004; 57:65-75.
11. Ofoefule IS, Chukwu A, Anyakoha N, Ebebe IM. Application of
Abelmoschus esculentus in solid dosage formulation: Use as a binder in
a poorly water-soluble drug. Indian J Pharm Sci 2001; 63:234-8. 12. Tavakoli N, Ghasemi N,Taimouri R, Hamishekhar H. Evaluation of okra
gum as a binder in tablet dosage forms. Iranian J. Pharm. Res. 2004; 2:47.
13. Kumar R, Patil MB, Patil SR, Paschapu MS. Evaluation of disintegrating properties of Abelmoschus esculentus mucilage. Int J Pharm Tech Res 2009; 1:241-6.
14. Wahi SP, Sharma VD, Jain VK. Sinha P. Studies on suspending property of mucilages of Hygrophila spinosa T Anders and Hibiscus
esculentus Linn. Indian drugs 1985; 22(9):500-502.
15. Baveja SK, Ranga Rao KV, Arora Jagadish. Examination of natural gums and mucilages as sustaining materials in tablet dosage forms. Indian J Pharm. Sci.1988; 50(2):89-92.
16. Baveja SK, Ranga Rao KV, Arora Jagdish. Examination of natural gums and mucilages as sustaining materials in tablet dosage forms part II. Indian J Pharm Sci. 1989, 51(4):115-118.
17. Kalu VD, Odeniyi MA, Jaiyeoba KT. Matrix properties of a new plant gum in controlled drug delivery. Arch Pharm Res 2007; 30:884-9. 18. Ofoefule IS, Chukwu A. Application of Abelmoschus esculentus gum as
a mini-matrix for furosemide and diclofenac sodium tablet. Indian J Pharm Sci 2001; 63:532-5.
19. Tomoda Masashi, Shimada Kazuyo, Saito Yuko, Sugi Michiko. Plant mucilages. XXVI Isolation and structural features of mucilage. “Okra mucilage –F” from the immature fruits of Abelmoschus esculentus. Chem.Pharm.Bull.1980; 28(10): 2933-2940.
20. Whistler RL, Conrad HE. J.Am.Chem.Soc., 1954 ;76 :1673,3544. 21. Subrahmanyam C.V.S. Text Book of Physical Pharmaceutics, 2nd Edn,
Vallabh Prakashan,New Delhi, 2000: 226-228.
22. Martin A. (2001) ‘Micromeritics, In: Physical pharmacy’, Ed. 1st, MD: Lipponcott Williams &Wilkins, pp. 423-454.
23. Marshall K. In: Lachman L, Lieberman HA, Kanig JL, editors. The theory and practice of industrial pharmacy. 3 rd ed. Mumbai: Varghese Publishing House; 1991. p. 66-99.
24. Paulo C, Jose MS. Modeling and comparison of dissolution profiles. Eur J Pharm Sci 2001; 13:123-33.
25. Korsmeyer, R.W., Gurny, R., Doelker, E.M., Buri, P., Peppas, N.A., 1983.Mechanism of solute release from porous hydrophilic polymers. Int. J Pharm. 15, 25–35.
26. Langenbucher, F., 1972. Linearization of dissolution rate curves by the Weibull distribution. J. Pharm. Pharmacol. 24, 979–981.
27. Emami, J., Tavakoli, N., and Movahedian, A.Formulation of sustained – release lithium carbonate matrix tablets: influence of hydrophilic materials on the release rate and in vitro-in vivo evaluation. J. Pharm. Pharmaceut. Sci. 7 (3): 338-344, 2004.
28. Khan KA. The concept of dissolution efficiency. J Pharm Pharmacol.1975; 27:48Y49.
29. Moore JW, Flanner HH. Mathematical comparison of dissolution profiles. Pharm Tech 1996; 20:64-74
TABLE 1: PRE COMPRESSION AND POST COMPRESSION PARAMETERS OF DICLOFENAC SODIUM MATRIX TABLETS. Form.
Code
Angle Of Repose
% Friability
Carr’s Index Hausner Ratio % Drug Content Hardness Kg/m2
Weight mg F1 29.5835 0.5 0.4687±0.006 1.0631± 0.013 98.75±0.3568 5.525±0.05 254± 2 F2 28.9294 0.3174 0.4768±0.022 1.055933± 0.014 99.25±0.5008 5.85±0.057 260± 2.4 F3 29.2488 0.44 0.4804± 0.017 1.063967± 0.012 99.5± 0.4691 5.05±0.057 258± 1.6 OM 26.2939 0.158 0.447±50.01 1.066517±0.0014 99.78±0.9175 4.9±0.081 260± 2.6 CH 30.6128 0.3557 0.440933±0.005 1.065647±0.0002 98.9± 0.6111 4.6±0.081 258 ± 1.9 PM 29.2482 0.5976 0.454533±0.010 1.067823±0.0019 99.25±0.2351 4.875±0.095 259 ± 2.6
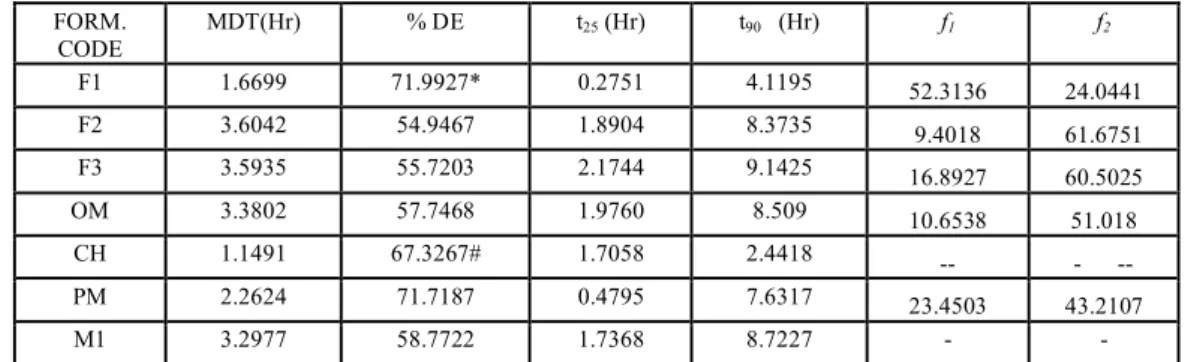
TABLE 2 A: KINETIC PARAMETERS FORM
CODE
ZERO ORDER FIRST ORDER HIGUCHI MODEL SLOPE INTERCEPT R2 SLOPE INTERCEPT R2 SLOPE INTERCEPT R2
F1 15.764 22.179 0.8259 -0.4309 2.2601 0.9182 43.186 2.3469 0.9791 F2 10.026 6.0464 0.9876 -0.096 2.0325 0.9623 36.251 -21.698 0.9762 F3 9.3282 4.7165 0.9905 -0.0769 2.0239 0.98 27.285 -7.8418 0.9518 OM 9.9491 5.3401 0.9821 -0.087 2.0277 0.9899 29.271 -8.32 0.9541 CH 33.193 9.453 0.9415 -0.6485 2.1898 0.9118 58.468 -1.3638 0.9944 PM 11.009 19.139 0.8992 -0.1886 2.0863 0.9418 34.514 0.5587 0.9919
TABLE 2 B: KINETIC PARAMETERS FORM
CODE
KORSMEYER PEPPAS WEIBULL HIXSON CROWELL SLOPE INTERCEPT R2 β LOG α R2 SLOPE INTERCEPT R2
TABLE 3: MODEL INDEPENDENT KINETIC PARAMETERS FORM.
CODE
MDT(Hr) % DE t25 (Hr) t90 (Hr) f1 f2
F1 1.6699 71.9927* 0.2751 4.1195 52.3136 24.0441 F2 3.6042 54.9467 1.8904 8.3735 9.4018 61.6751 F3 3.5935 55.7203 2.1744 9.1425 16.8927 60.5025 OM 3.3802 57.7468 1.9760 8.509 10.6538 51.018
CH 1.1491 67.3267# 1.7058 2.4418 -- - -- PM 2.2624 71.7187 0.4795 7.6317 23.4503 43.2107 M1 3.2977 58.7722 1.7368 8.7227 - -
*DE at 6 Hrs, #DE at 3 Hrs M1-marketed formulation
TABLE 4: RESULTS OF ONE WAY ANOVA FOLLOWED BY TUKEY METHOD AT LEVEL OF SIGNIFICANCE (P < 0.05) Pair S/NS
F1-OM S
F1-M1 S
OM-M1 S
F2-M1 NS
F3-M1 S
PM-M1 S
F1-F2 S
F3-OM S
Figure 1: Effect of pH and ratio between OM: CH on the yield of polyelectrolyte complex
Figure 3: Effect of conductivity on formation of polyelectrolyte complex
Figure 4: Effect of pH and ratio between OM: CH on relative viscosity of supernatant solutions.
Figure 5: FTIR Spectra of A) PEC 8:2, B) PEC 9:1, C) OM, D) Physical Mixture of OM-CH, E) CH, F) Formulation F3,
G) Pure Diclofenac sodium
Figure 7: DSC thermograms of Formulation A) Diclofenac sodium and B) Formulation F3.
Figure 8: Comparison of in vitro dissolution profile from formulations of diclofenac sodium matrix tablets
Figure 9: Zero order plots of formulations F1, F2 and F3
Figure 10:Zero order plots of formulations OM, CH and PM