*Correspondence: Mahmood Ahmad. Faculty of Pharmacy and Alternative Medicine, The Islamia University of Bahawalpur, Khawaja Fareed Campus, Railway Road, 63100- Bahawalpur, Pakistan. E-mail: [email protected]
A
r
vol. 50, n. 3, jul./sep., 2014 http://dx.doi.org/10.1590/S1984-82502014000300007
Formulation and
in vitro
evaluation of mucoadhesive controlled
release matrix tablets of flurbiprofen using response surface
methodology
Ikrima Khalid, Mahmood Ahmad
*, Muhammad Usman Minhas, Muhammad Sohail
Faculty of Pharmacy and Alternative Medicine, The Islamia University of Bahawalpur, Bahawalpur, Pakistan
The objective of the current study was to formulate mucoadhesive controlled release matrix tablets of
lurbiprofen and to optimize its drug release proile and bioadhesion using response surface methodology.
Tablets were prepared via a direct compression technique and evaluated for in vitro dissolution parameters
and bioadhesive strength. A central composite design for two factors at ive levels each was employed
for the study. Carbopol 934 and sodium carboxymethylcellulose were taken as independent variables. Fourier transform infrared (FTIR) spectroscopy studies were performed to observe the stability of the
drug during direct compression and to check for a drug–polymer interaction. Various kinetic models were applied to evaluate drug release from the polymers. Contour and response surface plots were
also drawn to portray the relationship between the independent and response variables. Mucoadhesive
tablets of lurbiprofen exhibited non-Fickian drug release kinetics extending towards zero-order, with some formulations (F3, F8, and F9) reaching super case II transport, as the value of the release rate exponent (n) varied between 0.584 and 1.104. Polynomial mathematical models, generated for various response variables, were found to be statistically signiicant (P<0.05). The study also helped to ind the drug’s optimum formulation with excellent bioadhesive strength. Suitable combinations of two polymers provided adequate release proile, while carbopol 934 produced more bioadhesion.
Uniterms: Flurbifrofen/mucoadhesive controlled release tablets/formulation. Flurbifrofen/mucoadhesive controlled release tablets/in vitro evaluation. Drugs/release proile. Drugs/bioadhesion. Tablets/direct
compression.
O objetivo do presente estudo foi formular comprimidos mucoadesivos de lurbiprofeno, de liberação controlada, e otimizar o peril da liberação do fármaco e a bioadesão, utilizando a metodologia de superfície de resposta. Prepararam-se os comprimidos via técnica de compressão direta, que foram avaliados in vitro quanto aos parâmetros de dissolução e da força bioadesiva. Planejamento com componente central para dois fatores em cinco níveis cada foi empregado para esse estudo. Carbopol 934 e carboximetilcelulose sódica foram tomados como variáveis independentes. Efetuaram-se estudos de espectroscopia por transformada de Fourier (FTIR) para observar a estabilidade do fármaco durante a compressão direta e para avaliar a interação a fármaco-polímero. Aplicaram-se vários métodos cinéticos para avaliar a liberação do fármaco dos polímeros. Gráicos de superfície de contorno e de resposta foram efetuados para retratar a relação entre as variáveis dependentes e a resposta. Os comprimidos mucoadesivos de lurbiprofeno apresentaram cinética de liberação não-ickiana, estendendo para ordem zero, para algumas formulações (F3, F8 e F9), alcançando transporte super caso II, à medida que o valor do expoente (n) de taxa de liberação variou entre 0,584 e 1,104. Modelos matemáticos polinomiais, gerados por diversas variáveis de resposta, foram estatisticamente, signiicativos (P<0,05). O estudo também auxiliou a encontrar a formulação ótima do fármaco, com excelente força de bioadesão. Combinações adequadas dos dois polímeros resultaram em peris de liberação adequado, sendo que o Carbopol 934 produziu mais adesão.
INTRODUCTION
Oral controlled release systems continue to be the
most popular of all the drug delivery systems available, despite the advancements made in other drug delivery systems (Ponchel, Irache, 1998). Conventional oral dosage forms often produce luctuations in drug plasma levels
that either exceed safe therapeutic levels or quickly fall below the minimum effective levels; this effect is usually
entirely dependent upon the particular agent’s biologic
half-life, frequency of administration, and its release rate (Theeuwes et al., 1983).
Mucoadhesive delivery systems offer many
advantages over other oral controlled release systems; they prolong the residence time of the drug in the gastrointestinal tract and they target and localize the dosage form at a speciic site (Lavelle, 2001; Hou, Cowles, Berner, 2003).
Mucoadhesive formulations are known to provide close
contact between the dosage form and the mucus membrane, resulting in high drug flux through the absorbing tissue (Woodley, 2001; Singh, Chakkal, Ahuja, 2006).
Inflammatory processes cause many oral cavity
diseases, which can be treated with lurbiprofen, a potent anti-inflammatory, analgesic, and antipyretic agent belonging to the family of propionates. Its shorter half-life (2–6 hours) limits its extensive use when compared to many of the newer agents, possibly because it requires
around-the-clock administration and has harmful
gastric side effects (Dollery, 1991). Flurbiprofen, when
administered as conventional tablets, has been reported to
exhibit luctuations in plasma drug levels, which can result
in either the manifestation of side effects or in the reduction
of drug levels at the receptor site (Vaithiyalingam et al.,
2001). Thus, a mucoadhesive controlled release tablet of lurbiprofen, which maintains plasma concentrations effectively over a 24-hour period, and which has the ability to avoid gastric-related adverse effects will heighten its
area of application.
In the development of the mucoadhesive controlled
release dosage form, an important issue to address was to design an optimized formulation using a minimum
number of experiments within a short amount of time.
For this reason, a computer optimization technique, based on response surface methodology (RSM) utilizing a polynomial equation has been widely used. RSM is
a collection of statistical and mathematical techniques that has been successfully used to determine the
effects of several variables while optimizing processes (Atkinson,Donev, 1992). RSM is an extensively practiced approach in the development and optimization of drug
delivery devices (Dave et al., 2004; Singh et al., 2005a;
Singh et al., 2005b). The technique requires minimal
experimentation and time, thus proving to be less laborious and time-consuming, but it is also more cost-effective than other approaches that are required for the optimization of a process. The different types of RSM designs available may include central composite design (CCD), three-level factorial design, Box–Behnken design, and D-optimal design (Box, Wilson, 1951). In the present study, CCD is employed to it a second-order polynomial by a least
squares technique. An equation is also used to describe how the test variables affect the response and determine
the interrelationship among the variables.
The aim of this study was to develop and optimize
an oral mucoadhesive controlled release tablet of
flurbiprofen using RSM, as it may prove to be more
fruitful than the conventional controlled release systems
by virtue of prolongation of the drug residence time in the gastrointestinal tract. The computer-aided optimization technique using a CCD was employed to study the effect
of two independent variables (factors) (i.e., the amounts
of two mucoadhesive swellable polymers) on drug release proiles and bioadhesive strength.
MATERIALS AND METHODS
Materials
The materials used in the study include lurbiprofen, which was donated by Hamaz Pharmaceuticals (Pvt.) Ltd. Multan, Pakistan. High-viscosity grade carbopol 934 (CP) and sodium carboxymethylcellulose (SCMC) were donated by Friends Pharmaceuticals (Pvt.) Ltd., Lahore, Pakistan. Gastric mucosa of rabbit was obtained from the rabbit at the university animal house. Analytical grade potassium dihydrogen phosphate, sodium hydroxide, magnesium stearate, lactose, and other chemicals were purchased from E. Merck Co, Darmstadt, Germany.
Formulation of mucoadhesive compressed matrix tablets
Table I shows varying amounts of polymers (i.e., CP and SCMC), along with the diluents (lactose) and calculated amount of lubricant (1% w/w magnesium stearate). The drug and all of the excipients, except for the lubricant, were homogeneously blended in a plastic bag for 15 minutes, followed by further blending of 5
minutes after the addition of the lubricant. The blend was
then directly compressed into lat-faced tablets (500 mg) at a constant compression load using a single-punch tablet
Experimental design
A CCD with α = 1.414 was employed as per the standard protocol (Shah et al., 2009; Singh et al., 2005c).
The amounts of CP (X1) and SCMC (X2) were selected as
the factors, which were studied at ive levels each. The
central point (0,0) was studied in quintuplicate. All other
formulation and processing variables were kept invariant throughout the study. Tables II and III summarize an
account of the 13 experimental runs studied, their factor combinations, and their translation of coded levels to
the experimental units employed during the study. The
percent release at 4 hours (rel4h), the percent release at 12 hours (rel12h), and bioadhesive strength f were taken as the response variables.
Evaluation of tablets
Physical evaluation of tablets
Tablets were evaluated for weight variation (n=20),
hardness (n=10), thickness (n=10), and friability (n=10).
Fourier transform infrared spectroscopy
Fourier transform infrared (FTIR) spectroscopy
using attenuated total relectance (ATR) technology for active drug, tablet before, and tablet after compression were taken using Bruker FTIR (Tensor 27 series; Bruker Corporation, Billerica, USA), and OPUS data collection
software (Bruker Corporation) was used to evaluate
the interaction between the drug and the polymers in the matrix tablets before and after compression. Small
amounts of powdered samples were directly placed onto the pike miracle ATR cell in such a way that the sample
covered the ZnSe crystal surface, and the arm of the
assembly was rotated so that a compact sample mass was
formed onto the cell and scanned over a range of 4000 cm–1
to 400 cm–1. Before taking the spectrum of any sample, a
blank background scan was performed with an empty cell
plate. The procedure described above was then repeated
after placing the sample to be analyzed onto the pike
miracle ATR cell.
In vitro drug release studies
Automatic USP dissolution apparatus-II (paddle
method), attached with an auto-sampler (Watson
Marlo, Stockholm, Sweden) was used to determine the drug release profile of all mucoadhesive matrix tablets in triplicate. Six tablets from each formulation
were subjected to dissolution studies. Phosphate buffer
maintained at a pH of 6.8 in a volume of 900 mL was
selected as the dissolution medium and maintained at 37 °C (±0.5 °C). The paddle was rotated with a rotation
speed of 50 rpm. Then, 10 μm sintered ilters (Pharma Test, Hainburg, Germany) were used to ilter aliquots of about 5 mL, withdrawn at 0, 0.5, 1.0, 1.5, 2.0, 4.0, 8.0, 12.0, 16.0, 20.0, and 24.0 hours via auto-sampler. Collected samples were analyzed at 247 nm using a spectrophotometer, and drug release profiles were evaluated by drawing them
in Microsoft Excel software (Microsoft Corporation,
Redmond, WA, USA).
Measurement of ex vivo bioadhesive strength
Bioadhesive strength of mucoadhesive tablets, measured as the force of detachment against rabbit gastric mucosa, was determined using a modiication of the weighing assembly. The rabbit’s mucosal membrane was made clear from underlying connective and adipose
tissue and then excised and equilibrated at 37 °C±1 °C in phosphate buffer for 30 minutes. Mucoadhesive tablets
from each batch, under a constant weight of 5 g, were
then placed onto the mucosal membrane for 1 minute. The force required to detach the mucoadhesive tablet from the
mucosa was regarded as the bioadhesive strength, and it was measured in terms of weight in grams.
Release modeling
Drug release kinetics are assumed to reflect the
different release mechanisms of controlled release matrix
TABLE I - Composition of different ingredients used per tablet
Ingredients Amounts (mg)
Flurbiprofen 200
Carbopol 934 34.47–140.53
Sodium carboxymethylcellulose 34.47–140.53
Magnesium stearate 5.0
Lactose (q.s) 500
TABLE II - Detail of coded levels in actual units for the selected variables at ive levels
Coded level –2 –1 0 1 2
X1: carbopol 934 (mg) 34.47 50.00 87.50 125.00 140.53
systems. Therefore, four kinetic models were applied
to analyze the drug release data to find the best fitting equation (Philip, Pathak, 2006). These models are zero-order, first-zero-order, Higuchi, and Korsmeyer-Peppas, as given in Equations 1-4:
Qt = k0 t (1)
logQt = log Q0 k1t (2)
Qt = kH t1/2 (3)
=k M
M KP
t
∞
tn (4)
where: Qt is the amount of drug released at time t; Q0 is
the initial amount of the drug in the formulation, k0, k1, kH, and kKP are the release rate constants for zero-order,
irst-order, Higuchi model, and Korsmeyer–Peppas models,
respectively. In Equation 4, Mt and M∞ are the amount of drug released at time t and ∞, while n is the diffusion
coeficient.
Optimization of statistical data analysis
Multiple linear regression analysis (MLRA) was performed using Design Expert software® (Design Expert trial version 7.0.0; Stat-Ease, Inc., Minneapolis, MN, USA). A second-order polynomial model was then constructed using the results, including interaction and quadratic terms, along with linear terms. In general, the
MLRA model can be represented as follows:
Y = β0 + β1X1 + β2X2 + β11X12 + β22X22 + β12X1X2 (5)
where: Y is the selected response; β0 is the intercept
representing the arithmetic mean of all experimental runs
performed; β1 and β2 are the coeficients of the linear terms;
β11 and β22 are the coeficients of the quadratic terms; β12 is
the coeficient of the interaction terms calculated by the
observed experimental response values of Y, X1 and X2 are the coded levels of independent variables; X12 and X22 are
the quadratic terms, and X1X2 is the interaction term.
Design expert software was also used to evaluate
statistical validity of the constructed polynomial models by
performing one-way analysis of variance (ANOVA).
Two-dimensional contour and three-Two-dimensional surface plots
were also drawn for each response variable, depending on
the respective polynomial model. These plots served as a
very good tool for analyzing the interaction effects of the studied dependent variables (Shah et al., 2009; Mandal et al., 2007).
RESULTS AND DISCUSSION
Physical evaluation of tablets
The results for the physical evaluation of the tablets showed that all batches of tablets were within the limits
of the United States Pharmacopeia. Tablet weights varied between 498.52 mg and 501.79 mg (mean: 500.43 mg), hardness between 12.39 kg cm–2 and 19.1 kg cm−2 (mean: 14.34 kg cm−2), thickness between 4.37 mm and 4.63 mm (mean: 4.56 mm), and friability ranged between 0.22%
and 0.64% (mean: 0.46%).
Fourier transform infrared spectroscopy
FTIR spectra of pure flurbiprofen (Figure 1) and
mucoadhesive controlled release powder mixture before
compression (Figure 2) and after compression (Figure 3) did not show any change in the identiied peaks. The main peak of the drug remained unaffected after compression, which indicates the stability of drug. Therefore, it was
concluded that applied compression force has no effect on
drug stability, and no polymer interaction and deformation was observed during the entire course of tablet preparation.
FTIR spectra of flurbiprofen showed characteristic
broad peaks of the drug in the range of 3500 cm−1 to 2500 cm−1 because of hydrogen bonding. Conversely, the characteristic peaks of the drug at 1697 cm−1 and 2935 cm−1 were indicative of carbonyl and hydroxyl
TABLE III - Different combination of factors for the experimental design selected
Trial no. Trial code Coded factor levels
X1 X2
I. F1 –2 0
II. F2 –1 –1
III. F3 –1 1
IV. F4 0 –2
V. F5 0 0
VI. F6 0 2
VII. F7 1 –1
VIII. F8 1 1
IX. F9 2 0
X. F10 0 0
XI. F11 0 0
XII. F12 0 0
FIGURE 1 - FTIR spectrum of lurbiprofen.
FIGURE 2 - FTIR spectrum of the tablet mixture (F9) containing lurbiprofen before compression.
stretching, respectively. These FTIR studies are found to be in line with previous studies, suggesting that there was drug stability during the direct compression technique (Shah et al., 2009).
In vitro drug release studies
Table IV lists various kinetic models computed for
all the controlled release mucoadhesive formulations.
Flurbiprofen release data was evaluated by zero-order, irst-order, and Higuchi models. It is depicted in the tables that some formulations follow zero-order patterns for the release of the drug, with an observed general trend of more linearity in the regression line for formulations that
have almost double the concentration of either polymer, such as F3, F6, F7, and F9. Most of the formulations
follow irst-order release patterns because the plots of the percent cumulative drug release versus the square root of time were found to be linear, with regression coeficient
(R2) values ranging from 0.9289 to 0.9864 for the nine formulations. Hence, the mechanism of drug release from
the matrices was found to be diffusion-controlled. The
Higuchi model failed to explain the release mechanism
because the dissolution of the controlled release matrix tablets followed the anomalous release behavior (a
combination of diffusion and erosion). Hence, the release data were subjected to the Korsmeyer–Peppas equation,
which is used to describe anomalous release behavior from the matrix tablets. In the present study, the values
of n, calculated per the algorithm proposed by Peppas
and Sahlin (1989), ranged between 0.5840 and 1.1040. Generally, the release pattern was found to be non-Fickian, as it tended to approach zero-order, while some
formulations reached super case II transport, especially
when high levels of both polymers were combined. The
values of the kinetic constant (kkp), which is a direct function of matrix solubility, were found to decline with increases in the amount of either polymer (Korsmeyer et al., 1983; Korsmeyer et al., 1983a). It should be noted that k1 has much lower values when compared to k0, clearly
indicating that the release of the drug was primarily controlled by Fickian diffusion, along with the varying
contribution of the polymer relaxation (case II transport)
mechanism as well. It was observed that swelling and erosion (case II transport) of the tablets go on to increase
in association with an increase in the content of any of the polymers.
Table V and Figure 4 show that the values of the drug released at 4 hours (rel4hrs) decreased noticeably from
48.786%, which was observed at low levels of both of the
polymers, to as low as 10.032%, which was observed at high levels of both of the polymers. This inding indicated the substantial release-retarding potential of the polymers for flurbiprofen. The initial burst release of the drug
was shown by the formulations with lower amounts of
polymers, which is due to the dissolution of the drug that
is initially present at the surface of the matrices, and due to
the presence of higher amounts of unreleased drug present in the specific dosage form (Suryakanta et al., 2011).
Another reason for the initial burst release of the drug
TABLE IV - Dissolution data modeling showing the release kinetics of lurbiprofen controlled release matrix tablets containing
CP and SCMC
Formulation code Zero order 1st order Higuchi Korsmeyer–Peppas
R2 R2 R2 N
F1 0.8391 0.9861 0.9391 0.610
F2 0.8135 0.9864 0.9457 0.584
F3 0.9732 0.9348 0.8557 0.920
F4 0.8095 0.9755 0.9205 0.601
F5 0.9678 0.9671 0.9147 0.788
F6 0.9698 0.9753 0.8926 0.830
F7 0.9733 0.9795 0.9262 0.778
F8 0.9869 0.9289 0.8193 1.104
F9 0.9890 0.9319 0.8490 0.991
F10 0.9664 0.9639 0.9146 0.786
F11 0.9683 0.9662 0.9121 0.794
F12 0.9639 0.9673 0.9193 0.774
is that the dosage forms, in the early dissolution period, primarily exhibit irst-order Fickian diffusion mechanisms. Higher amounts of the drug released due to Fickian
diffusion (i.e., due to k1), as compared to that released due to polymer relaxation (i.e., due to k2), in the early time periods could also be a cause of initial burst release.
The cumulative proportion of the drug released due to
the case II relaxational transport constant (k2) increased
for all of the formulations in association with increasing dissolution time periods, indicating that the release was signiicantly inluenced by polymer relaxation in the later stages. However, formulations showed little burst effect at higher polymer levels, ratifying better sustenance of drug release (Singh, Chakkal, Ahuja, 2006).
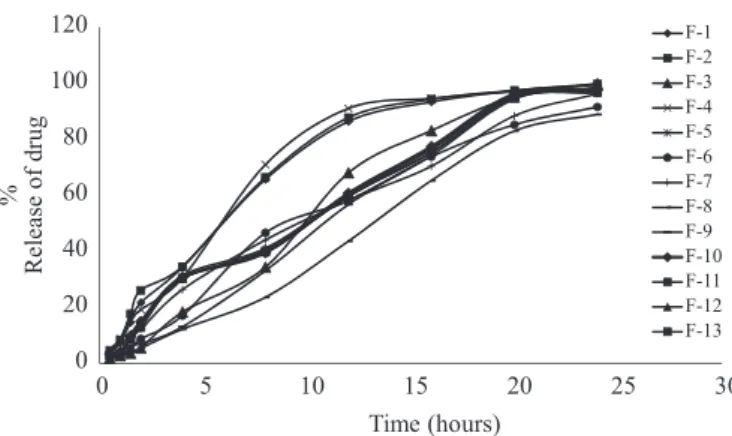
Almost 88.912%-99.894% of flurbiprofen is
released from all 13 formulations at 24-hour time intervals, which signiies almost complete drug release from all of the formulations. Hence, the overall rate of the drug release data (until 12 hours) was determined (as shown in Table V and Figure 4) via observation based on indiscriminating drug release for all of the formulations until a period of 24 hours. The rate of the drug release (until 12 hours) tended to decrease with increase amounts of either CP or SCMC. According to literature indings, the slowing effect of both polymers is due to increases in the viscosity of the gel layer around the matrix tablet (Ford, Rubinstein, Hogan, 1985; Vazques et al., 1992). Both polymers have a tendency of
forming gel when they come into contact with water. So, at high levels, hydrogel concentrations are increased around the tablet, and so is the viscosity of the gel layer, which results in decreases in the effective diffusion coeficient of the drug, which then consequently limits the release of the drug from the matrix (Skoug et al., 1993). Gel formation
occurs due to dissociation of the carboxyl groups of CP at a pH above their pKa (i.e., 6.0±0.5), which causes uncoiling
and the expansion of molecules due to the production of
an electrostatic repulsive force between the negatively charged carboxyl groups. Uncoiling and expansion of the molecules result in polymer swelling and, consequently, gel is formed, which consists of closely packed swollen
particles. With increases in the amount of polymer, this
gelling property increases, and thicker gel restrains water
penetration, which ultimately reduces the release of the
drug (Singh, Chakkal, Ahuja, 2006; Suryakanta et al.,
2011). At high levels of both polymers, a considerable fraction of the drug (~44%) remained unreleased until 12
TABLE V - Formulations according to the central composite design with observed responses
Trial code Coded Factor levels Y1 (percent release
at 4 hours)
Y2 (percent release
at 12 hours)
Y3 (Bioadhesive
strength in g)
X1 X2
F1 –2 0 44.245 86.378 15
F2 –1 –1 48.786 87.751 12
F3 –1 1 18.796 68.004 28
F4 0 –2 48.363 91.024 14
F5 0 0 26.610 59.662 23
F6 0 2 22.914 58.184 31
F7 1 –1 25.871 58.184 33
F8 1 1 10.032 43.611 38
F9 2 0 14.044 56.705 38
F10 0 0 27.666 60.718 23
F11 0 0 26.082 59.873 21
F12 0 0 27.138 60.296 22
F13 0 0 25.871 59.556 23
FIGURE 4 - In vitro drug release proile of lurbiprofen from
directly compressed mucoadhesive tablets containing CP and SCMC.
0 20 40 60 80 100 120
0 5 10 15 20 25 30
%
R
el
ea
se
o
f
d
rug
Time (hours)
hours, which can eventually lead to signiicant reductions
in the extent of bioavailability.
Measurement of ex vivo bioadhesive strength
Bioadhesive strengths of all 13 formulations are presented in Figure 5, which depicts a great variation among the bioadhesive strengths of the formulation. A general trend of increasing bioadhesive strength was observed with increases in either of the polymer’s contents, and maximum strength (f) was seen with the highest levels of the two
polymers. Formulations showed signiicant differences in bioadhesive strength and decreases in the order of F9> F8> F7> F6> F3> F5> F1> F4> F2 from 38 g to 12 g. This is in agreement with literature indings that both polymers have
a tendency to swell immediately when they come in direct
contact with the hydrated mucus membrane (Peppas, Sahlin, 1996). Uncoiling of polymer chains occurs as a result of water sorption, which is responsible for reductions in glass
transition temperatures below room conditions. These uncoiled chains eventually result in subsequent increases in
chain mobility. The reduced glass-rubbery transition makes polymers plasticized, which increases the polymer surface
area for maximum contact with the mucus membrane and
it also increases chain lexibility for interpenetration into
the mucus membrane (Duchen, Touchar, Peppas, 1988) There is no citation in the reference part! Please, white it. Therefore, an increase in the amount of polymer results in
the provision of a greater surface area and more polymer chains for interpenetration with mucin, resulting in the augmentation of bioadhesive strength (Ponchel et al., 1987).
RSM optimization results
CCD, with two factors at ive levels, was selected for the study with 13 experimental runs. Table V consists
of responses of selected independent variables (X1 and
X2) in terms of the percent release at 4 hours (Y1), the
percent release at 12 hours (Y2), and force of detachment
or bioadhesive strength (Y3) required for the detachment
of the tablet from the mucus membrane.
Mathematical modeling
Design Expert software (version 7.0.0) was used
to establish mathematical relationships in the form
of polynomial equations using MLRA for the studied
response variables, as expressed in Equations 6, 7, and 8.
Y1 = 30.54 – 6.07X1 - 6.67X2 –3.41X12 – 3.39X22 +
1.54X1X2 (6)
Y2 = 60.02 – 11.99X1 – 10.10X2 + 3.59X12 + 5.12X 2
2 +
1.29X1X2 (7)
Y3 = 22.20 + 7.94X1 + 5.63X2 + 2.96X12 + 0.96X22 –
2.75X1X2 (8)
Polynomial equations consist of coeficients for the intercept, irst-order main effects, interaction terms, and higher-order effects. The relative inluence of each factor on overall response can be signified from the sign and magnitude of the main effects, where a positive sign would be considered to have a synergistic (positive) effect, while a negative sign would indicate an antagonistic (negative) effect. Design Expert software was also used to evaluate
the statistical validity of the constructed polynomial
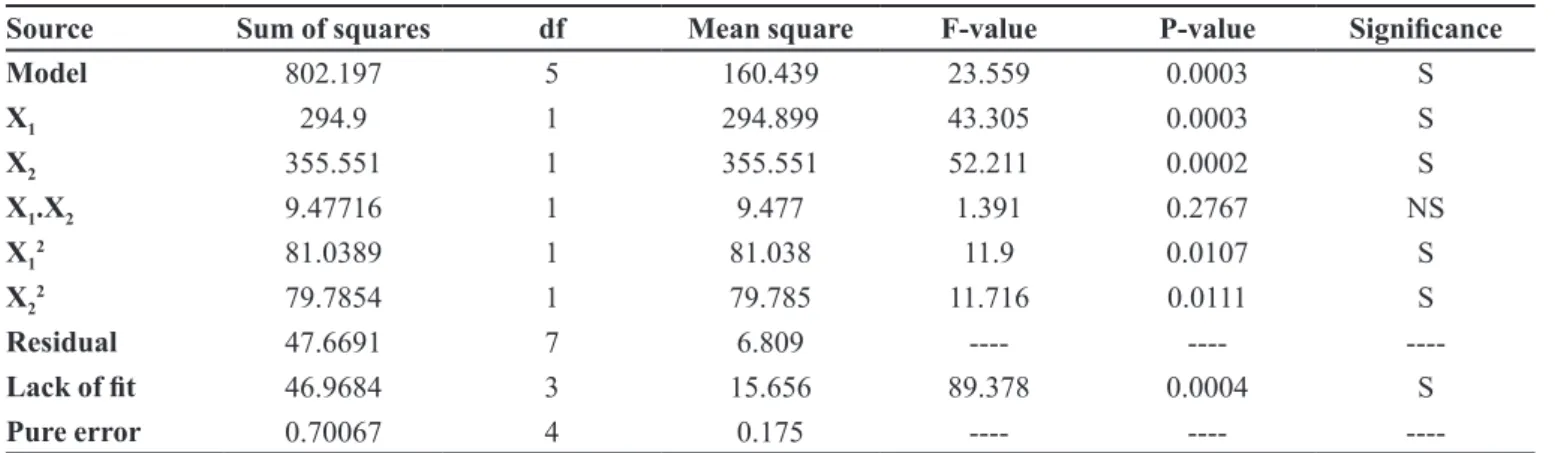
equations by performing one-way analysis of variance (ANOVA), as shown in Tables VI, VII, and VIII for Y1,
Y2,and Y3, respectively. Using a 1.414% significance
level, a model is considered significant if the P-value (signiicance probability value) is less than 0.05 (Shah et al., 2009; Vijayalakshmi et al., 2008). The slowing effect
of both independent variables X1 (CP) and X2 (SCMC) is
depicted in Equation 6, which shows that both polymers
have a negative effect on Y1, with a slightly more negative
effect in the case of SCMC, conirming its release rate slowing ability. In Table VI, the value of P is less than
0.05 for linear contributions of X1 (CP) and X2 (SCMC);
therefore, they are considered to have signiicant effects on the release of the drug from the controlled release
matrix tablets after 4 hours. The quadratic response of CP (X12) and SCMC (X
2
2), being signiicant, also has a more pronounced slowing effect on the release of the drug.
Polynomial Equation 7 shows the negative effect of both polymers at a 12-hour time interval. It is quite evident from Equation 7 that the slowing effect of the
polymers is increased, and that CP has a comparatively
0 5 10 15 20 25 30 35 40
F1 F2 F3 F4 F5 F6 F7 F8 F9 F10 F11 F12 F13
Force of
detachm
ent
f
(g)
Formulation codes
FIGURE 5 - Graphical representation of bioadhesive strengths
greater negative inluence, showing more release-retarding ability of CP at 12 hours. Linear responses X1 (CP) and X2
(SCMC), in the case of Y2, have P-values of 0.0003 and
0.0009, respectively; therefore, they are also considered
signiicant, but the quadratic response (X12) with a P-value of 0.1107 is not signiicant, which is represented in Table VII. The cross-product contribution (X1X2) for both of
these response variables (Y1 and Y2) are not signiicant as
P-values, for these are greater than 0.05.
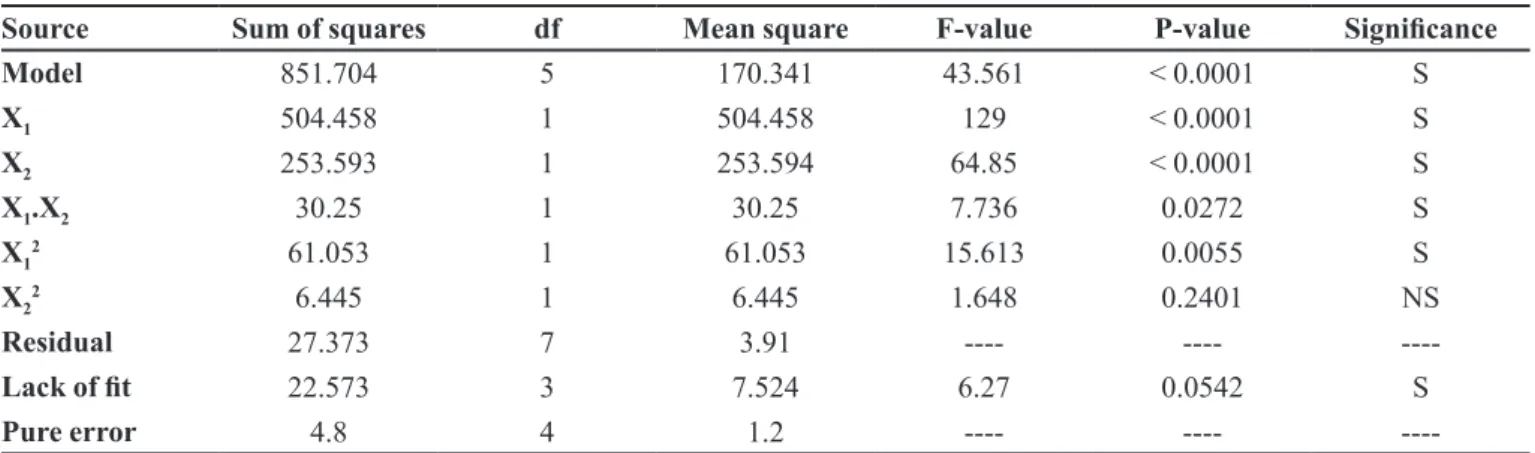
Both linear terms, X1 (CP) and X2 (SCMC), are very
influential as far as bioadhesive strength is concerned (as depicted in Equation 8 and Table VIII). Polynomial Equation 8 shows a more positive effect of CP, conirming
the more mucoadhesive property of CP, as compared to
SCMC. The P-value, being less than 0.05 for these linear terms, is considered significant. Polynomial Equation 8 also shows the signiicance of the combined polymer
effect on bioadhesion. The P-value for the cross-product contribution (X1X2) is 0.0272, which confirms the
signiicance of the combined effect of both polymers on
bioadhesion.
Response surface analysis
The response surface plot (Figure 6) and contour plot (Figure 7) show a steady-state decline in the value
of release at 4 hours (rel4hrs), as the concentration of
either polymer increases (i.e., CP and SCMC). However, the slowing influence of SCMC is somewhat more
pronounced when compared to CP. The enhanced
release-slowing ability of SCMC was also observed by Singh et al. (2006) and Varshosaz et al. (2006). Similarly, a decline
in the release of the drug reaches its maximum when the highest levels of both polymers are used (i.e., 125 mg for
each polymer).
Figures 8 and 9 also depict linear trends in the release patterns of the drug, but in a descending order. The release rate of the drug decreases to a great extent with increasing amounts of polymers. At lower levels of both polymers, about 80% of the drug is released within 12 hours, but as the level of the polymers increases, a gradual decline is observed in the release of the drug, and only 55% of the drug is released. By keeping SCMC concentrations TABLE VI - Analysis of variance for Y1
Source Sum of squares df Mean square F-value P-value Signiicance
Model 802.197 5 160.439 23.559 0.0003 S
X1 294.9 1 294.899 43.305 0.0003 S
X2 355.551 1 355.551 52.211 0.0002 S
X1.X2 9.47716 1 9.477 1.391 0.2767 NS
X12 81.0389 1 81.038 11.9 0.0107 S
X22 79.7854 1 79.785 11.716 0.0111 S
Residual 47.6691 7 6.809 ---- ----
----Lack of it 46.9684 3 15.656 89.378 0.0004 S
Pure error 0.70067 4 0.175 ---- ----
----TABLE VII - Analysis of variance for Y2
Source Sum of squares df Mean square F-value P-value Signiicance
Model 2214.89 5 442.978 16.48 0.0009 S
X1 1150.18 1 1150.175 42.791 0.0003 S
X2 815.328 1 815.328 30.333 0.0009 S
X1.X2 6.692 1 6.692 0.248 0.6331 NS
X12 89.573 1 89.573 3.332 0.1107 NS
X22 182.331 1 182.331 6.783 0.0352 S
Residual 188.149 7 26.878 ---- ----
----Lack of it 187.225 3 62.408 270.12 < 0.0001 S
----at a lower level and increasing the concentr----ation of CP, a decline in the release of the drug can be conirmed.
The response surface plot and contour plot also
explain the effect of polymers on the bioadhesive strength
f of the matrix tablet. Figures 10 and 11 portray the linear
fashion of the bioadhesive strength f in an ascending order
with increasing amounts of polymers. However, the more
pronounced effect of CP is observed when compared to
SCMC, which is also observed in previous studies by Singh et al. (2006) and Suryakanta et al. (2011).
TABLE VIII - Analysis of variance for Y3
Source Sum of squares df Mean square F-value P-value Signiicance
Model 851.704 5 170.341 43.561 < 0.0001 S
X1 504.458 1 504.458 129 < 0.0001 S
X2 253.593 1 253.594 64.85 < 0.0001 S
X1.X2 30.25 1 30.25 7.736 0.0272 S
X12 61.053 1 61.053 15.613 0.0055 S
X22 6.445 1 6.445 1.648 0.2401 NS
Residual 27.373 7 3.91 ---- ----
----Lack of it 22.573 3 7.524 6.27 0.0542 S
Pure error 4.8 4 1.2 ---- ----
----FIGURE 6 - Response surface plot showing the inluence of
CP and SCMC on the rel4hrs value of mucoadhesive tablet
formulations of lurbiprofen.
FIGURE 7 - Contour diagram showing the inluence of CP and
SCMC on the rel4hrs value of mucoadhesive tablet formulations
of lurbiprofen.
FIGURE 8 - Response surface plots showing the influence
of CP and SCMC on the rel12hrs value of mucoadhesive tablet
formulations of lurbiprofen.
FIGURE 9 - Contour diagram showing the inluence of CP and
SCMC on the rel12hrs value of mucoadhesive tablet formulations
FIGURE 10 - Response surface plot showing the influence
of CP and SCMC on the value of bioadhesive strength (f) of mucoadhesive tablet formulations of lurbiprofen.
FIGURE 11 - Contour diagrams showing the inluence of CP and
SCMC on the value of bioadhesive strength of mucoadhesive tablet formulations of lurbiprofen.
CONCLUSION
Kinetic modeling showed that best fit model was the Korsmeyer–Peppas model, with non-Fickian diffusion tending towards zero-order release, indicating
that the tablets can be successfully employed as a once
daily, oral, controlled-release drug delivery system. The high bioadhesive strength of the tablets increases its gastrointestinal residence time and eventually improves the extent of bioavailability. However, proper balancing
between the different levels of both polymers is necessary to attain proper bioadhesion, and the presence of CP is necessary for increased bioadhesion. FTIR studies of a selected formulation (F9) showed no combined effect
by changing the peak symmetry and position. Therefore,
it can be concluded that there is no interaction between
the drug and formulation variables. A high degree of prediction obtained using RSM corroborates that a
two-factor CCD is quite eficient in optimizing drug delivery
systems that exhibit non-linearity in response(s).
REFERENCES
ATKINSON, A.C.; DONEV, A.N. Optimum experimental
designs. Oxford: Oxford University Press, 1992. p. 132–
189.
BOX, G.E.P.; WILSON, K.B. On the experimental attainment of multifactorial conditions. J. Roy. Statist. Soc., v.13, p.1-45, 1951.
DAVE, B.S.; AMIN, A.F.; PATEL, M.M. Gastroretentive drug delivery system of ranitidine hydrochloride: formulation and in vitro evaluation. AAPS PharmSciTech., v.5, p.e34, 2004.
DOLLERY, C. (Ed.). Therapeutic drugs. New York: Churchill Livingstone, 1991. p.297-299.
DUCHEN, D.; TOUCHAR, F.; PEPPAS, N.A. Pharmaceutical and medicinal aspects of bioadhesive systems for drug administration. Drug Dev. Ind. Pharm., v.14, p.283-318,
1988.
FORD, J.L.; RUBINSTEIN, M.H.; HOGAN, J.E. Formulation of sustained release promethazine hydrochloride tablets using hydroxypropyl methyl cellulose matrices. Int. J. Pharm., v.24, p.327-338, 1985.
HOU, S.Y.; COWLES, V.E.; BERNER, B. Gastric retentive dosage forms: a review. Crit. Rev. Ther. Drug Carrier. Syst.,
v.20, p.459-497, 2003.
KORSMEYER, R.W.; GURNEY, R.; DOELKER, E.; BURI, P.; PEPPAS, N.A. Mechanisms of solute release from porous hydrophilic polymers. Int. J. Pharm., v.15, p.25-35, 1983.
KORSMEYER, R.W.; GURNY, R.; DOELKER, E.; BURI, P.; PEPPAS, N.A. Mechanisms of potassium chloride release from compressed, hydrophilic polymeric matrices: effect of entrapped air. J. Pharm. Sci., v.72, p.1189-1191, 1983a.
MANDAL, U.; GOWDA, V.; GHOSH, A.; SELVAN, S.; SOLOMAN, S.; PAL, T.K. Formulation and optimization of sustained release matrix tablet of metformin HCl 500 mg using response surface methodology. Yakugaku. Zasshi.,
v.127, p.1281-1290, 2007.
PEPPAS, N.A.; SAHLIN, J.J. A simple equation for the description of solute release. III. Coupling of diffusion and relaxation. Int. J. Pharm., v.57, p.169-172, 1989.
PEPPAS, N.A.; SAHLIN, J.J. Hydrogels as mucoadhesive and bioadhesive materials: a review. Biomaterials, v.17, p.1553-1561, 1996.
PHILIP, A.K.; PATHAK, K. Osmotic low through asymmetric membrane: A mean for controlled delivery of drugs with varying solubility. AAPS PharmSciTech., v.7, p.E1-E11, 2006.
PONCHEL, G.; TOUCHARD, F.; DUCHENE, D.; PEPPAS, N.A. Bioadhesive analysis of controlled release systems. I. Fracture and interpenetration analysis in poly (acrylic acid) containing systems. J. Control. Release, v.5,
p.129-141, 1987.
PONCHEL, G.; IRACHE, J.M. Specific and non-specific bioadhesive particulate systems for oral delivery to the gastrointestinal tract. Adv. Drug. Deliv. Rev., v.34, p.191-219, 1998.
SHAH, S.N.H.; ASGHAR, S.; CHAUDHARY, M.A.; AKASH, M.S.; REHMAN, N.; BAKSH, S. Formulation and evaluation of natural gum-based sustained release matrix tablets of lurbiprofen using response surface methodology.
Drug. Dev. Ind. Pharm., v.35, p.1470-1478, 2009.
SINGH, B.; MEHTA, G.; KUMAR, R.; BHATIA, A.; AHUJA, N.; KATARE, O.P. Design, development and optimization of nimesulide-loaded liposomal systems for topical application. Curr. Drug Deliv., v.2, p.143-153, 2005c.
SINGH, B.; CHAKKAL, S.K.; AHUJA, N. Formulation and optimization of controlled release mucoadhesive tablets
of atenolol using response surface methodology. AAPS
PharmSciTech., v.7, p.e3, 2006.
SINGH, B.; KUMAR, R.; AHUJA, N. Optimizing drug delivery systems using systematic “design of experiments”. Part I: Fundamental aspects. Crit. Rev. Ther. Drug Carrier. Syst.,
v.22, p.27-105, 2005a.
SINGH, B.; DAHIYA, M.; SAHARAN, V.; AHUJA, N. Optimizing drug delivery systems using systematic “design of experiments”. Part II: Retrospect and prospects. Crit. Rev. Ther Drug Carrier. Syst., v.22, p.215-294, 2005b.
SKOUG, J.W.; MIKELSONS, M.V.; VIGNERON, C.N.; STEMM, N.L. Qualitative evaluation of the mechanism of release of matrix sustained release dosage forms by measurement of polymer release. J. Control. Release, v.27,
p.227-245, 1993.
SURYAKANTA, S.; DINDA, S.C.; SARWAR, B.; SRUTI, J.; VIKAS, S.; BHANOJI, R. Design and characterization of oral sustained release mucoadhesive matrix tablets of didanosine. Asian J. Pharm. Sci. Res., v.1, p.38-60, 2011.
THEEUWES, F. OROS Osmotic system development. Drug.
Dev. Ind. Pharm., v.7, p.1331-1357, 1983.
VAITHIYALINGAM, S.R.; SASTRY, S.V.; DEHON, R.H.; REDDY, I.K.; KHAN, M.A. Long-term stability characterization of a controlled release gastrointestinal therapeutic system coated with cellulose acetate pseudolatex. Pharmazie, v.56, p.66-69, 2001.
VARSHOSAZ, J.; TAVAKOLI, N.; KHEIROLAHI, F. Use of hydrophilic natural gums in formulation of
sustained-release matrix tablets of tramadol hydrochloride. AAPS
PharmSciTech., v.7, p.e24, 2006.
VAZQUES, M.J.; PEREZ, M.B.; GOMEZ, J.L.; MARTINEZ, P.R.; SOUTO, C.; CONCHEIRO, A. Influence of technological variables on release of drugs from hydrophilic matrices. Drug Dev. Ind. Pharm., v.18, p.1355-1375, 1992.
VIJAYALAKSHMI, P.; DEVI, V.K.; NARENDRA, C.; SRINAGESH, S. Development of extended zero-order release gliclazide tablets by central composite design. Drug Dev. Ind. Pharm., v.34, p.33-45, 2008.
WOODLEY, J. Bioadhesion: new possibilities for drug administration? Clin. Pharmacokinet., v.40, p.77-84 2001.
Received for publication on 09th March 2013