Evaluation of Spectral Efficiency, System Capacity
And Interference Effects on CDMA Communication
System
Ifeagwu E.N.
1, Ekeh j
2, Ohaneme C.O.
1, Okezie C.C.
1 1Department of Electronics and Computer Engineering, Nnamdi Azikiwe University, Awka 2
Department of Electrical/ Electronic Engineering, Enugu State University of Technology,
Abstract— Wireless communication technology have been developed based on exploring new mobile communications frequency bands, reasonable use of frequency resources and
minimization, portability and multifunction’s of mobile stations.
The technology of wireless communications with duplex transmission is one of the fastest expanding in the world today. A very effective solution in achieving network performance in terms of system capacity and spectral efficiency with respect to the CDMA wireless network is presented in this paper. The effect of how interference grows as the number of users increases is analyzed. Equally, this paper presents the major problems in CDMA as the multiple access interference which arises due to the deviation of the spreading codes from orthogonality.
Keywords- Bandwidth; Capacity; Interference; Pseudo-noise.
I. INTRODUCTION
Wireless communication technologies have basically been developed based on exploring new mobile communication frequency bands, reasonable use of frequency resources and minimization, portability and multi-functions of mobile stations. The concept of cellularization sprung up as the demand for mobile communication increased [1].
It seeks to make an efficient use of available channels by employing low-power transmitters so that within certain distances, the same frequency could be reused without dcisrupting the integrity of the conversation taking place on a channel.
Cellular services are now being used every day by millions of people worldwide. The major objective of a cellular system is to be able to handle as many calls as possible in a given bandwidth with the specified blocking probability (reliability) [2]. An efficient use of the available spectrum is achieved by finding ways to allow multiple users to share the available spectrum simultaneously. The Code Division Multiple Access (CDMA) was designed to achieve this feet. CDMA is a form of multiplexing and a method of multiple access that divides up a radio channel not by time nor frequency, but instead by using different pseudo-random code sequence for each user such that the transmitting end modulates the signals that it sends using the pseudo-random codes, and the receiving end detects the corresponding signals by demodulating the mixed signals using the same pseudo-random code [3]. The pseudo-pseudo-random code is a periodic binary sequence with a noise-like waveform. It is also called
pseudo-noise codes and is used to differentiate subscribers. The codes are shared by both the mobile station (MS) and the base station (BS). As a crude analogy to the CDMA scheme, imagine a large room (channel) containing many people wishing to communicate amongst each other. Possible mechanisms for avoiding confusion include: having only one person speak at a time (time division) [4], having people speak at different pitches (frequency division), or in different directions (spatial division). The CDMA approach is to have them speak different languages to each other. Groups of people speaking the same language can understand each other, but not any of the other groups. Similarly, in CDMA, each group of users is given a shared code. There are many codes occupying the same channel, but only the users associated with a particular code can understand each other. We have several modes of CDMA. They are;
1) Direct Spectrum CDMA (DS-CDMA). 2) Frequency Hopping CDMA (FH-CDMA). 3) Multi-carrier CDMA (MC-CDMA) 4) IS-95 CDMA
Code Division Multiple Access (CDMA) relies on the use of spread spectrum techniques to achieve multiple communication channels in a designated segment of the electromagnetic spectrum. With CDMA, each user's narrowband signal is modulated by a high rate special code (pseudo-random binary sequence). This causes the spreading of the bandwidth of the user's signal resulting in a wideband signal. A large number of CDMA users share the same frequency spectrum. In the receivers, the signals are correlated by the appropriate pseudo-random code which de-spreads the spectrum. The other users' signals whose codes do not match are not de-spread and therefore only appear as noise and represent a self-interference generated by the system. The signal-to-interference ratio for CDMA is determined by the ratio of the desired signal power to the total interference power from all the other users.
particular base station of the system simultaneously. The capacity of CDMA is therefore only limited to the amount of interference that can be tolerated from other users [2].
II. CDMACAPACITY DERIVATION
Using a unique pseudo-random noise (PN) code, a CDMA transmitting station spreads the signal in a bandwidth wider than actually needed. Each authorized receiving station must have the identical PN code to retrieve the information. Other channels may operate simultaneously within the same frequency spectrum as long as different, orthogonal codes are used. The long PN code is called a chip. The chip is modulated by the information data stream. The ratio of the chip rate Rc to the information data rate Rb is called the processing gain G:
b c
R
R
G
(1)Because the CDMA carrier bandwidth,
BT=
R
c;The processing gain, G can also be expressed as
b T
R
B
G
(2)Then, if Eb is the average bit energy of any channel’s signal, the power spectral density of the transmit signal (energy per chip) is:
G
E
R
R
E
bc b
b
(3)
In typical CDMA technology, when speech pauses, the transmit signal is switched off to save power. The voice activity state of channel n is denoted by
n
0
;
1
where {0;1} representing both the on and off states. The expected value isE
n
. Instead of switching off the transmit power, real systems transmit at a low power and data rate during voice inactivity. Therefore
can also be considered as the average transmit power divided by the transmit power during talk spurts. Let us define to be the mean value of the power spectral density of the interference noise caused by other channels. Because there are N channels in total, there are N - 1 channels other than the channel under consideration. Based on (3),
N
E
G
I
1
b/
_
(4)If
N
O stands for thermal noise of the system, then themean total noise power spectral density
I
tot is the sum of the interference noise and the thermal noise.tot
I
=I
N
o
N
1
E
b/
G
N
O_
(5)
We can then derive the number of total CDMA channels N
from (5) to be
1 1
1
O b
tot b
N
E
I
E
G
N
(6)From [7], Claude Shannon’s work relates the amount of information carried, channel bandwidth, Signal-to-noise ratio, and detection error probability; it shows the theoretical upper limit attainable.
Shannon’s capacity equation is given as
C= Bw log2 [1+S/N] (7)
Where Bw= Bandwidth in Hertz, C= Channel capacity in bits/second, S/N= Signal-to-noise ratio.
Capacity is determined by the balance between the required SNR for each user, and the spread spectrum processing gain. The figure of merit of a well-designed digital receiver is the dimensionless signal-to-noise ratio (SNR).
⁄
S
N
S
1
(8)where, S: power of the received signal from each user, N: number of users in the cell, η: Background noise. The SIR could be increased (interference reduced) by controlling the terms in the denominator of (8).
Eb/No (Energy-per-bit-to-Noise density ratio) could be
expressed by:
⁄
⁄ ⁄ (9)
where, : Energy per bit seen at the receiver,
W: spreading bandwidth,
R: information bit rate,
: Noise power spectral density.
Following from (9), the maximum number of users in the cell (capacity) could be expressed as:
N =1+ ⁄
⁄ (10)
For a multi-cell system, the base station suffers from inter-cell interference in addition to the intra-inter-cell interference. The effect of this interference on the SNR seen at the BS under consideration (B ) could be observed by simply adding an inter-cell interference term to (9).
⁄
⁄ ⁄ ⁄ (11)
Where, I: the total inter-cell interference seen by B receiver from users in neighbouring cells who are not controlled by B .
III. INTERFERENCE
The type of interference experienced in CDMA communication systems is the Multiple Access Interference or the Multi-user Interference. Multiple Access Interference (MAI) is a factor, which limits the capacity and performance of CDMA system. In contrast to FDMA and TDMA techniques which are frequency bandwidth limited, all users transmit in the same frequency band and are distinguished at the receiver by the user specific spreading code. All other signals are not de-spread because they use different codes. These signals appear as interference to the desired user. As the number of users increase, the signal to interference ratio (SIR) decrease until the resulting performance is no longer acceptable. Thus, this multi–user interference must be reduced to achieve higher capacities.
There are several ways of improving CDMA communication system capacity. They are:
Receiver beamforming,voice activation technology, power control, multiuser detection, using rake receivers and soft handoff.
A simple equation for the uplink capacity U of a single CDMA cell is given by:
E
N
G
WG
U
1
/
b O
2
(12)Where the value of ⁄ represents that required for adequate link performance. The scalar σ2 is the background noise power and S is the received signal power for each user. Finally G is the ratio of the antenna gain for the desired user to that of interfering user in that cell. The value of G depends on the beam pattern for each user, but will roughly be proportional to the array size M.
As a result, antenna arrays can improve the capacity in two ways:
This reduces the average level of interference from each user in the cell, permitting a capacity increase.
⁄ antenna array can provide increased space diversity at the base station, which can permit the receiver to operate at lower power signal. This increases the tolerance of the receiver to multiple access interference.
IV. SPECTRAL EFFICIENCY
Direct-Sequence Spread-Spectrum code-division multiple access (CDMA) has well-known desirable features: dynamic
channel sharing, robustness to channel impairments, graceful degradation, ease of cellular planning, etc. These advantages result from the assignment of “signature waveforms” with large time–bandwidth products to every potential user of the system. Each signature can be viewed as a vector in an N-dimensional signal space, where is N the spreading gain or number of chips per symbol [12]. The presence of multipath fading leads to the loss of orthogonality between signals transmitted by the same base station, which results in additional interference. The existence of this self-interference renders the problem of computing the spectral efficiency even more difficult, as the SINR (Signal-to-interference plus noise ratio) becomes now a ratio of non-independent random variables. Consider a downlink CDMA multi-cellular system in a frequency-selective Rayleigh fading channel and let the composite CDMA downlink signal comprises M1mutually orthogonal signals, which are destined
to M1different mobiles in the same cell. Though these signals
appear orthogonal at the transmitter side, however, the orthogonality is lost at the receiver side after being propagated over a multipath fading environment, resulting in intra-cell interference (self-interference) [13]. This interference adds to the noise and the inter-cell interference from neighbouring cells.
The fundamental figure of merit is the spectral efficiency C, defined as the total number of bits per chip that can be transmitted arbitrarily reliably. Since the bandwidth of the CDMA system is (roughly) equal to the reciprocal of thechip duration, the spectral efficiency can be viewed as thebits per second per hertz (bits/s/Hz) supported by the system. Note that if the code rates (bits per symbol) employed by each individual user are identical and denoted by R then the spectral efficiency is equal to the product.
C = (13)
Where K is the number of users and v is the spreading
factor.
In a system where no spreading is imposed, the encoders are able to control the symbols modulating each chip independently. Therefore, the Cover-Wyner capacity region of the conventional Gaussian multi-access channel applies to this case and the spectral efficiency in the absence of spreading is given by:
C = (14)
Once the spectral efficiency is determined, it is possible to obtain the minimum bandwidth necessary to transmit a predetermined information rate or the maximum information rate that can be supported by a given bandwidth. In order to compare different systems (with possibly different spreading gains and data rates), the spectral efficiency must be given as a function of . If the spectral efficiency of the system reaches the optimum level, then SNR can be substituted by:
Despite their overlap in time and frequency, the users can be completely separated at the receiver by means of a matched filter front-end provided the signature waveforms are mutually orthogonal. In that case, single-user error-control coding and decoding is sufficient. Moreover, channel distortion (such as multipath) and out-of-cell interference are common impairments that destroy the orthogonality of signature waveforms. Optimal spectral efficiency in non-orthogonal CDMA requires joint processing and decoding of users.
In our analysis of spectral efficiency we consider, in addition to optimal decoding (performed by a bank of matched filters), some popular linear multiuser detector front-ends: • Single-user matched filter,
• Decorrelator.
V. SIMULATION AND RESULTS
From (5),
⁄
While writing the codes;
is taken as ‘a’= 3/8 (voice activity factor), Eb=2dB (1.9953) is taken as ‘E’ (Average bit energy of the channel’s signal), N (Number of channels) which
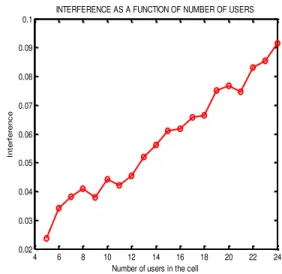
varies from 5 to 24, No (Noise power spectral density) whose values are generated by the MATLAB function randn(1,20), G=240 (Processing gain). The generated table is shown in table 1.
A plot of I against K from Program1 produces Figure 1.
Fig 1: Graph of interference against Number of users
This shows that as the Number of users increase, the generated interference also increases. This necessitates the need for power control during transmission from MSs (mobile stations) to reduce the rate of growth of interference on the channel as users increase.
From (14); C =
During plotting, K/N=B =0.1(Number of users per chip),C is taken as C (Spectral efficiency in the absence of spreading), SNR (Signal-to-noise-ratio), which ranges from 1 to10.The generated table is shown in Table 2.
TABLE 1:INTERFERENCE AND NUMBER OF CHANNELS USED BY USERS
4 6 8 10 12 14 16 18 20 22 24 0.02
0.03 0.04 0.05 0.06 0.07 0.08 0.09 0.1
Number of users in the cell
In
te
rf
e
re
n
c
e
TABLE 2:SPECTRAL EFFICIENCY AND SNR
A plot of C against SNR from Program 2 produces Figure. 2.
Fig. 2: Graph of Spectral efficiency as a function of Signal-to-noise ratio
It can be seen that at the receiver, as the Signal-to-noise ratio increases, the Spectral efficiency increases as well. In CDMA, as the number of users increase, multi-user interference increases causing the Signal-to-noise ratio at the receiver to decrease.
For acceptable quality of service a threshold Signal-to-noise ratio is set so that when exceeded, more users would not be accommodated. Also, interference reduction schemes are used to counter the effects of interference on a received signal to improve the efficient use of the allocated spectrum by adding more users until the threshold is reached.
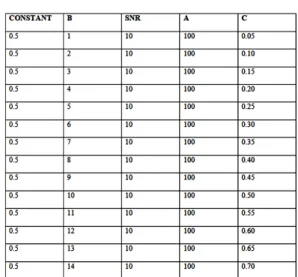
From (15),
SNR=
It follows that C= 0.5B
During plotting, B= K/N (Number of users per chip) which is the variable term;
A= Eb/No= 3 (Noise density ratio);
SNR= 100dB= 10
(Signal to noise ratio); C (Spectral efficiency). The generated table is;
TABLE 3:SPECTRAL EFFICIENCY AND NUMBER OF USERS
PER CHIP
From Program3, a plot of C against B produces Figure 3.
Fig. 3: Graph of Spectral efficiency as a function of Number of users per chip
It shows that as the Number of users increase, the Spectral efficiency increases as well. The implication of this is that within the threshold Signal-to-noise ratio already set, the more the number of users a channel carries, the better the utilization of the channel.
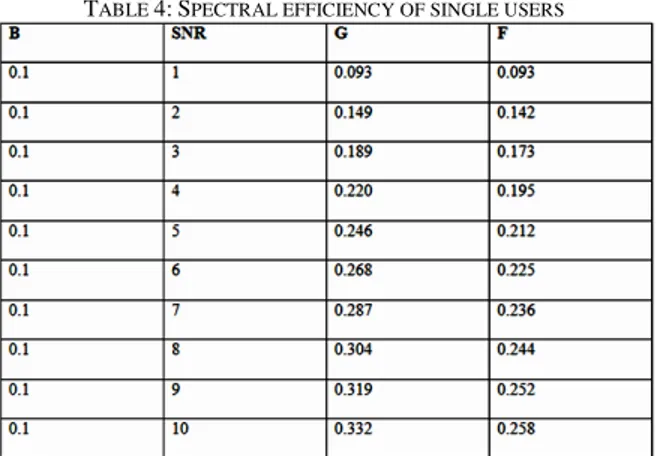
From (17) and (18),
Where = B (Number of users per chip), = G
(Decorrelator), = F Single-user matched filter). The generated table is:
1 2 3 4 5 6 7 8 9 10
0 0.05 0.1 0.15 0.2 0.25 0.3 0.35 0.4
Signal-to-noise ratio
s
p
e
c
tr
a
l
e
ff
ic
ie
n
c
y
Spectral efficiency VS Signal-to-noise ratio
0 2 4 6 8 10 12 14 16 18 20
0 0.1 0.2 0.3 0.4 0.5 0.6 0.7 0.8 0.9 1
Number of users per chip
S
p
e
c
tr
a
l
E
ff
ic
ie
n
c
y
TABLE 4:SPECTRAL EFFICIENCY OF SINGLE USERS
From Program4, plots of G against SNR and F against SNR produce the graphs in Figure 4.
Fig. 4: Spectral efficiencies of Single-User
It shows the Spectral efficiencies of Single-user matched filter and Decorrelator when used at the receiver. Evidently, when faced with the same SNR, the Decorrelator performance is better than that of the Single-user matched filter. Hence, for effective bandwidth utilization and improved capacity, Decorrelators are preferred to Single-user matched filter.
VI. CONCLUSION
In this paper, through our simulations, we have analysed how interference grows as the number of users increase. We have also shown how the summation of interference and noise vary the capacity and spectral efficiency of a CDMA communication system. We have discussed the major problem
in CDMA as the multiple Access interference (MAI) which arises due the deviation of the spreading codes from perfect orthogonality. Finally, the capacity of CDMA is interference limited .the obvious way to increase capacity of the CDMA is to reduce the level of interference through the methods described in this project.
REFERENCES
[1] Abdullah Aburomeh, (2009) “Capacity Analysis of Cellular CDMA
Systems” (ECE 559 Project)
[2] A. M. Viterbi, A. J. Viterbi (2008) “Erlang Capacity of a power
Controoled CDMA system”
[3] Darren D. Chang and Olivier L. de Weck, 2005‘Basic capacity calculation methods and benchmarking for MF-TDMA and MF-CDMA
communication satellites’ .INTERNATIONAL JOURNAL OF
SATELLITE COMMUNICATIONS AND NETWORKING; 23:153–
171.
[4] K. S. Gilhousen et al., 1991 “On the capacity of a cellular CDMA
system,” IEEE Trans. Veh. Technol., vol. 40, pp. 303–312,
[5] Tony Dean, Phil Fleming, Alexander Stolyar, 1998 ‘ESTIMATES OF
MULTICARRIER CDMA SYSTEM CAPACITY’. Proceedings of the Winter Simulation Conference.
[6] L. Nithyanandan, P. Dananjayan, ‘Analytical BER computation for
interference cancellation receiver in MC-CDMA system’. Dept. Of
Electronics and communication Engineering, Pondicherry Engineering College, Pondicherry-605014, India.
[7] J. C. Liberti and T. S. Rappaport,1999 ‘Smart Antennas for Wireless
Communications’: IS-95 and Third Generation CDMA Applications. EnglewoodCliffs, NJ: Prentice-Hall
[8] Aylin Yener, Roy D. Yates, Sennur Ulukus, 2001 ‘ Interference
Management for CDMA Systems Through Power Control, Multiuser
Detection, and Beamforming’. IEEE TRANSACTIONS ON
COMMUNICATIONS, VOL. 49, NO. 7
[9] Jin Yu, Yu-Dong Yao, and Jinyun Zhang-2004 “IEEE TRANSACTIONS ON VEHICULAR TECHNOLOGY, VOL. 53, NO. 5, pp 1423. [10] Kamal Shahtalebi, Gholam Reza Bakhshi, Hamidreza Saligheh Rad,
2007 ‘Interference Cancelation in Coherent CDMA Systems Using
Parallel Iterative Algorithms’
[11] Robert Akl, Manju Hegde, Alex Chandra,1998 ‘CCAP: CDMA Capacity
Allocation and Planning’. Washington University, Missouri, USA [12] Sergio Verd´u, and Shlomo Shamai (Shitz), 2009 ‘Spectral Efficiency of
CDMA with Random Spreading’. IEEE TRANSACTIONS ON
INFORMATION THEORY, VOL. 45, NO. 2.
[13] Khairi Ashour Hamdi, and Pongsatorn Sedtheetorn, 2008‘On the
Spectral Efficiency of CDMA Downlink Cellular Mobile Networks’. IEEE TRANSACTIONS ON WIRELESS COMMUNICATIONS, VOL. 7, NO. 11
[14] Shlomo Shamai (Shitz), and Sergio Verdú,2001 ‘The Impact of
Frequency-Flat Fading on the Spectral Efficiency of CDMA’. IEEE
TRANSACTIONS ON INFORMATION THEORY, VOL. 47, NO. 4.
1 2 3 4 5 6 7 8 9 10 0.05
0.1 0.15 0.2 0.25 0.3 0.35 0.4
Signal-to-noise ratio SNR
S
p
e
c
tr
a
l
e
ff
ic
ie
n
c
y
Single-User Matched Filter vs decorrelator