Abstract— In this paper, optimization procedures based on particle
swarm optimization (PSO) are investigated, aiming to efficiently solve the optimal resource allocation for signal-to-noise plus interference ratio (SNIR) optimization of optical code paths (OCPs) from wavelength division multiplexing/optical code division multiplexing (WDM/OCDM) considering imperfections on physical layer. The characteristic of the PSO is attractive due their performance-complexity tradeoff and fairness regarding the optimization methods that use numerical methods, matrix inversion and other heuristics. The SNIR model considers multiple access interference (MAI) between the OCP based on 2-D codes (time/wavelength), amplifier spontaneous emission (ASE) at cascaded amplified spans, and group velocity dispersion (GVD) and polarization mode dispersion (PMD) dispersion effects. The numerical results have revealed the viability of the PSO algorithm considering solution quality and convergence. Besides, the numerical results have shown a penalty when the ASE, GVD and PMD effects are considered.
Index Terms— Particle swarm optimization, resource allocation, wavelength division multiplexing/optical code division multiplexing
I. INTRODUCTION
The integration of wavelength division multiplexing (WDM) with optical code division multiplexing
(OCDM) allows to apply this technology in code/wavelength routed networks with the objective to
improve the capacity granularity and scalability of optical networks [1]. The advantages, like
asynchronous operation, distributed control, and differentiated services with quality of service (QoS)
at the physical layer, have made the WDM/OCDM rather attractive [2]. These networks create optical
code paths (OCP) based on wavelength/code, and each different OCP defines a user or logic channel
[3]. In a common channel, the interference that may arise between different OCPs is known as
multiple access interference (MAI), and it can limit the number of OCPs utilizing the channel
simultaneously [2]. In the dynamic traffic scenario of WDM/OCDM optical networks, the objective is
to minimize the blocking probability of the connections by routing, assigning channels, and to
maintain an acceptable level of optical power and adequate signal-to-noise plus interference ratio
(SNIR) all over the network [4-5]. The SNIR optimization problem appears to be a huge challenge,
since the MAI introduces the near-far problem [4-6]. Furthermore, if the distances between the nodes
Particle Swarm Optimization in
WDM/OCDM Networks with Physical
Impairments
Fábio R. Durand
Universidade Tecnológica Federal do Paraná – UTFPR – [email protected]
Taufik Abrão
are quite different, like in real optical networks, the signal power received from various nodes will be
significantly distinct. Thus, considering the WDM/OCDM cross-connect as the reference, the
performance of closer nodes is many orders of magnitude better than that of far ones [7-8]. The
solution based on the static power budget analysis establishes the transmitted power necessary to
reach the photodiode sensibility. The design based on static power budget results in transmitted power
higher or lower than necessary transmitted power, then occurs the increase of near-far problem [7]. To
solve this problem, is adequate to apply dynamic power control that defines the transmitted power
according the number of active transmitters nodes [8]. In this way, an efficient power control is
needed to overcome this problem and enhance the performance and throughput of the network; this
could be achieved through the SNIR optimization [4-8].
In this case, which is analogous to the CDMA cellular system, the power control (centralized or
distributed) is one of the most important issues, because it has a significant impact on both
performance and capacity. It is the most effective way to avoid the near-far problem and to increase
the SNIR [6]. Furthermore, different channels can travel via different OCP and also have different
levels of QoS requirements. The QoS in the WDM/OCDM networks depends on SNIR, dispersion,
and non-linear effects. The dominant impairment in SNIR is given by amplified spontaneous emission
(ASE) noise accumulation in chains of optical amplifiers and its effect on SNIR [4][7]. Therefore, it is
desirable to adjust network parameters (optical power or amplifier gains) in an optimal way, based on
on-line decentralized iterative algorithms to accomplish such adjustment [4-7]. This dynamic
optimization will result in increased network flexibility and capacity [5].
Besides, recent researches have shown the utilization of resource allocation and optimization
algorithms such as Local Search (LS), Simulated Annealing (SA), Genetic Algorithm (GA), Particle
Swarm optimization (PSO), Ant Colony optimization (ACO) and Game Theory to regulate the
transmitted power, bit rate variation and the number of active users in order to maximize the
aggregate throughput of the optical networks [7-9]. In the case of the OCP networks optimization, it is
necessary to consider the use of distributed iterative algorithms with high performance-complexity
tradeoffs and the imperfections of physical layer, which constitute a new research area so far, which
was investigated under an analytical perspective in [4-8]. It is worth noting the routed WDM/OCDM
networks brings a new combination of challenges with the power control, like amplified spans,
multiple links, accumulation, and self-generation of the optical ASE noise, as well as the MAI
generated by the OCPs. On the other hand, the dispersive effects, such as chromatic or group velocity
dispersion (GVD) and polarization mode dispersion (PMD), are signal degradation mechanisms that
significantly affect the overall performance of optical communication systems [10-12].
In this paper, optimization procedures based on PSO are investigated in details, aiming to efficiently
solve the optimal resource allocation for SNIR optimization of OCPs from WDM/OCDM networks
considering imperfections on physical layer. Herein, the adopted SNIR model considers the MAI
GVD and PMD dispersion effects. The optimization method based on the heuristic PSO approach is
attractive due to its performance-complexity tradeoff and fairness features regarding the optimization
methods that deploy matrix inversion, purely numerical procedures and other heuristic approaches
[4-8]. The PSO was previously utilized in wireless communication to solve the resource allocation
problem, however in optical transport network it is more challenging solve this problem as illustrated
above. In this context the main contributions of the paper are i) development of the PSO scheme to
solve the problem of resource allocation in optical transport network, ii) inclusion of the physical
restrictions in the model to verify the convergence of PSO and impact on the transmitted power for bit
rate of 10 and 40 Gbps.
A. Organization
The rest of this paper is organized as follows: aiming to solve the resource allocation problem, Section
2 describes the SNIR optimization procedure for the OCPs based on particle swarm intelligence.
Numerical results are discussed in Section 3 considering realistic networks operation scenarios.
Finally, the main conclusions are offered in Section 4.
II. SNIROPTIMIZATION PROCEDURES
In the present approach, the SNIR optimization is based on the definition of the minimum power
constraint (also called sensitivity level) assuring that the optical signal can be detected by all optical
devices. The maximum power constraint aids in the minimization of nonlinear physical impairments,
because it makes the aggregate power on a link to be limited to a maximum value. The power control
in optical networks appears to be an optimization problem.
A. Problem Description
Denoting i the carrier-to-interference ratio (CIR) at the required decoder input, in order to get a
certain maximum bit error rate (BER) tolerated by the i-th optical node, and defining the K
-dimensional column vector of the transmitted optical power p = [p1, p2,…, pK] T
, the optical power
control problem consists in finding the optical power vector p that minimizes the cost function J
pcan be formulated as [6-8] :
min
KR
J
p
p
K
i 1
min
min
,
K
i
T
i
R p R
p
p1 p
subject to:
* , 1 2
K i j j eq sp j ij amp D amp i ii i N p G G G p G maxmin p P
P i i = 1,.., K,
min 0, max 0
P P
where 1T= [1, ..., 1]and *is the minimum CIR to achieve a desired QoS; G
ii is the attenuation of the
OCP taking into account the power loss between the nodes, according to network topology, while Gij
corresponds to the attenuation factor for the interfering OCP signals at the same route, i.e. it
represents the interaction (MAI) of different codes at the same route; Gamp is the total gain at the OCP,
eq sp
N is the spontaneous noise power (ASE) for each polarization at cascaded amplified spans [4], pi is
the transmitted power for the OCP-i and pj is the transmitted power for the interfering OCP; D is the
pulse spreading due to the combined effects of the GVD and the first-order PMD for Gaussian pulses
[11,13] and K is the number of OCPs. Using matrix notations, (1) can be written as Ι - Γ H p u* ,
where I is the identity matrix, H is the normalized interference matrix, the elements of which
evaluated by Hij Gij Gii for i j and zero for another case, thus ii eq sp
i N G
u * , where there is a
scaled version of the noise power. Substituting inequality by equality, the optimized power vector
solution through the matrix inversion * * -1
p = Ι - Γ H u could be obtained. The matrix inversion is
equivalent to centralized power control, i.e. the existence of a central node in power control. The
central node stores information about all physical network architecture, such as fiber length between
nodes, amplifier position and regular update for the OCP establishment, and traffic dynamics. These
observations justify the need for on-line SNIR optimization algorithms, which have provable
convergence properties for general network configurations [6-8].
The SNIR and the carrier to interference ratio in eq. (1) are related to the factorNT/, i. e.,
2
/
i NT i
. The bit error probability (BER) is given by Pb(i)erfc
i 2
2, when the Gaussianapproximation is adopted, and the signal-to-noise plus interference ratio (SNIR) at each OCP,
considering the 2-D codes, is given by [4,8],
K
i j j
eq sp j ij amp
D amp i ii T i
N p G G
G p G N
, 1 2
2
2
(2)
where the average variance of the Hamming aperiodic cross-correlation amplitude is represented by
2
[2].
B. Physical Restrictions
The physical impairments are signal degradation mechanisms that significantly affect the overall
performance of optical communication systems [10-13]. For the data that are transmitted through a
transparent optical network, degradation effects may accumulate over a large distance. The major
linear physical impairments are group velocity dispersion (GVD), polarization mode dispersion
(PMD), and amplifier spontaneous emission (ASE) noise [10-13]. On the other hand, the major
nonlinear physical impairments are self phase modulation (SPM), cross-phase modulation (XPM),
nonlinear physical impairments are excited with high power level [5-7]. However, the maximum
power constraint aids the minimization of nonlinear physical impairments, because it makes the
aggregate power on a link to be limited to a maximum value [4-5]. Currently, besides GVD, the main
linear impairment is the PMD, that must be considered in high capacity optical networks. Differently
from GVD, PMD is usually difficult to accurately determine and compensate totally due to its
dynamic nature and its fluctuations induced by external stress/strain applied to the fiber after
installation [10-13]. Furthermore, in order to avoid high power penalty it is adequate to consider PMD
compensation scheme that requires a dynamically controlled birefringent element, which has the same
PMD characteristics as the fiber but in the opposite birefringent axis [14]. For more details on PMD
compensation aspects and procedures, please see [14,15].
As a result, the signals quality in a WDM/OCDM network can be adequately evaluated by
analyzing the GVD, PMD and MAI restrictions. PMD impairment establishes an upper bound on the
length of the optical segment due to fiber dispersion, which causes the temporal spreading of optical
pulses. On the other hand, due to the advances in the fiber manufacturing process with a continuous
reduction of the PMD parameter, the deleterious effect of PMD will not be an issue for 10 Gbps or
lower bit rates, for future small and medium-sized networks [12]. In this context, the dominant
impairment in SNIR is determined by: i) ASE noise accumulation in chains of optical amplifiers for
future optical networks [4-7], and; ii) ASE, GVD and PMD for currently stage of optical networks
with the first-order PMD compensation mechanism [10-16].
The pulse spreading effect due to the combined effects of the GVD and the first-order PMD for
Gaussian pulses – after application of the first-order PMD compensation method – can be calculated
as [4,13,16]:
2 2
2 2
2 2
2 2 2
0 0
5 1 4
1 1 1 1
3 3
2 2 2 1
p ij ij
D p
p
C d d x
C x
C
2
2
4 2
1 1 1
3
1 p p
C x
C
(3)
where Cp is the chirp parameter, 0
2 2 ln 2
C
T
is the RMS pulse width, Tc is the chip period at half
maximum, 2 D02 2c is the GVD factor, D is the dispersion parameter, c is the speed of light in
the vacuum, 2
0 2 4
x and DPMD dij , DPMD is the PMD parameter, and dij is the link
length. Although there is a difference in the GVD for each wavelength, resulting from time skewing
between the wavelengths, the consideration of the same GVD value for the entire transmission
window is reasonable for a small number of wavelengths, as for the present code.
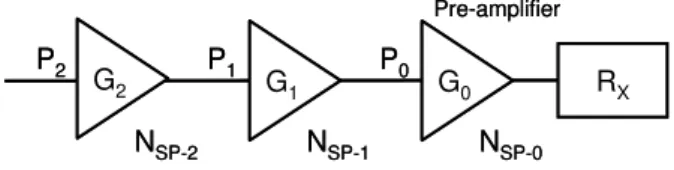
The amplifier spontaneous emission (ASE) model at the cascaded amplified spans (depicted in Fig.
1) is discussed in [4,17]. This model considers that the receiver gets the signal from a link with
contemplated as the number 0 cascade amplifier. Let Gi be the amplifier gain, i. e. Nsp-i will be its
spontaneous emission factor. The span between the i-th and the (i − 1)-th amplifier has the attenuation
Gii. The Pti is the mark power at the i-th amplifier input. The equivalent spontaneous emission factor
is given by [4, 17]
1
1 1
0 1
0 0 0
1 1
G G G
G N G G G N N
ii sp ii
sp eq
sp (4)
Calculating recursively the Nspeqfactor, one can find the noise at the cascading amplifiers. The noise
for i-th amplifier is given by Nspi 2nsphf
Gi 1
B0, which take into account the two polarization mode presented in a single mode fiber [8]. Where nSP is the spontaneous emission factor, typicallyaround 2 − 5, h is Planck’s constant, f is the carrier frequency, Giis the amplifier gain and Bo is the
optical bandwidth. Ideally, to reduce the ASE noise power, the optical bandwidth can be set to a
minimum of Bo = 2R, where R is the bit rate. Without loss of generality, all employed optical
amplifiers provide a uniform gain, setting the maximum obtainable Erbium-doped fiber amplifier
(EDFA) to 20 dB across the transmission window. This is a reasonable assumption for the reduced
number of wavelengths in the code transmission window (4 wavelengths), considering the optical
amplifier gain profile, where the maximum difference of this gain is 0.4 dB for the wavelength, which
is the most distant one from the central wavelength (1550 nm), with spectral spacing of 100 GHz
[4-6].
Fig. 1. Cascading amplifiers.
C. Particle Swarm Optimization
Particle Swarm Optimization (PSO) is a population-based stochastic optimization algorithm for
global optimization that was presented first in 1995 [18]. It is based on the behavior of social groups
like fish schools or bird flocks and it differs from other well-known Evolutionary Algorithms (EA).
As in EA, a population of potential solutions is used to probe the search space, but no operators,
inspired by evolution procedures, are applied on the population to generate new promising solutions
[19]. The fact which is recursively exploited is that an improved performance can be gained by
interactions between individuals, or more specifically by imitation of successful individuals. In a PSO
system, particles fly around in multidimensional search space. During the flight, each particle adjusts
its position according to its own experience, and the experience of neighboring particles, making use
of the best position encountered by itself and its neighbors. The swarm direction of a particle is
defined by the set of particles neighboring the particle and its history experience. Although PSO does
not rely on the survival of the fittest principle, it is often classified as an evolutionary algorithm (EA)
RX
G0
G1
G2
NSP-0
NSP-1
NSP-2
P2 P1 P0
Pre-amplifier
RX
G0
G1
G2
NSP-0
NSP-1
NSP-2
P2 P1 P0
because the update equations, which control the movement of individuals, are similar to the
evolutionary operators used in EAs.
In general, the PSO performance for resource allocation problem can guarantee fast convergence
and fairness within fewer iterations regarding the genetic-based algorithm [9]. It is well known in the
literature that the PSO performance for resource allocation problem is highly dependent on its control
parameters and that recommended parameter settings from the literature often do not lead to reliable
and fast convergence behavior for the considered optimization problem [20-22]. In the PSO process,
each particle keeps track of its coordinates in the space of interest, which are associated with the best
solution (fitness) it has achieved so far. Another best value tracked by the global version of the
particle swarm optimizer is the overall best value, and its location, obtained so far by any particle in
the population. At each time iteration step, the PSO concept consists of velocity changes of each
particle toward local and global locations. Acceleration is weighted by a random term, with separate
random numbers being generated for acceleration toward local and global locations. Let bp and vp
denote a particle coordinates (position) and its corresponding flight speed (velocity) in a search space,
respectively. In this strategy, each power-vector candidate [ ], with dimension , is used for the velocity-vector calculation of the next iteration [19]:
[ ] [ ] [ ] [ ]( [ ] [ ])
[ ]( [ ] [ ])
(5)
where [ ] is the inertia weight of the previous velocity in the present speed calculation, the velocity-vector has K dimension [ ] [ ] ; the diagonal matrices [ ] and [ ] with dimension K have their elements as random variables with uniform distribution ∼ U ∈ [0, 1], generated for the pth particle at iteration t = 1, 2, . . . , ; [ ] and [ ] are the best global vector-position and the best local vector-position found until the iteration, respectively; and
are acceleration coefficients regarding the best particles and the best global positions influences in the
velocity updating, respectively. The particle’s position at the tth iterationis defined by the power
candidate-vector [ ] [ ] . The position of each particle is updated using the new velocity vector for that particle,
[ ] [ ] [ ] (6)
where is the population size. In order to reduce the likelihood that the particle might leave the
search universe, maximum velocity factor factor is added to the PSO model, which will be
responsible for limiting the velocity to the range [ ]. Hence, the adjustment of velocity allows the particle to move in a continuous but constrained subspace, been simply accomplished by:
From (7) it’s clear that if | | exceeds a positive constant value specified by the user, the th
particle’ velocity of kth user is assigned to be sign( ) , i.e. particles velocity on each of
-dimension is clamped to a maximum magnitude . Besides, if the search space could be defined
by the bounds [ ], then the value of typically is set so that
where please refer to Chapter 1 within the definition of reference [19].
In order to elaborate further about the inertia weight it can be noted that a relatively larger value of
is helpful for global optimum, and lesser influenced by the best global and local positions, while a
relatively smaller value for is helpful for convergence, i.e., smaller inertial weight encourages the
local exploration as the particles are more attracted towards and [18-19]. Hence, in order
to achieve a balance between global and local search abilities, a linear inertia weight decreasing with
the algorithm convergence evolving was adopted, which has demonstrated good global search
capability at beginning and good local search capability latter iterations:
[ ] ( ) ( )
(8)
where and is the initial and final weight inertia, respectively, , is the maximum number of iterations, and ∈ [ ] is the nonlinear index [23].
The following maximization cost function could be employed as an alternative to OCP resource
allocation optimization [24]. This single-objective function was modified in order to incorporate the
near-far effect [24-25]
∑ (
)
∈
(9)
where L is the number of different group of information rates allowing in the system, and is the
number of user in the lth rate group with minimum rate given by . Important to say, the second
term in eq. (9) gives credit to the solutions with small standard deviation of the normalized (by the
inverse of rate factor, ) received power distribution:
( ) (10)
i.e. closer the normalized received power values are with other (small variance of normalized received
power vector), the bigger contribution of the term
. For single-rate systems,
. It is worth to note that since the variance of the normalized received power vector, , normally
assumes very small values, the coefficient just also take very small values in order to the ratio
achieves a similar order of magnitude of the first term in (9), been determined as a function of the
number of users, . Hence, the term
WDM/OCDM systems, and at the same time it has a non-zero value for all swarm particles [21].
Finally, the threshold function in (9) is simply defined as:
{
(11)
where the SNIR for the th user, , is given by (2). The term
gives credit to those
solutions with minimum power and punishes others using high power levels [20].
The PSO algorithm consists of repeated application of the updating velocity and position, eq. (5) and
(6), respectively. The pseudo-code for the single-objective continuous PSO power allocation problem
is presented in Algorithm 1.
Algorithm 1 Continuous PSO Algorithm for the Power Allocation Problem
Input: ; Output: begin
1. initialize the population at ; [ ] [ ]
[ ] [ ] [ ]
[ ] : null initial velocity;
2. while
a. calculate ( [ ]) [ ] ∈ [ ], using (9); b. update velocity [ ] , through (5); c. update best positions:
for
If ( [ ]) ( [ ]) [ ]
[ ] [ ]
else [ ] [ ] end
if [ ] | [ ( [ ]) ( [ ])] [ ] [ ( [ ]) ( [ ]) ]
[ ] [ ]
else [ ] [ ]
d. Evolve to a new swarm population [ ], using (9);
e. Set .
end
3. [ ]. end
: population size.
[ ] particle population matrix, dimension .
: maximum number of swarm iterations.
: maximum power vector considering each mobile terminal rate class. : minimum data rate common to all users
The quality of solution achieved by any iterative resource allocation procedure could be measured by
how close the found solution is from the optimum solution, and can be quantified by the normalized
mean squared error (NMSE) when equilibrium is reached. For power allocation problem, the NSE
definition is given by,
[ ] [‖ [ ] ‖ ‖ ‖ ] (12)
III. NUMERICAL RESULTS
For all simulations, it is considered the transmission over a nonzero-dispersion shifted fiber
(NFD)-ITU G.655 with fiber attenuation (α) of 0.2 dB/km, non-linear parameter (Γ) of 2 (W.km)-1,
zero-dispersion wavelength (λ0) of 1550 nm, dispersion slope (S0) of 0.07 ps/(nm
2
.km). The signal is
placed at λ0 and its peak power is P. Note that the nonlinear length [4] LNL= 1/(ΓP) is limited to 500
km, which is much longer than the considered fiber lengths; besides self-phase modulation (SPM)
should not seriously affect the system performance. Furthermore, the threshold power for stimulated
Brillouin scattering (SBS) is below a few mW; as a result, SBS should also not interfere in our results.
Similarly, for these considerations, the physical impairments, such as stimulated Raman scattering
(SRS) should not be relevant [4]. Typical parameter values for the noise power in all optical
amplifiers were assumed [5-7]. So, it was adopted nSP= 2, h=6.63 × 10− 34
(J/Hz), f=193.1 (THz),
G=20 (dB) and Bo=30 (GHz). Herein, it was considered an amplifier gain of 20 dB with a minimum
spacing of 60 km, DPMD=0.1ps km, and D=15 ps/nm/km. Losses for encoder/decoder and OXC
architecture of 5 dB and 20 dB, respectively, were included in the power losses model [3]. The
parameters are code weight of 4 and code length of 101, thus the code is characterized by (4 × 101, 4,
1,0) and the target SNIR *
20
i
dB was adopted. The parameter ρ in cost function (9), was set as a
function of the number of OCPs (K), such that ρ = K × 10−19. This relation was adapted from [21] for
the power-rate allocation problem through non-exhaustive search [20]. The swarm population size
was set by . The acceleration coefficient values lie on C1 = 1.8 and C2 = 2.0, in terms
solution quality trade-off [20].
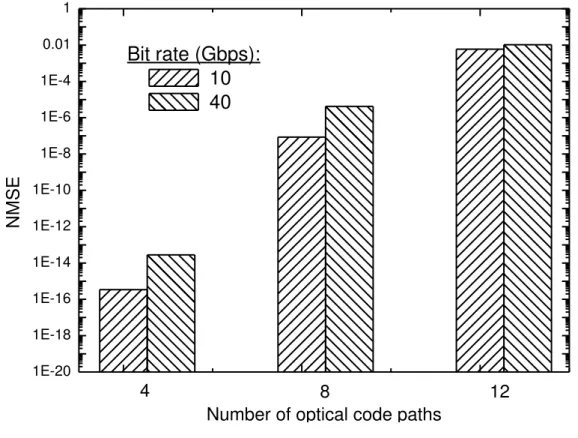
The solution quality (NMSE) versus convergence trade-off analyses can be captured in Figs. 2,
where the WDM/OCDM networks with distinct number of OCPs have been considered. Besides, a
span with K OCPs uniformly distributed over a length of 2 dij 100 [km] for 10 and 40 Gbps has
been considered. The numerical results show that NMSE increases when the number of OCPs
increases as well as when the bit rate increases. The number of OCPs is directly related to the
MAI arising, which increases with the number of OCPs, i.e., the MAI effects are strongly
influenced by the increase of the number of active OCPs; an error occurs when
cross-correlational pulses from the (K–1) interfering OCPs built up to a level higher than the
autocorrelation peak, changing a bit zero to a bit one. On the other hand, the pulse spreading
Fig. 2. NMSE for the number of OCPs.
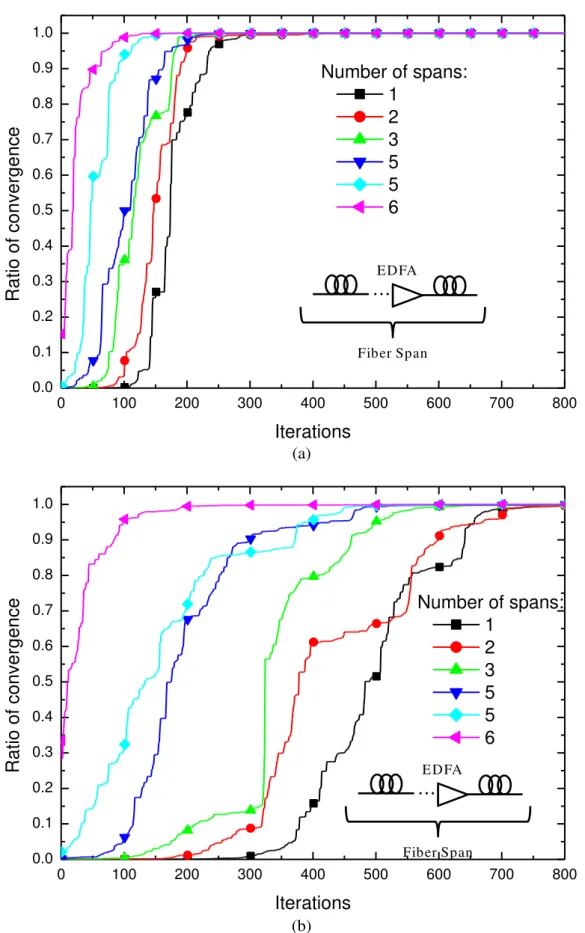
The convergence quality of the PSO algorithm presents variation with the increase in the number of
spans. The figure of merit utilized as tool to this analysis is the rate of convergence (RC), which can
be described as the ratio of PSO solution after the t-th iteration divided by the PSO solution after total
convergence, which in this optimization context is given by the matrix inversion solution, as
discussed in Section 2.1. The RC can be expressed as:
[ ] | [ ] [ ] [ ] | (13)
The reader interested in quality of solution metrics, a similar definition for RC and another figure of
merit for the PSO, namely success cost, are presented in [19].
Fig. 3 (a) and (b) shows the convergence rate of the sum of power for vector evolution through the
800 iterations for 4 to 8 OCPs, respectively, considering 1 until 6 spans. The results have shown that
increasing span number results in a faster convergence. This fact occurs because until 6 spans the
increase of the number of span increases mainly the contribution of the amplifier with signal, besides
for more than 6 spans the contribution of the amplifier is for the ASE noise. On the other hand, the
increase in the number of OCPs results in a slow convergence that results from the MAI between the
OCPs.
1E-20 1E-18 1E-16 1E-14 1E-12 1E-10 1E-8 1E-6 1E-4 0.01 1
12
4
8
N
M
SE
Number of optical code paths
Bit rate (Gbps):
10
(a)
(b)
Fig. 3. Rate of convergence versus the number of iterations for 1 until 6 spans for (a) 4 OCPs and (b) 8 OCPs.
In summary, our numerical results for the power minimization problem considering different
number of OCPs have revealed the viability of the heuristic PSO-based optimization procedure in
0 100 200 300 400 500 600 700 800 0.0
0.1 0.2 0.3 0.4 0.5 0.6 0.7 0.8 0.9 1.0
...
Fiber Span ED FA
R
a
tio
o
f c
o
n
ve
rg
e
n
ce
Iterations
Number of spans:
1
2
3
5
5
6
0 100 200 300 400 500 600 700 800 0.0
0.1 0.2 0.3 0.4 0.5 0.6 0.7 0.8 0.9 1.0
...
Fiber Span ED FA
Number of spans:
1
2
3
5
5
6
R
a
tio
o
f c
o
n
ve
rg
e
n
ce
order to solve power allocation problem in optical network links with until 8 OCPs and bit rate of 10
and 40 Gbps; in these scenarios, low NMSE (of order of 10-5) after PSO convergence and target
SNIRs have been achieved. Furthermore, the numerical results revealed that increasing the number of
spansresults in a faster convergence. In this context, the PSO algorithm is quite suitable to solve the
power allocation problem in OCPs that present feasible solution when considering power constraint.
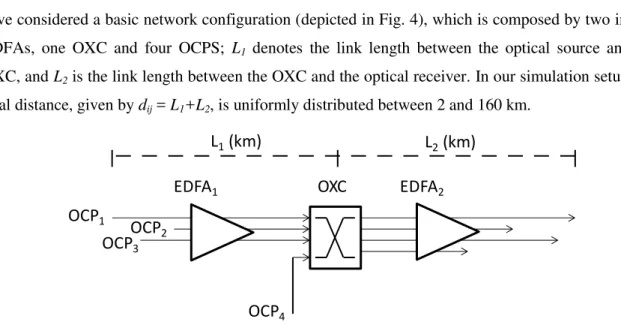
In order to evaluate the impact of bit rate and physical restrictions on the WDM/OCM networks we
have considered a basic network configuration (depicted in Fig. 4), which is composed by two in-line
EDFAs, one OXC and four OCPS; L1 denotes the link length between the optical source and the
OXC, and L2 is the link length between the OXC and the optical receiver. In our simulation setup, the
total distance, given by dij = L1+L2, is uniformly distributed between 2 and 160 km.
Fig. 4. Simple network configuration.
Numerical results presented in Fig. 5 shows the evolution of the power allocated obtained by the
PSO algorithm with respect to the number of iterations, considering 4 OCPs under a) ASE effects; b)
bit rate of 10 Gbps with ASE, GVD and PMD effects, and c) bit rate of 40 Gbps with ASE, GVD and
PMD effects. In these cases unconstrained transmitted powers have been considered.
Figure 5 illustrates the transmitted power toward convergence (optimum allocated power) for each
network node obtained by taking into account the centralized control plotted with the horizontal
dotted lines and the transmitted power when the heuristic PSO- based algorithm is deployed. We can
observe the convergence values for the PSO for 10 and 40 Gbps, which could be calculated at each
node without the need of a central node. The results have shown that increasing bit rate from 10 to 40
Gbps results in a dramatic increasing of transmitted power. As a result, the average transmitted power
is: (a) 0.036 mW, (b) 0.18 mW and (c) 0.64 mW considering span with in line amplifier.
Fig.5 shows that when ASE, GVD and PMD effects are considered there is a mean power penalty
of 7 and 12.5 dB for 10 and 40 Gbps, respectively, compared with the situation where only ASE is
considered (fibers with low PMD). The PMD effects degrade the performance when the link length
and bit rate increase. This effect occurs because PMD impairment establishes an upper bound on the
link length, which causes the temporal spreading of optical pulses. The upper bound for link distance
depends on the chip-rate distance product(d.R.NT ), where d is the link length, R is the bit rate, and NT
is the code length. The analysis of code parameters, MAI and PMD effects for 2D-based OCPs was
OCP1
OCP2 OCP3
OCP4
EDFA1 OXC EDFA2
previously reported in [11].
(a) (b) (c)
Fig.5. PSO power evolution for 4 OCPs for a) ASE effects; b) bit rate of 10 Gbps with ASE, GVD
and PMD and c) bit rate of 40 Gbps with ASE, GVD and PMD.
In order to evaluate the impact of OCPs number on the WDM/OCM network, further numerical
results presented in Fig. 6 shows the sum of power evolution of the PSO algorithm with respect to the
number of iterations for the same scenario of network illustrated in Fig. 4, considering a) 4 and b) 8
OCPs for 10 and 40 Gbps, both with ASE, GVD and PMD effects.
The target SNIR established for all the nodes is equal, and if the perfect power balancing with
ideal physical layer (no physical impairments) is assumed, it could be demonstrated that the
maximum SNIR and the transmitted power are defined by the number of OCPs in the same route.
However, when the ASE, GVD and PMD effects are considered, there is a penalty. This penalty
represents the received power reduction due to temporal spreading. Comparing Figs. 6(a) and
6(b), it could be noticed that the convergence velocity depends on the number of OCPs. The
increase of OCPs from 4 to 8 decreases the convergence velocity. This effect is directly related to
the MAI increasing, which increases with the number of OCPs. The MAI effects are strongly
influenced by the increase of the active number of OCPs; as explained before, an error occurs
when cross-correlational pulses from the (K – 1) interfering optical code paths built up to a level
higher than the autocorrelation peak, changing a bit zero to a bit one.
0 100 200 300 400 1E-5
1E-4 1E-3 0.01 0.1 1
0 100 200 300 400 1E-5
1E-4 1E-3 0.01 0.1 1
0 100 200 300 400 1E-5
1E-4 1E-3 0.01 0.1
1 Total length (km):
L1=42,1; L2=22,4 L1=62,1; L2=16,0 L1=56,6; L2=48,0 L1=73,4; L2=32,2
Po
w
e
r a
llo
ca
ti
o
n
p
e
r n
o
d
e
(
W)
(a)
(b)
Fig.6. PSO sum power evolution for a) 4 OCPs; b) 8 OCPs. Two span as reference, with bit rate of 10 and 40 Gbps with ASE, GVD and PMD effects.
0 100 200 300 400 500 600 700 800 1E-4
1E-3 0.01 0.1 1
Optimum value
(matrix inversion)
Su
m
p
o
w
e
r (
W)
Iterations
Bit rate (Gbps):
10
40
0 100 200 300 400 500 600 700 800 1E-4
1E-3 0.01 0.1 1
Optimum value
(matrix inversion)
Bit rate (Gbps):
10
40
Su
m
p
o
w
e
r (
W)
In OCDM/WDM networks, the OCPs with various classes of QoS are obtained with transmission of
different power levels. Distinct power levels are obtained with adjustable transmitters and it does not
cause the change of the bit rate. The intensity of the transmitted optical signal is directly adjusted
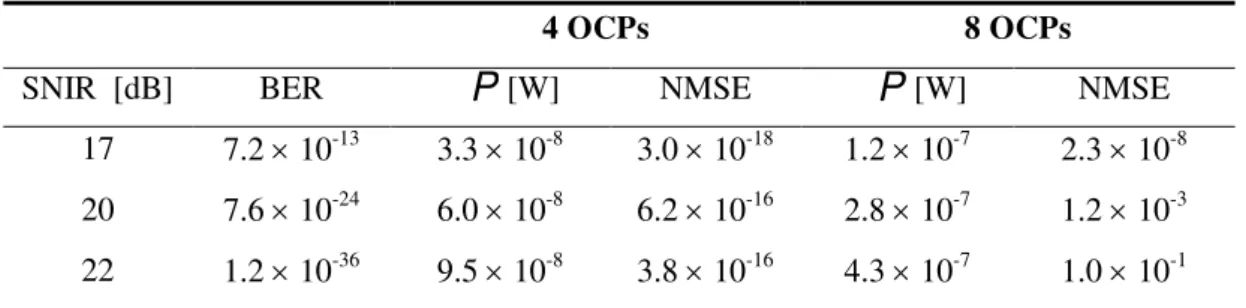
from the laser source with respect to the target SNIR after PSO algorithm convergence. Table I shows
the optimization aspects of QoS regarding different levels of SNIR considering sum power (
S
P
) andNMSE for 4 and 8 OCPs with 1 span and ASE impairment (low PMD fiber).
Table I. Optimization aspects of QoS.
4 OCPs 8 OCPs
SNIR [dB] BER
S
P
[W] NMSES
P
[W] NMSE17 7.2 10-13 3.3 10-8 3.0 10-18 1.2 10-7 2.3 10-8
20 7.6 10-24 6.0 10-8 6.2 10-16 2.8 10-7 1.2 10-3
22 1.2 10-36 9.5 10-8 3.8 10-16 4.3 10-7 1.0 10-1
The results in Table I show the necessary values for transmitted power, as well as the solution
quality evaluation in terms of NMSE. The target SNIR improvement implies increasing the
transmitted power, which is more influential for more OCPs. On the other hand, the solution quality
(NMSE) decreases with the increase of SNIR target, since the number of the PSO iterations has been
fixed.
IV. CONCLUSIONS
In this contribution, optimization procedures based on particle swarm intelligence have been
investigated in details, aiming to efficiently solve the optimal resource allocation for the
signal-to-noise plus interference ratio (SNIR) optimization of optical code paths (OCPs) from WDM/OCDM
considering imperfections on physical layer. The SNIR model considers multiple access interference
(MAI) between the OCP based on 2-D codes (time/wavelength), amplifier spontaneous emission
(ASE) at cascaded amplified spans, group velocity dispersion (GVD), as well as polarization mode
dispersion (PMD) effects. The features of the optimization algorithm based on particle swarm
intelligence (PSO) are attractive due their performance-complexity tradeoff and fairness regarding
other optimization methods that use numerical methods, matrix inversion or even other heuristic
approaches. The resource allocation optimization based on PSO strategy allows dynamically the
regulation of the transmitted power and the number of active OCPs in order to maximize the
aggregate throughput of the WDM/OCDM networks. The numerical results have shown a penalty
when the ASE, GVD and PMD effects are considered. This penalty represents the received power
reduction due to temporal spreading. Indeed, when the ASE, GVD and PMD effects are considered in
the model of the optical network, the power penalty increases substantially when the number of OCPs
and/or bit rate grow.
The authors would like to express gratitude to the Associate Editor and anonymous reviewers for
their invaluably constructive suggestions and helpful comments, which have enhanced the readability
and quality of the manuscript. This work was supported in part by the National Council for Scientific
and Technological Development (CNPq) of Brazil under Grants 202340/2011-2, and in part by
Londrina State University - Paraná (UEL).
REFERENCES
[1] H. Beyranvand and J. Salehi, “All-Optical Multiservice Path Switching In Optical Code Switched GMPLS Core
Network”, Journal of Lightwave Technology, vol. 27, no. 17, pp. 2001 – 2012, Jun. 2009.
[2] H. Yin and D. J. Richardson, Optical Code Division Multiple Access Communication Networks: Theory And
Applications. Berlin: Springer-Verlag and Tsinghua University Press, 2009.
[3] Camille-Sophie Brès and Paul R. Prucnal, “Code-Empowered Lightwave Networks”, J. Lightw. Technol., vol. 25, n. 10, pp. 2911 – 2921, Oct. 2007.
[4] F. R. Durand and T. Abrão, “Distributed SNIR Optimization Based on the Verhulst Model in Optical Code Path Routed
Networks With Physical Constraints”, Journal of Optical Communications and Networking, vol. 3, no. 9, pp. 683–691,
Sep. 2011. DOI:10.1364/JOCN.3.000683
[5] Q. Zhu. and L. Pavel, “Enabling Differentiated Services Using Generalized Power Control Model in Optical
Networks”, IEEE Transactions on Communications, vol. 57, no 9, p. 1 – 6, Sept. 2009.
[6] F. R. Durand, M. S. Filho and T. Abrão, “The Effects Of Power Control On The Optical CDMA Random Access
Protocol”, Optical Switching and Networking, (In press). DOI:10.1016/j.osn.2011.06.002
[7] L. Pavel, “OSNR Optimization In Optical Networks: Modeling And Distributed Algorithms Via A Central Cost
Approach,” IEEE J. Sel. Areas Commun., vol. 24, no. 4, pp. 54–65, Apr. 2006.
[8] N. Tarhuni, T. Korhonen, M. Elmusrati, and E. Mutafungwa, “Power Control Of Optical CDMA Star Networks,” Opt. Commun., vol. 259, pp. 655–664, Mar. 2006.
[9] M. Tang, C. Long and X. Guan, “Nonconvex Optimization for Power Control in Wireless CDMA Networks,” Wireless Personal Communications, vol. 58, n. 4, pp. 851-865, 2011.
[10]F. R. Durand, M. Lima and E. Moschim, “Impact of PMD on Hybrid WDM/OCDM Networks,” IEEE Photonics
Technology Letters, vol. 17, no. 12, pp. 2787–2789, December 2005.
[11]F R. Durand, L. Galdino, L. H. Bonani, F. R. Barbosa, M. L. F. Abbade and Edson Moschim, “The Effects of Polarization Mode Dispersion on 2D Wavelength-Hopping Time Spreading Code Routed Networks”, Photonics
Network Communications, vol. 20, no. 1, pp. 27 – 32, Aug. 2010. DOI 10.1007/s11107-010-0242-6.
[12]F. R. Durand, M. L. F. Abbade, F. R. Barbosa, and E. Moschim, “Design of Multi-Rate Optical Code Paths Considering Polarisation Mode Dispersion Limitations,” IET Communications, vol. 4, no. 2, pp. 234–239, Jan. 2010.
[13]A. L. Sanches, J. V. dos Reis Jr., and B.-H. V. Borges, “Analysis of High-Speed Optical Wavelength/Time CDMA Networks Using Pulse-Position Modulation And Forward Error Correction Techniques,” J. Lightwave Technol., vol. 27, no. 22, pp. 5134–5144,Nov. 2009.
[14]J. Poirrier, M. Gadonna and L. Dupont, “PMD Effects in Fiber Optic Transmission Systems”, Fiber and Integrated
Optics, vol. 27, no. 6, pp. 559–578, 2008.
[15]S. Lanne and E. Corbel, “Practical Considerations for Optical Polarization-Mode Dispersion Compensators”, Journal of
Lightwave Technology, vol. 22, no. 4, April 2004.
[16]B.-J. Y. Y. Zheng and X.-G. Zhang, “Analytical theory for pulse broadening induced by all-order polarization mode dispersion combined with frequency chirp and group-velocity dispersion,” Opt. Quantum Electron., vol. 35, no. 7, pp. 725–734, Jan. 2003.
[17]G. Pavani, L. Zuliani, H. Waldman, and M. Magalhães, “Distributed Approaches For Impairment-Aware Routing And Wavelength Assignment Algorithms in GMPLS Networks,” Comput. Netw., vol. 52, no. 10, pp. 1905–1915, July 2008. [18]J. Kennedy and R.C. Eberhart, “Particle Swarm Optimization”. IEEE Intern. Conf. on Neural Networks, Piscataway,
USA, pp. 1942–1948, 1995.
[19]N. Nedjah and L. Mourelle, Swarm Intelligent Systems, Springer, Springer-Verlag Berlin, Heidelberg, 2006.
[20]T. Abrão, L. D. Sampaio, M. Proença Jr., B. A. Angélico and Paul Jean E. Jeszensky, Multiple Access Network Optimization Aspects via Swarm Search Algorithms, In: Nashat Mansour. (Org.). Search Algorithms and Applications. 1 ed. Vienna, Austria: InTech, ISBN 978-953-307-156-5, 2011, v. 1, p. 261-298.
[21]K. Zielinski, P. Weitkemper, R. Laur, and K. Kammeyer, “Optimization of Power Allocation for Interference
Cancellation With Particle Swarm Optimization”, IEEE Transactions on Evolutionary Computation, vol. 13, no. 1, pp.
128 – 150, Feb. 2009.
[22]N. Nedjah and L. M. Mourelle. Swarm Intelligent Systems, Springer, Springer-Verlag Berlin Heidelberg, 2006. [23]A. Chatterjee and P. Siarry, Nonlinear Inertia Weight Variation for Dynamic Adaptation in Particle Swarm
Optimization, Computers & Operations Research, vol33, no. 3, pp. 859–871.
[24]M. Moustafa, I. Habib, and M. Naghshineh, Genetic Algorithm for Mobiles Equilibrium, MILCOM’00. 21st Century
Military Communications Conference, 2000.
[25]H. Elkamchouchi, H., EIragal and M. Makar, Power Control in CDMA System using Particle Swarm Optimization,