CLINICAL SCIENCE
Plasma kinetics of an LDL-like nanoemulsion and lipid
transfer to HDL in subjects with glucose intolerance
Marina P. Bertato,I,IICarolina P. Oliveira,I,IIBernardo L. Wajchenberg,I,IIAntonio C. Lerario,I,IIRaul C. Maranha˜oI,IIIIFaculdade de Medicina da Universidade de Sa˜o Paulo, Heart Institute (InCor), Sa˜o Paulo/SP, Brazil.IIFaculdade de Medicina da Universidade de Sa˜o Paulo,
Endocrinology Service, Sa˜o Paulo/SP, Brazil.IIIUniversidade de Sa˜o Paulo, School of Pharmaceutical Sciences, Sa˜o Paulo/SP, Brazil.
OBJECTIVE: Glucose intolerance is frequently associated with an altered plasma lipid profile and increased cardiovascular disease risk. Nonetheless, lipid metabolism is scarcely studied in normolipidemic glucose-intolerant patients. The aim of this study was to investigate whether important lipid metabolic parameters, such as the kinetics of LDL free and esterified cholesterol and the transfer of lipids to HDL, are altered in glucose-intolerant patients with normal plasma lipids.
METHODS:Fourteen glucose-intolerant patients and 15 control patients were studied; none of the patients had cardiovascular disease manifestations, and they were paired for age, sex, race and co-morbidities. A nanoemulsion resembling a LDL lipid composition (LDE) labeled with 14C-cholesteryl ester and 3H-free cholesterol was intravenously injected, and blood samples were collected over a 24-h period to determine the fractional clearance rate of the labels by compartmental analysis. The transfer of free and esterified cholesterol, triglycerides and phospholipids from the LDE to HDL was measured by the incubation of the LDE with plasma and radioactivity counting of the supernatant after chemical precipitation of non-HDL fractions.
RESULTS: The levels of LDL, non-HDL and HDL cholesterol, triglycerides, apo A1 and apo B were equal in both groups. The 14C-esterified cholesterol fractional clearance rate was not different between glucose-intolerant and control patients, but the 3H-free- cholesterol fractional clearance rate was greater in glucose-intolerant patients than in control patients. The lipid transfer to HDL was equal in both groups.
CONCLUSION: In these glucose-intolerant patients with normal plasma lipids, a faster removal of LDE free cholesterol was the only lipid metabolic alteration detected in our study. This finding suggests that the dissociation of free cholesterol from lipoprotein particles occurs in normolipidemic glucose intolerance and may participate in atherogenic signaling.
KEYWORDS: Insulin Resistance; Cholesterol; Emulsions; Nanoparticles; Lipoproteins.
Bertato MP, Oliveira CP, Wajchenberg BL, Lerario AC, Maranha˜o RC. Plasma kinetics of an LDL-like nanoemulsion and lipid transfer to HDL in subjects with glucose intolerance. Clinics. 2012;67(4):347-353.
Received for publication onOctober 7, 2011;First review completed onNovember 19, 2011;Accepted for publication onDecember 21, 2011 E-mail: [email protected]
Tel.: 55 11 2661-5951
INTRODUCTION
Insulin resistance, which leads to common disorders such as glucose intolerance (GI), metabolic syndrome and type 2 diabetes, affects glucose homeostasis and the regulation of plasma lipids (1,2). Dyslipidemia that results from insulin resistance leads to the development of cardiovascular disease not only in overt type 2 diabetes patients but also in subjects with GI (2). Interestingly, the odds ratio for cardiovascular disease in GI patients approaches that estimated for type 2 diabetes patients (3). Characteristically, dyslipidemia
associated with insulin resistance consists of hypertriglycer-idemia and decreased HDL cholesterol levels. LDL choles-terol levels are not usually elevated, and LDL plasma kinetics may be normal in type 2 diabetes. Kinetic studies have been performed by radioactive or stable isotope labeling of apo B100, which is the only LDL protein (4-8). However, alterations in LDL metabolism may occur in the lipid part of the lipoprotein because insulin resistance causes changes in the LDL subfraction profile, with an increase in the more atherogenic small-dense LDL subfraction (9).
LDL contains both unesterified and esterified cholesterol. Each of these forms of cholesterol has distinct physical chemical and metabolic properties, and their status in the plasma has not been explored in metabolic diseases affecting plasma lipids. Esterified cholesterol is located in the lipoprotein core, wherefrom it can be dislocated only by the action of transfer proteins. Unesterified cholesterol located in the lipoprotein surface is a more unstable form of cholesterol.
Copyrightß2012CLINICS– This is an Open Access article distributed under
the terms of the Creative Commons Attribution Non-Commercial License (http:// creativecommons.org/licenses/by-nc/3.0/) which permits unrestricted non-commercial use, distribution, and reproduction in any medium, provided the original work is properly cited.
Cholesteryl ester transfer protein (CETP) and phospholi-pid transfer protein (PLTP) promote liphospholi-pid transfer among lipoprotein classes, including cholesterol, phospholipids and triglycerides. These lipid transfers are crucial for the formation and metabolism of HDL in the plasma and are part of the reverse cholesterol transport. Free cholesterol transferred to HDL undergoes esterification by lecithin-cholesterol acyltransferase (LCAT) using apo A1, which is the main HDL apolipoprotein, as a co-factor (10,11).
This study aimed to investigate whether insulin resistance affects the plasma kinetics of lipoprotein free and esterified cholesterol and the transfer of both cholesterol forms, phospholipids and triglycerides to HDL, even in the absence of altered plasma lipids. GI patients with normal lipid plasma levels were studied to determine whether these parameters could indicate the existence of metabolic alterations. An artificial nanoemulsion that mimicked the LDL structure was used to probe the intravascular metabolism of LDL cholesterol (12) and also as a lipid donor to HDL (13) for the in vitro evaluation of the lipid transfer.
MATERIALS AND METHODS
Subjects
In total, 14 GI individuals and 15 healthy controls, all without clinical manifestations of cardiovascular disease, were recruited at the Medical School Hospital of the University of Sa˜o Paulo and from the an outpatient clinic of the Heart Institute, and they were paired for age, sex, race and co-morbidities. All of the patients were submitted to an electrocardiogram exercise stress test to evaluate the presence of cardiovascular disease. A negative result indicated an absence of cardiovascular disease. The electrocardiogram exercise stress test adopted was the Bruce protocol with a MAT 2100 treadmill coupled with an ML 800 Stress Test System (Fukuda Denshi Co., Ltd). The electrocardiographic recordings of 15 simultaneous leads, with 12 classic deriva-tions of the Mason - Likar system and 3 leads of the Frank orthogonal system (X,Y,Z), were obtained.
All patients were submitted to an oral glucose tolerance test (OGTT) that was performed at 120 min after the patients drank the glucose solution. According to the American Diabetes Association criteria (14), GI patients exhibited normal 2 h plasma glucose levels (7.8-11.1 mmol/L; n = 4) or impaired fasting glucose levels ($5.5 mmol/L; n = 10). The control group had 2 h plasma glucose ,7.8 mmol/L and fasting blood glucose,5.5 mmol/L.
None of the participants had liver or renal dysfunction as evaluated by clinical and laboratory criteria. None had inflammatory, neoplastic or pulmonary disease, chronic renal disease (creatinine .1.5 mg/dL), asthma, cardiovas-cular disease, peripheral arterial disease or a previous stroke. The patients were evaluated by cardiologists to detect issues related to coronary heart disease (e.g., angina, dyspnea, palpitations). No patient was taking metformin, glucocorticoids or any medication known to affect lipid metabolism.
The inclusion criteria were as follows: age between 40 and 70 years; total cholesterol,6 mmol/L; LDL-C,4 mmol/L; triglycerides ,2.2 mmol/L; normal blood pressure or treated hypertension up to 130/85 mmHg; and thyroid function within the normal range or compensated with thyroid replacement therapy.
Cases and controls did not differ regarding the frequency of arterial hypertension (8 in GI vs. 5 in controls,p= 0.27); family history of cardiovascular disease (7 vs. 5,p= 0.46); family history of type 2 diabetes (8 vs. 4,p= 0.13); current smoking (1 vs. 1,p= 1.00); hypothyroidism (2 vs. 4,p= 0.65); and current medications such as angiotensin-converting enzyme inhibitors (5 vs. 3,p= 0.42), angiotensin II receptor blockers (1 vs. 2,p= 1.00), calcium channel blockers (1 vs. 3,
p= 0.59), thiazides (6 vs. 3,p= 0.24) and levothyroxine (3 vs. 4, p= 1.00). The characteristics of the study patients are described in Table 1.
Ethics
The human experimental protocol was approved by the institutional review boards of the Medical School Hospital of the University of Sa˜o Paulo and was in accordance with the Helsinki Declaration of 1975, as revised in 1983. All participants provided written informed consent.
Laboratory assays
Blood samples for the determination of laboratory para-meters were collected after fasting for 12 h and on the same day the kinetic study was performed. Commercial enzymatic colorimetric methods were used for the determination of total cholesterol, triglycerides and HDL-C. LDL cholesterol was calculated using a direct method (kinetic automatized). Plasma apo A1 and apo B were assayed by turbidimetry (Roche/Hitachi, Roche Diagnostics, Mannheim, Germany),
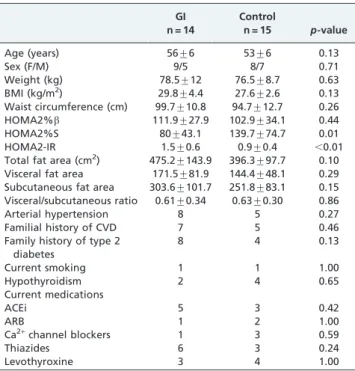
Table 1 -Physical characteristics and current medications of the glucose-intolerant (GI) group and the control group.
GI n = 14
Control
n = 15 p-value
Age (years) 56¡6 53¡6 0.13
Sex (F/M) 9/5 8/7 0.71
Weight (kg) 78.5¡12 76.5¡8.7 0.63
BMI (kg/m2) 29.8¡4.4 27.6¡2.6 0.13
Waist circumference (cm) 99.7¡10.8 94.7¡12.7 0.26
HOMA2%b 111.9¡27.9 102.9¡34.1 0.44
HOMA2%S 80¡43.1 139.7¡74.7 0.01
HOMA2-IR 1.5¡0.6 0.9¡0.4 ,0.01
Total fat area (cm2) 475.2¡143.9 396.3¡97.7 0.10
Visceral fat area 171.5¡81.9 144.4¡48.1 0.29 Subcutaneous fat area 303.6¡101.7 251.8¡83.1 0.15 Visceral/subcutaneous ratio 0.61¡0.34 0.63¡0.30 0.86
Arterial hypertension 8 5 0.27
Familial history of CVD 7 5 0.46
Family history of type 2 diabetes
8 4 0.13
Current smoking 1 1 1.00
Hypothyroidism 2 4 0.65
Current medications
ACEi 5 3 0.42
ARB 1 2 1.00
Ca2+channel blockers 1 3 0.59
Thiazides 6 3 0.24
Levothyroxine 3 4 1.00
and apo E was measured by nephelometry. HbA1C was measured by HPLC (National Glycohemoglobin Standar-dization Program (NGSP), USA; normal range 4.1 to 6%). Plasma insulin was measured by an enzyme-linked immuno-sorbent assay (AutoDELFIA, Perkin-Elmer Life Science, Wallac, Oy, Finland) with an intra-assay coefficient of variation of ,1.5%. The plasma glucose concentration was measured using a hexokinase method.
Insulin resistance
The fasting plasma glucose (mmol/L) and insulin (rmol/ L) values were used to evaluate insulin resistance via the Homeostasis Model Assessment (HOMA), which is a mathematical model for defining insulin secretion by pancreatic b cells (HOMA2-%b) and insulin sensitivity (HOMA2-%S) as percentages of normal values and the index of insulin resistance (HOMA2-IR). This model was implemented using the HOMA Calculator Version 2.2.2 software, which was developed by The Oxford Center for Diabetes, Endocrinology & Metabolism (Diabetes Trial Unit, HOMA Calculator; available at http://www.dtu.ox.ac.uk) (15).
Computerized tomography of the abdomen
The abdominal fat distribution was evaluated by compu-terized tomography (CT) of the abdomen without oral or intravenous contrast or any previous preparation of the patients. The examination was performed at the Institute of Radiology of the Medical School Hospital using a high-speed CT (GE). The initial image acquisition was used as the ‘‘scout’’ (digital radiology) for the patient profile. A single CT image with a thickness of 10 mm was obtained in the median of the disc space of L4-L5, guided by the previously obtained ‘‘scout’’. The visceral and subcutaneous fat areas were calculated in the CT image. The limits of the fat component were calculated using the upper limit of -50 Hounsfield units and the lower limit of -250 Hounsfield units as the attenuation values to determine the presence of fat in the bound area. The ratio of the visceral and subcutaneous fat areas was also calculated (16).
LDE preparation
The LDE was prepared from a lipid mixture composed of 40 mg cholesteryl oleate, 20 mg egg phosphatidylcholine, 1 mg triolein and 0.5 mg cholesterol purchased from Sigma Chemical, USA. 14C-cholesteryl oleate and 3H-cholesterol were purchased from Perkin-Elmer, USA, and added to the mixture. The emulsification of the lipids by prolonged ultrasonic irradiation in aqueous media and the two-step ultracentrifugation of the crude emulsion with density adjustment by the addition of KBr to obtain the LDE were performed as described by Maranha˜o et al. (17). The final lipid composition of the LDL-like LDE was 64% phospho-lipids, 33% cholesteryl oleate, 2% triacylglycerols and 1% cholesterol. The LDL-like LDE was dialyzed against a saline solution and sterilized by passage through a 0.22-mm filter before injection into the patients. The entire LDE prepara-tion procedure was performed under laminar flow. All glassware used in this study was made pyrogen-free by exposure to dried steam at 180
˚
C for 2 h and sterilized by wet steam at 120˚
C for 30 min. All plastic materials were sterilized by ultraviolet light exposure.Plasma kinetics study protocol
As previously indicated, the study patients were asked to arrive at the laboratory at 7 a.m., after a 12-h fasting period. Blood samples were collected as described previously for the determination of basal blood parameter levels. The LDE labeled with 14C-cholesteryl oleate (37kBq) and 3H-free cholesterol (74 kBq) was injected intravenously in a bolus of 5-6 mg of total lipids in a 500-mL volume. Blood samples were obtained over 24 h (5 min, 1 h, 2 h, 4 h, 6 h, 8 h and 24 h). The subjects were allowed to eat low-fat meals on the evening before the test day, after the first blood collection and at about 1500 p.m. because low-fat meals do not
interfere with the plasma removal of LDE (17). The plasma samples were separated by centrifugation, and 1 mL of each sample was transferred to a counting vial containing 5 mL of scintillation solution. The samples were then counted in a scintillation counter (1600 TR model, Hewlett-Packard, Palo Alto, CA).
Estimation of the fractional clearance rate of the radioisotopes
The fractional clearance rates (FCRs) of 14C-cholesteryl
ester and3H-free cholesterol from the LDE were calculated
according to the method described by Couto et al. (18). FCR = (a1/b1+a2/b2)21, where a1, a2, b1 and b2 were estimated from biexponential curves obtained from the remaining radioactivity found in the plasma after injection and fitted by least squares procedure as y = a1e-b1t
+a2e-b2t,
where y is the curve of the radioactivity plasma decay as a function of time (t); a indicates the linear coefficient and b is the angular coefficient, which represents the FCR (h-1).
Calculations were performed using ANACOMP computer software (19). The compartmental model is illustrated in Figure 1.
In vitrolipid transfer from LDE to HDL
The assay to estimate the lipid transfer of3H-cholesteryl oleate, 14C-phosphatidylcholine, 3H-triolein and 14C-free cholesterol from the LDE to HDL was performed as described by Lo Prete et al. (13). The assay is based on a 1-h incubation of the LDE with whole plasma, followed by the measurement of the radioactivity in the supernatant after the chemical precipitation of the non-HDL lipoprotein fractions and of the LDE. The safety of the radioactive dose intravenously injected into the patients was assured according to the regulations of the International Comm-ission on Radiological Protection (20). The injected dose in each experiment was 0.03 mSV.
Statistical analysis
RESULTS
GI patients and controls did not differ regarding the area of total abdominal fat (p= 0.10) or visceral (p= 0.29) and subcutaneous fat (p= 0.15) as evaluated by abdominal CT (Table 1).
There was no difference between GI patients and controls with respect to b cell insulin secretion as indicated by HOMA2%b(p= 0.44) (Table 1). The fasting insulin concen-tration (p,0.01) and the insulin resistance index (p,0.01) were higher in the GI patients than in controls (Table 1 and Table 2). As expected, compared with controls, the GI subjects had lower insulin sensitivity as expressed by HOMA2%S (p= 0.01).
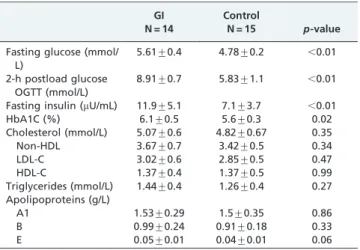
The plasma biochemical parameters of the study groups are shown in Table 2. The concentrations of total, LDL, non-HDL and non-HDL cholesterol and triglycerides were similar in GI patients and controls. Similarly, apo A1 and apo B did not differ between the two groups. Apo E tended to be lower in GI patients than in controls, but this difference did not attain statistical significance (p= 0.06).
The plasma decay curves of both LDE labels are shown in Figure 2. The cholesteryl ester curves of GI patients and control subjects were equal (Figure 2A), as confirmed by the cholesteryl ester FCR shown in Table 3. However, the free cholesterol curve (Figure 2B) was faster in GI patients than in controls, as confirmed by a greater free cholesterol FCR (p= 0.04) (Table 3).
Table 4 shows the results of thein vitrotransfer of the four radioactive lipids from the donor LDE to the HDL fraction
after incubation of the LDE with whole plasma. GI patients did not show differences in the transfer of lipids compared with the control group.
Correlations were found between free cholesterol FCR and LDL cholesterol (r = -0.53,p= 0.04) and apo E (r = -0.55,
p= 0.03); between phospholipid transfer to HDL and LDL cholesterol (r = 0.57, p= 0.03) and apo B (r = 0.64, p= 0.01); between triglyceride transfer to HDL and fasting insulin (r = -0.55,p= 0.03), insulin sensitivity (r = 0.53,p= 0.04) and insulin resistance (r = -0.53, p= 0.04); and between free cholesterol transfer to HDL and LDL cholesterol (r = -0.55,
p= 0.04), HDL cholesterol (r = 0.54,p= 0.04), plasma trigly-cerides (r = -0.76,p,0.01), apo B (r = -0.70,p,0.01) and apo E (r = -0.58,p= 0.02).
DISCUSSION
The stable isotope method traces the kinetics of the protein component of lipoproteins. Alternatively, the radio-active nanoemulsion method used here traces the kinetics of the lipid components. When the LDE is injected into the bloodstream, it acquires apo E from the native lipoproteins and binds to LDL receptors that recognize both apo B and apo E (17,21). Because apo E has greater affinity for the LDL receptor than apo B, the LDE is removed more quickly from the plasma compartment than native LDL. This effect is advantageous because it shortens the observation time required (17,21,22). This method was validated in several experimental (17,23) and clinical studies (12,18,24-26), in which the kinetic behavior of the nanoemulsion was similar to that expected from native LDL.
The interpretation of plasma removal data after a bolus injection is straightforward. In addition, a single preparation can be used in several subjects, and the radioactive dose is very low, in accordance with the radiological protection international standards.
Using the LDE approach, we showed that the cholesteryl ester moiety is cleared equally in GI and control patients. Because the cholesteryl ester is less prone to dissociate from LDE particles (i.e., it can only be dissociated through CETP activity), it may be used an approximate marker of the plasma removal of the nanoemulsion particles. This
Figure 1 -Compartmental model used to analyze the LDE14
C-cholesteryl ester (CE) and 3H-free cholesterol (FC). The model
consists of four discrete compartments: two for14C-CE and two
for3H-FC. All compartments are in the intravascular space (1CE,
2CE, 1FCand 2FC). LDE14C-CE and3H-FC are injected intravenously
in a bolus (arrow with asterisk) into compartments 1CEand 1FC,
respectively. Fractions k1,0CE and k1,0FC of the labeled lipids are
removed to the extravascular space. Fractions k1,2CE and k1,2FC
of the injected lipids are converted into compartments 2CEand
2FCbecause of the incorporation of apolipoproteins available in
the plasma. Subsequently, the materials of those compartments are transferred to the extravascular space following the k2,0CE
and k2,0 FC routes. The samplings, represented by triangles,
correspond to the indiscriminate combination of compartments 1 and 2.
Table 2 -Serum biochemical parameters of the glucose-intolerant (GI) group and the control group.
GI N = 14
Control
N = 15 p-value
Fasting glucose (mmol/ L)
5.61¡0.4 4.78¡0.2 ,0.01
2-h postload glucose OGTT (mmol/L)
8.91¡0.7 5.83¡1.1 ,0.01
Fasting insulin (mU/mL) 11.9¡5.1 7.1¡3.7 ,0.01
HbA1C (%) 6.1¡0.5 5.6¡0.3 0.02
Cholesterol (mmol/L) 5.07¡0.6 4.82¡0.67 0.35
Non-HDL 3.67¡0.7 3.42¡0.5 0.34
LDL-C 3.02¡0.6 2.85¡0.5 0.47
HDL-C 1.37¡0.4 1.37¡0.5 0.99
Triglycerides (mmol/L) 1.44¡0.4 1.26¡0.4 0.27 Apolipoproteins (g/L)
A1 1.53¡0.29 1.5¡0.35 0.86
B 0.99¡0.24 0.91¡0.18 0.33
E 0.05¡0.01 0.04¡0.01 0.06
assumption is corroborated by the transfer assay (Table 4), which showed that the shift of cholesteryl esters from the nanoemulsion to HDL is small: 3.6%, compared with roughly 10% for free cholesterol and 22% for phospholipids. LDL removal with radiolabeled apo B from the plasma of subjects with GI has not been described in the literature. In
subjects with metabolic syndrome (4,27,28) or obesity (5), which are conditions in which insulin resistance is presumptively involved, LDL apo B plasma removal was found to be slower than in control subjects. However, the participants of those studies had elevated LDL cholesterol and triglyceride levels (4,27,28) whereas our GI patients did not.
An important finding of this study was the fact that the free cholesterol component of the LDE was removed more quickly in GI patients than in controls. This finding suggests that in GI patients, the unesterified cholesterol may dissociate from the surface of the lipoprotein particles and was independently and more rapidly cleared from the
Figure 2 -Decay curves of the LDE14C-cholesteryl ester (a) and3H-free cholesterol (b) obtained from the glucose-intolerant (GI) and the
control group. Double-labeled LDE was intravenously injected in a bolus, and blood samples were drawn in pre-established intervals over 24 h for measurement of the radioactivity in the scintillation solution. Data are presented as the % of the radioactivity counting considering the first point as 100% and are expressed as the means¡SD. Black squares: GI group; white squares: control group.
Table 3 -Fractional clearance rate (FCR) and kinetic parameters of LDE14C-cholesteryl ester and3H-free
cholesterol in the glucose-intolerant group (GI) and in the control group.
GI n = 14
Control
n = 15 p-value
FCR14C-CE 0.05¡0.01 0.05¡0.01 0.40
k1.014C-CE 0.26¡0.18 0.24¡0.23 0.48
k1.214C-CE 0.33¡0.17 0.59¡0.61 0.19
k2.014C-CE 0.04¡0.01 0.06¡0.07 0.96
FCR3H-FC 0.06¡0.02 0.04¡0.02 0.04
k1.03H-FC 0.54¡0.35 0.66¡0.24 0.34
k1.23H-FC 0.48¡0.19 0.44¡0.21 0.62
k2.03H-FC 0.05¡0.10 0.02¡0.01 0.01
Data are expressed as the means¡SD. Student’st-test and unpaired Mann-Whitney test. FCR: fractional clearance rate; CE: cholesteryl ester; FC: free cholesterol; k1,0: kinetic parameters for the removal of lipids from
the intravascular compartment; k1,2: kinetic parameters that receive
apolipoproteins from the intravascular compartment; k2,0: kinetic
parameters for the removal of the LDL-like nanoemulsion attached to the apolipoproteins from the intravascular compartment; SD: standard deviation.
Table 4 -In vitrolipid transfers from the LDE to the HDL fraction in the glucose-intolerant group (GI) and in the control group (measured as the % of the total
radioactivity of each LDE lipid incubated with whole plasma and recovered after 1 h in the HDL fraction).
LDE lipid transfer to HDL
Gl n = 14
Control
n = 15 p-value
Cholesteryl esters 3.5¡0.4 3.6¡0.6 0.63
Phospholipids 21.6¡1.1 22.2¡1.2 0.19
Triglycerides 7.0¡2.1 6.1¡1.3 0.15
Free cholesterol 9.2¡1.1 9.9¡2.0 0.29
Data are expressed as the means¡SD. Student’st-test and unpaired Mann-Whitney test.
circulation. However, the cholesteryl esters persisted in the core of the LDE particles.
In a previous study (29), we identified a similar kinetic behavior for LDE unesterified and esterified cholesterol in normocholesterolemic patients with coronary heart disease. Upon injection of the LDE, free cholesterol was removed faster in diseased patients than in controls (29). The association of this behavior with coronary heart disease suggests that free cholesterol may desorb from LDE particles and deposit in the arteries (12). In this respect, after the injection of the LDE into patients with coronary heart disease that were scheduled for revascularization surgery, there was proportionally more free than esterified cholesterol in the fragments of the vessels discarded during the surgery (18). This result supports the hypothesis that after shifting from LDE particles, free cholesterol precipi-tates in the vessels and will eventually disturb endothelial homeostasis, which is a primordial triggering mechanism in atherogenesis.
The lipid transfer process is dependent upon the HDL composition and therefore may affect the adhesion of proteins to the lipoprotein surface. Thus, the function of HDL in not only reverse cholesterol transport but also other atheroprotective functions, such as the antioxidant, anti-inflammatory, anti-apoptotic, vasodilatory, antithrombotic and anti-infectious activity, may be affected by this process (30).
Low HDL cholesterol is a marker of metabolic syndrome and may also be diminished in GI patients (31), although normal levels have also been described (32-35). In our GI patients, HDL was within the normal range and did not differ from the levels in the control subjects. Furthermore, we found no difference between GI patients and the controls with respect to thein vitrotransfer of the four LDE labeled lipids to HDL. In GI, as in type 2 diabetes, the action of CETP was found to be enhanced (31,33,37). However, other factors such as the normal HDL cholesterol concentration may have counteracted the eventual increase in the transfer of cholesteryl esters and triglycerides that would be facilitated by CETP (10,30).
Note that in the abovementioned studies, the levels of HDL cholesterol were lower in the experimental groups than in the controls whereas, in the present study, this parameter did not differ between groups. However, PLTP, which transfers phospholipids and also facilitates the transfer of free cholesterol, was described as normal in GI patients (36).
An interesting finding of our study was the positive correlation between the transfer of free cholesterol and the HDL levels. In contrast, the three other lipids that are more dependent on transfer proteins for transport did not correlate with the HDL levels. This finding highlights the importance of HDL for the reception of free cholesterol for subsequent esterification. Because of the importance of this lipoprotein as the main esterification site, a deficiency in free cholesterol reception when HDL levels are low may be a major mechanism that links HDL cholesterol levels and atherosclerosis (13,37,38).
In conclusion, GI subjects without dyslipidemia or clinical manifestations of cardiovascular disease had normalin vitro
transfer of lipids to HDL and removal of the LDL nanoemulsion probe from the plasma. The latter finding may account for their normal LDL cholesterol levels. Nonetheless, the GI patients exhibited an abnormal kinetic
behavior of free cholesterol that may be associated with atherogenesis. This finding is important for the under-standing of the overall role of insulin resistance in the pathophysiology of cardiovascular disease.
ACKNOWLEDGMENTS
This study was supported by Fundac¸a˜o do Amparo a` Pesquisa do Estado de Sa˜o Paulo (FAPESP), Sa˜o Paulo, Brazil. Dr. Maranha˜o has a Research Award from Conselho Nacional de Desenvolvimento Cientı´fico e Tecnolo´gico (CNPq) Brası´lia, Brazil. Dr. Bertato had a scholarship from CNPq.
AUTHOR CONTRIBUTIONS
Bertato MP was responsible for the performance of the experiments, data analysis and manuscript writing. Oliveira CP was responsible for the patients selection, performance of experiments and data analysis. Wajchenberg BL was responsible for the clinical protocol and interpreta-tion of results. Lerario AC conceived the study and was also responsible for the clinical protocol, and manuscript writing. Maranha˜o RC conceived the study, and was also responsible for the results interpretation and manuscript writing.
REFERENCES
1. Stern MP. Diabetes and cardiovascular disease. The ‘‘common soil’’ hypothesis. Diabetes. 1995;44(4):369-74.
2. Ginsberg HN, Huang LS. The insulin resistance syndrome: impact on lipoprotein metabolism and atherothrombosis. J Cardiovasc Risk. 2000; 7(5):325-31.
3. The DECODE Study Group, the European Diabetes Epidemiology Group. Glucose tolerance and cardiovascular mortality: comparison of fasting and 2-hour diagnostic criteria. Arch Intern Med. 2001;61(3):397-405.
4. Chan DC, Watts GF, Redgrave TG, Mori TA, Barrett PHR. Apolipoprotein B-100 kinetics in visceral obesity: associations with plasma apolipoprotein C-III concentration. Metabolism. 2002;51(8):1041-6, http://dx.doi.org/10.1053/meta.2002.33339.
5. Pont F, Duvillard L, Florentin E, Gambert P, Verge´s B. Early kinetic abnormalities of apo B-containing lipoproteins in insulin-resistance women with abdominal obesity. Arterioscler Thromb Vasc Biol. 2002;22(10):1726-32, http://dx.doi.org/10.1161/01.ATV.0000032134. 92180.41.
6. Kissebah AH. Low density lipoprotein metabolism in non-insulin dependent diabetes mellitus. Diabetes Metabolism Reviews. 1987;3(3):619-51, http://dx.doi.org/10.1002/dmr.5610030302.
7. Gylling H, Miettinen TA. Cholesterol absorption synthesis and LDL metabolism in NIDDM. Diabetes Care. 1997;20(1):90-5, http:// dx.doi.org/10.2337/diacare.20.1.90.
8. Parhofer KG, Barrett PHR. What we have learned about VLDL and LDL metabolism from humam kinetics studies. J Lipid Res. 2006;47(8):1620-30, http://dx.doi.org/10.1194/jlr.R600013-JLR200.
9. Taskinen MR. Diabetic dyslipidemia. Atherosclerosis. 2002;3:S47-51, http://dx.doi.org/10.1016/S1567-5688(01)00006-X.
10. Assmann G, Gotto AM Jr. HDL cholesterol and protective factors in atherosclerosis. Circulation. 2004;109(23 suppl 1):III8-14.
11. Dobiasova M, Frohlich J. Understanding the mechanism of LCAT reaction may help to explain the high predictive value of LDL/HDL cholesterol ratio. Physiol Res. 1998;47(6):387–97.
12. Santos RD, Hueb W, Oliveira AA, Ramires JAF, Maranha˜o RC. Plasma kinetics of cholesterol-rich emulsions in subjects with or without coronary artery disease. Journal of Lipid Research. 2003;44(3):464-9, http://dx.doi.org/10.1194/jlr.M200331-JLR200.
13. Lo Prete AC, Dina CH, Azevedo CH, Puk CG, Lopes NH, Hueb WA, et al. In vitro simultaneous transfer of lipids to HDL in coronary artery disease and in statin treatment. Lipids. 2009;44(10):917-24, http:// dx.doi.org/10.1007/s11745-009-3342-2.
14. ADA. American Diabetes Association: Standards of medical care in diabetes. (Position Statement). Diabetes Care. 2008;31(suppl. 1):S55-S60. 15. The Oxford Center for Diabetes, Endocrinology e Metabolism. Diabetes
Trial Unit. HOMA Calculator. Available at: http://www.dtu.ox.ac.uk. Accessed on October 14, 2008.
17. Maranha˜o RC, Cesar TB, Pedroso-Mariani SR, Hirata MH, Mesquita CH. Metabolic behavior in rats of a nonprotein microemulsion resembling low-density lipoprotein. Lipids. 1993;28(8):691-6, http://dx.doi.org/ 10.1007/BF02535988.
18. Couto RD, Dallan LA, Lisboa LA, Mesquita CH, Vinagre CG, Maranha˜o RC. Deposition of free cholesterol in the blood vessels of patients with coronary artery disease: a possible novel mechanism for atherogenesis. Lipids. 2007;42(5):411-8, http://dx.doi.org/10.1007/s11745-007-3041-9. 19. Mesquita CH. Cine´tica da LDL marcada com3H-CL e14C-CE. Ana´lise
compartimental auxiliar. Sa˜o Paulo: Instituto de Pesquisas Energ-e´ticas e Nucleares (IPEN). [Publicac¸o˜es IPEN];1994.
20. Sowby FS. Radiation protection. In: Limits for intakes of radionuclides by workers. ICRP publication 30. Part I. Pergamon, Oxford; 1984. 21. Maranha˜o RC, Garicochea B, Silva EL, Dorlhiac-Llacer P, Cadena SM,
Coelho IJ, et al. Plasma kinetics and biodistribution of a lipid emulsion resembling low-density lipoprotein in patients with acute leukemia. Cancer Res. 1994;54(17):4660-6.
22. Hirata RDC, Hirata MH, Mesquita CH, Cesar TB, Maranha˜o RC. Effects of apolipoprotein B-100 on the metabolismo of a lipid microemulsion model in rats. Biochim Biophys Acta. 1999;1437(1):53-62.
23. Maranha˜o RC, Roland IA, Toffoletto O, Ramires JA, Gonc¸alves RP, Mesquita CH, et al. Plasma kinetic behavior in hyperlipidemic subjects of a lipidic microemulsion that binds to low density lipoprotein receptors. Lipids. 1997;32(6):627-33, http://dx.doi.org/10.1007/s11745-997-0080-6. 24. Ades A, Carvalho JP, Graziani SR, Amancio RF, Souen JS, Pinotti JA, et al.
Uptake of a cholesterol-rich emulsion by neoplastic ovarian tissues. Gynecol Oncol. 2001;82(1):84-7, http://dx.doi.org/10.1006/gyno.2001.6203. 25. Hungria VT, Latrilha MC, Rodrigues DG, Bydlowski SP, Chiattone CS,
Maranha˜o RC. Metabolism of a cholesterol-rich microemulsion (LDE) in patients with multiple myeloma and a preliminary clinical study of LDE as a drug vehicle for the treatment of the disease. Cancer Chemother Pharmacol. 2004;53(1):51-60.
26. Dantas SM, Ficker ES, Vinagre CG, Ianni BM, Maraha˜o RC, Mady C. Metabolism of a lipid nanoemulsion resembling low-density lipoprotein in patients with grade III obesity. Clinics. 2010;65(1):23-7, http:// dx.doi.org/10.1590/S1807-59322010000100005.
27. Riches FM, Watts GF, Naoumova RP, Kelly JM, Croft KD, Thompson GR. Hepatic secretion of very-low-density lipoprotein apolipoprotein B-100 studied with a stable isotope technique in men with visceral obesity. Int J Obes Relat Metab Disord. 1998;22(5):414-23, http://dx.doi.org/ 10.1038/sj.ijo.0800602.
28. Chan DC, Watts GF, Ng TWK, Uchida Y, Sakai N, Yamashita S, et al. Apolipoprotein B-100 kinetics and static plasma indices of triglyceride-rich
lipoprotein metabolism in overweight men. Clinical Biochemistry. 2005; 38(9):806-12, http://dx.doi.org/10.1016/j.clinbiochem.2005.05.009. 29. Maranhao RC, Freitas FR, Strunz CM, Santos RD, Mansur AJ, Mansur
AP. Lipid transfers to HDL are predictors of precocious clinical coronary heart disease. Clin Chim Acta. 2012;413(3-4):502-5, http://dx.doi.org/ 10.1016/j.cca.2011.11.011.
30. Masson D, Jiang XC, Lagrost L, Tall AR. The role of plasma lipid transfer proteins in lipoprotein metabolism and atherogenesis. Journal of Lipid Research. 2009;Suppl:S201-S206.
31. Pietzsch J, Julius U, Hanefeld M. Metabolic basis of low high density lipoprotein in subjects with impaired glucose tolerance. Annals New York Academy of Sciences. 1999;892:323-6, http://dx.doi.org/10.1111/ j.1749-6632.1999.tb07808.x.
32. Watanabe N, Taniguchi T, Taketoh H, Kitagawa Y, Namura H, Yoneda N, et al. Elevated remant-like lipoprotein particles in impaired glucose tolerance and type 2 diabetic patients. Diabetes Care. 1999;22(1):152-6, http://dx.doi.org/10.2337/diacare.22.1.152.
33. Saydah SH, Loria CM, Eberhardt MS, Brancati FL. Subclinical states of glucose intolerance and risk of death in the U.S. Diabetes Care. 2001; 24(3):447–53.
34. Nagaretani H, Nakamura T, Funahashi T, Kotani K, Miyanaga M, Tokunaga K, et al. Visceral fat is a major contributor for multiple risk factor clustering in Japanese men with impaired glucose tolerance. Diabetes Care. 2001;24(12):2127-33, http://dx.doi.org/10.2337/ diacare.24.12.2127.
35. No´voa FJ, Boronat M, Saavedra P, D` iaz-Cremades JM, Varillas VF, La Roche F, et al. Differences in cardiovascular risk factors, insulin resistance, and insulin secretion in individuals with normal glucose tolerance and in subjects with impaired glucose regulation. Diabetes Care. 2005;28(10):2388-93, http://dx.doi.org/10.2337/diacare.28.10.2388. 36. Julius U, Dittrich M, Pietzsch J. Factors influencing the formation of small dense low-density lipoprotein particles in dependence on the presence of the metabolic syndrome and on the degree of glucose intolerance. Int J Clin Pract. 2007;61(11):1798-804, http://dx.doi.org/ 10.1111/j.1742-1241.2007.01507.x.
37. Pietzsch J, Fuecker K. Increased cholesteryl ester transfer protein activity in impaired glucose tolerance: relationship to high density lipoprotein metabolism. Croat Med J. 2003;44(2):171-7.