PANOECONOMICUS, 2014, 1, Special Issue, pp. 79-106
Received: 14 September 2013; Accepted: 16 November 2013.
UDC 336.748.12 (100) DOI: 10.2298/PAN1401079J Original scientific paper
Kosta Josifidis
Department of European Economics and Business,
Faculty of Economics Subotica, University of Novi Sad, Serbia
Emilija Beker Pucar
Department of European Economics and Business,
Faculty of Economics Subotica, University of Novi Sad, Serbia
Slađana Srdić
Department of European Economics and Business,
Faculty of Economics Subotica, University of Novi Sad, Serbia
Gabriela Ivan
Department of European Economics and Business,
Faculty of Economics Subotica, University of Novi Sad, Serbia
The authors are grateful to two ano-nymous referees, as well as the participants of 10th International Conference “Developments in Econom-ic Theory and PolEconom-icy”, for helpful and valuable comments and suggestions. Any error is responsibility of the authors.
Inflation Targeting in Advanced
vs. Emerging Economies before
and after the Crisis
Summary:Emerging economies have specificities which distance them
com-pared to advanced economies in practicing inflation targeting (IT) monetary regime. One of the main differences in performing IT in advanced compared to emerging economies is “fear of floating” problem in emerging group. However, on the road from exchange rate (ER) as a nominal anchor to IT, differences between advanced and emerging economies concerning “fear of floating” have been more or less narrowed. In this paper we are concentrated to selected aspects of ER pass-through to prices and output, as well as (in)direct monetary policy reactions to ER shocks, trying to find out is significant difference observ-able between advanced and emerging IT countries in pre-crisis period and (post)crisis period. The comparison is made on the basis of forecast error va-riance decompositions from estimated Vector Autoregression (VAR) / Vector Error Correction (VEC) models. “Fear of floating” phenomenon should not be exclusively applied to emerging economies, especially in the crisis period bur-dened with external shocks. The role of ER in IT monetary framework is streng-thened with higher internal vulnerability to ER shocks, despite the level of eco-nomic development. Advanced countries more use interest rate as an indirect way to withstand ER shocks, while emerging economies more use direct way via foreign exchange interventions to withstand the ER shocks.
Key words:Inflation targeting, Exchange rate shocks, Internal vulnerability,
Monetary response, “Fear of floating”, Advanced economies, Emerging econ-omies.
JEL: E42, F41.
Emerging economies generally have specificities which distance them compared to advanced economies in practicing inflation targeting (IT) monetary regime. Emerg-ing, including transition economies, pass-through abrupt structural changes on their development (and transition) road including raising vulnerability to external shocks as a consequence of trade and capital liberalization. While institutional aspects (above all, central bank independence, coordination of fiscal and monetary policy, transparency and responsibility of monetary authority, as well as development of financial markets) could also pose a threat to successful IT, other crucial and inherent vulnerabilities seriously aggravate the combination of flexible exchange rate (ER) arrangement and IT monetary framework in emerging economies.
institu-80 Kosta Josifidis, Emilija Beker Pucar, Slađana Srdić and Gabriela Ivan
tions, weak financial institutions including monitoring and regulations by the gov-ernment, low credibility of monetary institutions, “currency mismatching” problem, “sudden stop” problems, etc. Paul R. Masson, Miguel A. Savastano, and Sunil Shar-ma (1997), Roberto Golinelli and Riccardo Rovelli (2001), Jiri Jonas (2003), Jonas and Mishkin (2003), Mishkin (2004, 2007), Gill Hammond (2012) stress that suc-cessful IT assumes strong fiscal position, relatively low inflation, relatively predicta-ble and understandapredicta-ble monetary transmission mechanism, developed financial sys-tem including developed financial market with non-monetary government financing and developed money market providing quick effects of monetary policy instru-ments, central bank independence and clear mandate towards price stability, central bank capacity to model and predict inflation, absence of another nominal anchor (mainly ER anchor) besides inflation target, as well as transparent and responsible monetary policy.
81
Inflation Targeting in Advanced vs. Emerging Economies before and after the Crisis
it is accompanied by exchange rate appreciation and consequently worsening of cur-rent account balances. The same doubt concerning the effectiveness of IT in emerg-ing LAE could be found in Carlos A. Carrasco and Jesus Ferreiro (2011). The au-thors were concentrated to Mexico as inflation targeter, trying to reveal whether the implementation of IT (in 1999) and/or full-fledged IT (in 2001) have influenced in-flation performance in Mexico. The results indicate that economic growth wasn’t affected, although it was more stable than in the past. Albeit anchoring of inflation expectations to the inflation target represents the main contribution of IT as a mone-tary strategy, the improvements related with lower and more stable inflation in Mex-ico cannot be solely (or mainly) attributed to the adoption of IT. Nelson H. Barbosa-Filho (2008) analysed Brazilian experience with IT monetary strategy in the period 1999-2006 comparing the periods of ER targeting and IT targeting. The author re-vealed that IT was successful in reducing inflation after 1999 and 2002 currency crises mainly due to ER appreciation. Concerning the economic growth before and after IT adoption, the author stated that it was slow under IT compared to ER target-ing, although with an upward trend and smaller volatility during IT phase.
One of the main differences in performing IT monetary regime in advanced compared to emerging economies is “fear of floating” problem. Emerging economies due to inherent vulnerabilities couldn’t allow significant ER movements. “Fear of floating” is a complex problem as a combination of unofficial dollariza-tion/euroization in these economies, relatively high exchange rate (ER) pass-through to inflation and real economy, as well as already expressed external imbalances. Due to these obstacles, ER cannot fluctuate dominantly freely according to foreign ex-change market pressures. Nevertheless, there is a potential danger that ER transforms to a nominal anchor having in mind over excessive focus of monetary authorities to ER movements. The situation in which monetary authority de facto target ER and inflation rate points to dual anchor or two target coexistence. Dual targets and anc-hors complicate the performance of IT regime since, as is well known, IT assumes exclusively focus to inflation rate as a nominal anchor. This kind of hybrid regime (with two anchors and targets) could be viewed as a preparatory phase for full-fledged, strict IT or a kind of IT modality acceptable for emerging and transition economies. It could be considered that hybrid monetary concept, as a matter of fact, is a type of IT typical for emerging and transition economies in which macroeconom-ic circumstances don’t allow strmacroeconom-ict IT framework. The nature of IT in emerging and transition economies was investiged by Joshua Aizenman, Michael Hutcchison, and Ilan Noy (2011). The authors estimated panel data for 16 emerging IT countries in the period 1989-2006. According to key findings, authors concluded that emerging IT countries doesn’t follow “pure” IT strategy since external variables play an impor-tant role in the policy rule having in mind systematic response to the real ER. This kind of strategy, marked as “mixed strategy”, focuses both variables inflation and real exchange rate. Although monetary response to real ER was more constrained in IT compared to non-IT countries, the authors found stronger response in those IT countries with high concentration in commodity exports.
sub-82 Kosta Josifidis, Emilija Beker Pucar, Slađana Srdić and Gabriela Ivan
period) and (post)crisis period (second sub-period) trying to shed some light to the differences between emerging (EEE and Latin American Economies (LAE) emerg-ing groups) and advanced IT economies which pioneered with IT framework. The comparison is based on differences in ERPT to inflation and output variations, as well as monetary response to ER shocks according to revealed internal vulnerability.
The paper is structured in the following way. Section 1 explains specificities of IT in emerging economies with the special focus to the role of an ER in IT frame-work. Section 2 deals with methodology issues, namely, country sample, time series, sub-periods and empirical procedure. Section 3 presents the discussion of key find-ings, i.e. vulnerability of selected countries to ER shocks (ERPT to consumer prices and industrial production) and monetary policy response to ER shocks (the extent of “fear of floating”). Section 4 reveals concluding remarks.
1. Inflation Targeting in Emerging Economies: The Role of an
Exchange Rate
The potential danger in practicing IT monetary strategy in emerging economies ex-ists when ER depreciations must be limited due to macroeconomic fragility to exter-nal shocks (foreign demand fall, drop in export prices, sudden capital outflows, etc). In such situations, ER depreciations could threat inflation target, as a primary goal in IT framework, or financial stability having in mind burdened debt servicing in the case of unofficial financial dollarization/euroization. Therefore, the question is could monetary authorities in these circumstances allow relatively free ER fluctuations? If the answer is no, then the main argument in favor of flexible ER (ER as a shock ab-sorber) has been lost. Crucial limits for relatively free ER fluctuations and narrowed maneuver space for monetary policy in emerging economies are stronger ERPT combined with more persistent inflationary expectations, unofficial financial dollari-zation/euroization, as well as external (mainly deficit) imbalances.
transi-83
Inflation Targeting in Advanced vs. Emerging Economies before and after the Crisis
tion economies also confirm Fabrizio Coricelli, Boštjan Jazbec, and Igor Maston (2004), while Kosta Josifidis, Jean-Pierre Allegret, and Emilija Beker Pucar (2009) confirm dominance of ERPT over interest rate pass-through in monetary transmis-sion mechanism of Poland, Czech Republic, Slovakia, Hungary and Serbia, especial-ly at the beginning of transition process. The authors explored the road of selected Eastern European Economies (EEE) which pass through the three phases: macroeco-nomic stabilization phase or ER as a nominal anchor phase, intermediate (hybrid) ER regime and, finally, adoption of managed floating ER regime in the combination with preparatory (later full-fledged) IT monetary framework. At the third phase, some of key vulnerabilities have been decreased in the sense of lower exchange rate pass-through (ERPT) and less influence to ER. Sebastian Edwards (2006) finds that emerging countries which adopted IT experienced a decline in the pass-through from ER changes to inflation. Therefore, most emerging IT countries have previously pre-pared for managed floating ER regime in the combination with IT monetary frame-work. Mark Stone et al. (2009) confirm that non-IT emerging economies more man-age the ER and that policy implementation tends to be based on foreign exchange intervention that is more ad hoc and less market-based. ER channels are stronger and more uncertain for the typical non-IT emerging economies. These countries are less financially developed, more dollarized, and with less overall credibility compared to IT emerging economies.
Inflationary expectations, nominal anchor and credibility of monetary policy are another source of vulnerability. Less developed economies have had very persis-tent and downward rigid inflationary expectations due to former inflationary episodes and insufficient credibility of monetary policy to restrain inflation. Consequently, traditional anchor in such economies is an exchange rate. However, there are opi-nions that IT implementation in combination with flexible ER during time contribute to a restrain of inflationary expectations, as well as wage and price indexation (Mish-kin 2004; Mish(Mish-kin and Klaus Schmidt-Hebbel 2007).
fac-84 Kosta Josifidis, Emilija Beker Pucar, Slađana Srdić and Gabriela Ivan
tor in order to strengthen credibility of monetary authorities, to gain credibility to monetary policy regime and to perform de facto switch towards a new anchor.
Similar specificities in IT practicing, related with the role of ER in emerging economies, are underlined in Stone et al. (2009). Authors claim that the enhanced role of the ER in IT emerging economies reflects strong, uncertain, and heterogene-ous ER channels. First, pass-through from the ER to inflation is especially important for emerging economies, in part reflecting lower policy credibility. Second, many emerging economies manage the ER to mitigate the impact on output of relatively short-term currency movements. A third, longstanding motivation for active man-agement of the ER is to promote financial stability, particularly against the impact of a potential depreciation on balance sheets with currency mismatches. Fourth, ER management can also help avoid or mitigate the adverse consequences for external stability of a “sudden stop” in capital inflows. Fifth, underdeveloped domestic finan-cial markets reduce the scope for ER flexibility by amplifying ER shocks and con-straining policy implementation. Finally, a high degree of overall policy credibility frees up the ER to float and enhances policy implementation and thus is necessary for the adoption of a full-fledged IT nominal anchor.
Christopher P. Ball and Javier Reyes (2004) based on the Guillermo A. Calvo and Carmen M. Reinhart (2002) tried to identify the difference between “fear of floating”, IT and ER targeting. Their research is concentrated on the distinction be-tween de jure and de facto adopted ER and monetary regimes. Countries with de jure IT as a monetary framework could de facto target an ER or express so called “fear of floating”. The authors examine variability of ER, nominal and real interest rate, and foreign exchange reserves, in order to find the difference between strict IT and ER targeting. Crucial difference between “fear of floating” and strict IT lies in monetary policy reactions to nominal ER changes. In IT regime interest rate should react to nominal exchange rate (NER) depreciations only if inflation target is threatened, not in the case of all ER depreciation episodes. Besides, credible and strict IT is compat-ible with managed and free floating ER regimes, while “fear of floating” is closer to ER targeting. In most examined cases, de jure and de facto IT coincides, except five countries with de jure IT and de facto “fear of floating” (the cases of Brazil, Colom-bia, Peru, South Africa and Poland).
“Fear of floating phenomenon is, indeed, widespread and cuts across regions and levels of development. Fear of floating - or more generally, fear of large curren-cy swings - is pervasive for a variety of reasons, particularly among emerging market countries. In sum, economic theory provides us with well-defined distinctions be-tween fixed and flexible ER regimes, but we are not aware of any criteria that allow us to discriminate as to when a managed float starts to look like a soft peg. Indeed, it is often quite difficult to distinguish between the two. On the basis of the empirical evidence, perhaps, all that we can say is that, when it comes to exchange rate policy, discretion rules the day” (Calvo and Reinhart 2002, pp. 404-405).
steri-85
Inflation Targeting in Advanced vs. Emerging Economies before and after the Crisis
lized exchange interventions in comparison to other inflation targeters that float more freely. From the side of relatively large ER volatility and moderate international re-serve holdings, as well as declining inflation-to-devaluation pass-through coefficients with little evidence for monetary policy reaction to ER shocks, explored LAE didn’t exhibit “fear of floating” in IT monetary framework. Carlos A. Ibarra (2008) investi-gated “fear of floating” in the case of three LAE inflation targeters, namely Chile, Colombia and Mexico. The author showed that “fear of floating” is becoming weaker as the period of floating lengthens in investigated LAE. Exchange rate volatility has risen since adoption of floating ER regime, although this is rather gradual process than discrete adjustment. Decreasing “fear of floating” phenomenon may be the re-sult of a circular mechanism, i.e. rising ER volatility is connected with decreasing effects on output and inflation, and when these transmission effects weaken monetary authorities won’t limit ER fluctuations significantly.
Taking into account crucial obstacles to successful IT in emerging economies, some authors investigated different types or sub-regimes within IT framework. Thus, Lucjan T. Orlowski (2000, 2005) suggests “light” IT sub-regime or dynamic ap-proach to IT for transition economies confronted with already mentioned problems in performing full-fledged IT. Alina Carare and Stone (2006) identify three IT sub-regimes: full-fledged IT, eclectic IT, and light IT. Although IT proves to be success-ful in less and middle developed economies, United States of America (USA), Euro-pean Monetary Union (EMU) and Japan never officially adopted IT. Restraint from explicit acceptance of pure IT regime is connected with the attempt to avoid over excessive focus to inflation target by violating goals of real economy, not to forget the fact that strong economies doesn’t need firm and transparent anchor at all. Hans Genberg (2002) distinguish between strict and flexible IT stressing that strict IT as-sumes exclusive focus to inflation target, while flexible IT offers some weight to the other economic policy goals (if they are not confronted with the primary price stabili-ty goal). Lars E. O. Svensson (2007) highlight that even in the case if these advanced economies adopt IT, it will be rather in the form of flexible IT, not in the form of rigid, strict or pure IT regime.
2. Methodology Issues
Advanced IT economies used in our analysis are Australia, Canada, Norway, New Zealand, United Kingdom (UK), Iceland, and Sweden. Emerging IT economies in-clude Brazil, Chile, Colombia, Mexico, Peru (LAE), Czech Republic, Hungary, and Poland (EEE). Selected countries with the years of IT adoption, along with other im-portant informations for econometric analysis are presented in Table 1 in Appendix. Detailed review of IT contries could be found in Hammond (2012) and Peter War-burton and Joanna Davies (2013), while classification of monetary policy frame-works for all member countries could be found in International Monetary Fund - IMF (2012).
apprec-86 Kosta Josifidis, Emilija Beker Pucar, Slađana Srdić and Gabriela Ivan
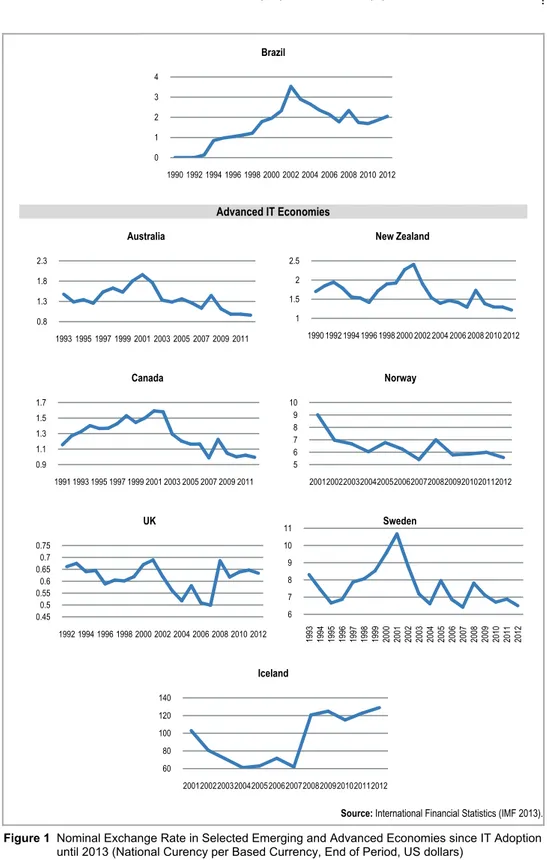
iation tendency in the years prior the crisis. All countries in 2008-2009 crisis years experienced depreciation pressures in more or less extent. National currencies of LAE recovered relatively quickly after the crisis years, while in the case of EEE the appreciation path restored with a longer delay compared to LAE. Currencies of ad-vanced IT economies also recovered relatively quickly, as in the case of LAE, with the continuation of appreciation trend. The exception in the group of advanced IT economies is Iceland which has been severely hit with the crisis and experienced strong and persistent currency weakening.
In order to reveal the difference between advanced and emerging economies in vulnerability to ER shocks and accompanying monetary response to ER shocks, fore-cast error variance decomposition results are derived from estimated Vector Autore-gression (VAR) / Vector Error Correction (VEC) models. Vulnerability to ER shocks is tracked as nominal ER (impulse) transmission to consumer price index (response) and industrial production (response). Monetary policy response to ER shocks is ob-served via nominal ER transmission (impulse) to interest rate (response) and foreign exchange reserves (response). These main relations, namely ER pass-through to in-flation, industrial production, interest rate and foreign reserves, are analyzed during 24 months since ER shock (impulse) occurrence.
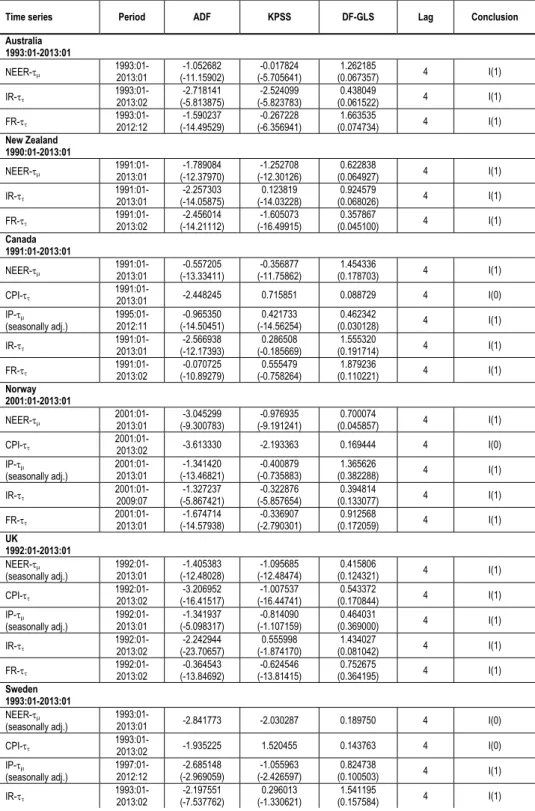
All time series of monthly frequency are obtained through IMF International Financial Statistics1 including: Industrial production - IP (manufacturing, seasonally adjusted),Consumer prices - CPI (Index 2005=100), Interest rate - IR (money market rate), Nominal effective exchange rate - NEER (consumer price index), Official Re-serve Assets - FR (Foreign Currency ReRe-serves in Convertible Foreign Currencies, US Dollar). The exact time series and time sub-periods used in the case of selected coun-tries are presented in Table 1 in Appendix.
Research period starts with the year when selected countries adopted IT until global economic crisis (August 2007), named as first sub-period or pre-crisis period. The second sub-period starts with August 2007 until data are available (depends from the database, but generally until January 2013), named (post)crisis period.
Time series were primarily transformed in log values (with the exemption of an interest rate), followed with stationarity testing via Augmented Dickey-Fuller (ADF), Kwiatkowski-Phillips-Schmidt-Shin (KPSS) and Dickey-Fuller test statistic using a generalized least squares GLS (DF-GLS). The results of stationarity testing in the level and in the first differences are presented in Table 2 in Appendix.
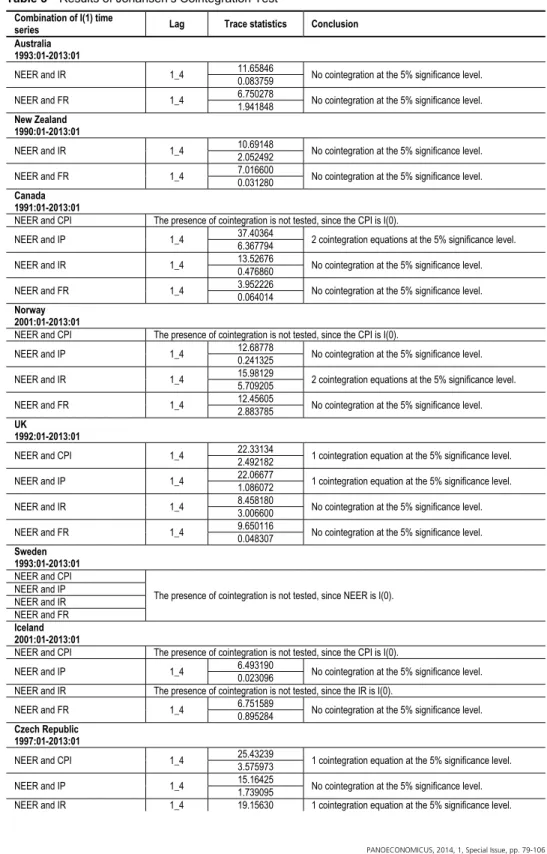
If both series are non-stationary Johansen’s cointegration test is performed. If the cointegration is confirmed, VEC model is estimated. If cointegration isn’t con-firmed, VAR model is estimated in the first differences. Results of cointegration test-ing are presented in Table 3 in Appendix. If one series is stationary, but another one is non-stationary, VAR model is estimated with previously differencing of series with unit root. If both series are stationary they enter in VAR model in the level. Fi-nally, after estimation of VAR or VEC model, depending from stationarity and coin-tegration tests, forecast error variance decomposition results are derived with nomin-al ER as an impulse from one side, and prices, industrinomin-al production, interest rate and
1
87
Inflation Targeting in Advanced vs. Emerging Economies before and after the Crisis
foreign reserves as responses from the other side. Forecast error variance decomposi-tion results are further analyzed and presented with Figures 2-5.
3. The Discussion of Results
If ERPT to consumer prices and industrial production is higher, then ER movements destabilize internal balance in the sense of potential inflationary pressures or contrac-tionary pressures of real economy. If this is the case, it is expected that monetary re-sponse, indirectly via interest rate or directly via foreign exchange interventions, to ER shocks is stronger. Conventional thought is that advanced economies less limit ER fluctuations due to their less vulnerability (less transmission of ER shocks to the inflation and output), while emerging economies more care about ER fluctuations since these movements are transmitted to their internal and external imbalance. Em-pirical findings reveal are there such striking differences in performing IT in the case of advanced vs. emerging economies having in mind ERPT to inflation and real economy and, accordingly, is there any significant difference in monetary reactions to ER shocks.
Since global economic crisis brought strong external trade and financial shocks (significant drop in export demand and export prices from one side, and ab-rupt sudden stop problem or even capital outflows from the other side), the results reveal if something changed in (post)crisis sub-period having in mind the role of ER in IT monetary regime on relation advanced vs. emerging economies. Under external shocks monetary authorities in IT regime balance between allowing market-oriented ER depreciation from one side, and limiting ER movements to prevent stronger transmission to internal inflationary and real balance from the other side. We expect higher vulnerability to ER shocks in explored countries and higher managing of ER fluctuations in the (post)crisis period. Concerning the way of managing ER move-ments, it could be expected that advanced economies use more interest rate as an in-direct way, while for emerging economies is expected to use more in-direct way or for-eign exchange interventions to limit excessive depreciations.
3.1 Vulnerability of Selected Countries to Exchange Rate Shocks: Exchange Rate Pass-Through to Consumer Prices and Industrial Production
Observing ER transmission to consumer prices there is no clear line or striking dif-ference between advanced and emerging economies (Figure 2a and 2b).
ERPT in EEE didn’t pass 12% of CPI variations in both periods. In the group of LAE, ERPT in Mexico was raised from minor transmission in pre-crisis period to around 25% of consumer prices variations. Most striking difference between sub-periods is in the case of Peru which ERPT vary from very low in the pre-crisis period to almost 80% in the (post)crisis period.
88 Kosta Josifidis, Emilija Beker Pucar, Slađana Srdić and Gabriela Ivan
Source: Authors' estimations.
Figure 2a ERPT to Consumer Prices in the Pre-Crisis Period in Advanced and Emerging IT Countries
Source: Authors' estimations.
Figure 2b ERPT to Consumer Prices in the (Post)Crisis Period in Advanced and Emerging IT Countries
From the other side, ERTP to the real economy indicator, namely industrial production variations, points to higher vulnerability in the second sub-period in most countries (Figure 3a and 3b). In the first sub-period results don’t point to relevant difference between emerging and advanced economies. In EEE group, Polish vulne-rability was the highest (around 7%), in the group of LAE Peru expressed relatively highest vulnerability (below 5%), and Iceland in the group of advanced IT countries with 8% of industrial production variations.
In the second sub-period rise in real vulnerability is obvious in the cases of LAE at the first place, as well as some advanced countries. For the case of Brazil this
0 10 20 30 40 50 60 70 80 90
ERPT to Consumer Prices: 1st Subperiod
1st 6th 12th 18th 24th
Advanced IT economies
0 10 20 30 40 50 60 70 80 90
ERPT to Consumer Prices: 2nd Subperiod
1st 6th 12th 18th 24th
89
Inflation Targeting in Advanced vs. Emerging Economies before and after the Crisis
difference is 3% in the first sub-period to almost 40% in the second sub-period; Chile from around 1% to 12%; Mexico from around 1% to 5%; Peru from 5% to 8%. In the group of EEE real economy variations due to ER shock increased in the case of Czech Republic (from below 1% to around 7%); Hungary (below 1% to around 3%); while Poland2 is the exemption with reduced real vulnerability in crisis period (de-crease from around 6% to below 1%).
Source: Authors' estimations.
Figure 3a ERPT to Industrial Production in the Pre-Crisis Period in Advanced and Emerging IT Countries
Source: Authors' estimations.
Figure 3b ERPT to Industrial Production in the (Post)Crisis Period in Advanced and Emerging IT Countries
2
Poland was the only country between Emerging European Economies, which didn’t experience GDP fall in 2008 and 2009. It serves as an example how ER depreciations is a useful tool in a fight against external shocks in crisis period. For more details see Josifidis, Allegret, and Beker Pucar (2013).
0 5 10 15 20 25 30 35 40
ERPT to Industrial Production: 1st Subperiod
1st 6th 12th 18th 24th
Advanced IT economies
0 5 10 15 20 25 30 35 40
Czech Hungary Poland Chile Mexico Peru Brasil Canada Norway UK Sweden Iceland
ERPT to Industrial Production: 2nd Subperiod
1st 6th 12th 18th 24th
90 Kosta Josifidis, Emilija Beker Pucar, Slađana Srdić and Gabriela Ivan
While emerging economies generally increased its real vulnerability to ER shock, especially LAE, most advanced economies (with the exemption of Norway and Sweden) also experienced higher ERPT to industrial production variations. That especially holds for Canada which industrial production variations explained with ER shock increased from around 1% to 30% in the second sub-period. UK also increased vulnerability of industrial production to ER variations from around 1% to around 15%. Iceland kept its real vulnerability at the same level as in the first sub-period.
Overall, we cannot highlight crucial difference between emerging and ad-vanced economies, although LA IT economies did express most significant rise of real vulnerability. Higher vulnerability of LAE, as well as some advanced econo-mies, could be connected with financial and economic interconnections with the USA economy, where is placed origin of the crisis. For instance, countries that in post-crisis period showed a greater response of industrial production to the ER are those with a greater trade links with the USA. Cohen (2012) emphasized heterogene-ous patterns of vulnerability and response of LAE outlining three transmission chan-nels from USA: financial chanchan-nels, trade chanchan-nels and remittances. In this crisis epi-sode, financial channels of transmission were weaker compared to previous crisis episode, due to pre-crisis boom which allowed countries in Latin America to make major improvements in balance sheets with more policy space for countercyclical measures during the crisis. Contrary to the financial channels, trade channels were strongly affected, especially for manufacturing and service export sectors. The same conclusion is stated in Osvaldo Kacef and Rafael Lopez-Monti (2010) who stressed that repercussions of the crisis for LAE were manifested through real sector and ne-gatively affected economic performance with significant drop in trade flows and ex-port activities.
Nevertheless, more detailed analysis should be based on specific country cas-es, having in mind different results between country groups (advanced vs. emerging) and within the same group. For instance, Poland decreased its real vulnerability, while Norway and Sweden escape higher real vulnerability in crisis period, opposite to other countries in the group.
3.2 Monetary Policy Response to Exchange Rate Shocks: The Extent of “Fear of Floating”
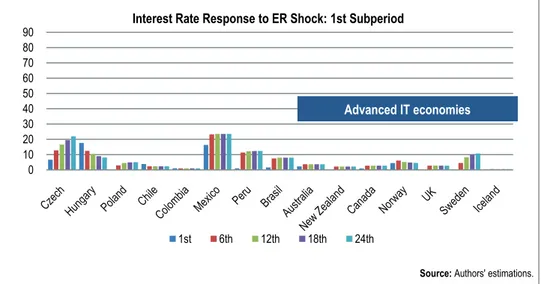
Monetary policy response is expected to be connected with previously findings con-cerning higher vulnerability of inflationary and real variables to ER shock. General-ly, we expect that advanced economies more use interest rate as a market and indirect way of influence to ER variations. From the other side is our expectation that emerg-ing economies more used foreign exchange reserves as a direct and faster way to lim-it ER fluctuations, notably depreciations. These expectations are confirmed wlim-ith va-riance decomposition results (Figures 4-5).
91
Inflation Targeting in Advanced vs. Emerging Economies before and after the Crisis
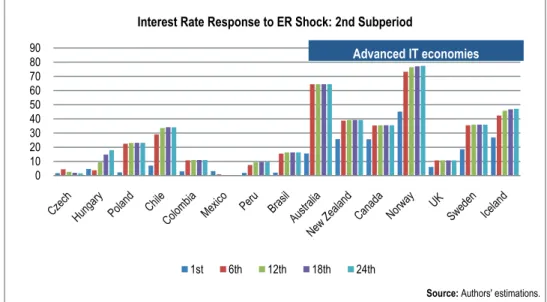
rate variations as a response to ER shock increased from around 5% to almost 80%; Australian interest rate variations increased from around 5% to about 65%; in the case of New Zealand the increase in interest rate variations explained with ER movements is from around 2% to almost 40%; for Iceland from around 1% to almost 50%; for Canada from 2% to 35%; for Sweden from 10% to 45%; and for UK from 3% to 10%. Therefore, advanced economies used, in more or less extent, interest rate as an indirect way to limit ER excessive fluctuations.
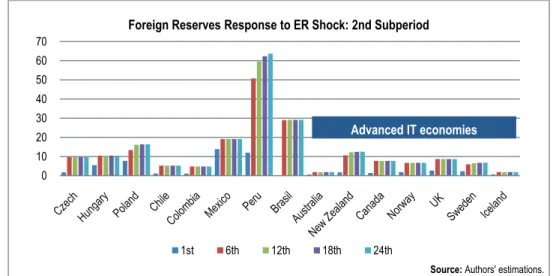
Figure 5a and 5b shows monetary policy response via foreign reserves to ER shock in pre-crisis and (post)crisis period. Foreign exchange reserves weren’t used by monetary authorities of advanced economies as a way to limit fluctuations in the pre-crisis period with slightly increase of usage in the (post)crisis period (case of New Zealand, Canada, Norway, UK, Sweden, while Australia and Iceland didn’t use this monetary instrument as a response to ER shock).
Emerging economies more used direct influence to ER fluctuations via foreign exchange reserves (see Figure 5a and 5b). However, the group of emerging econo-mies is divergent. LAE expressed higher growth in foreign reserves variations ex-plained with ER shock that especially holds for Peru (growth from 30% from above 60%), Brazil (from around 3% to almost 30%), and Mexico (from around 5% to al-most 20%). Chile and Colombia didn’t increase the role of foreign exchange reserves as a response to excessive ER fluctuations. The results are in line with higher vulne-rability of these countries to ER transmission to inflation and industrial production. Peru is LAE most exposed to ERPT to consumer prices in (post)crisis period and it used direct and faster way to limit ER depreciation to keep the primary goal under targeted range. Brazil expressed higher exposure of real economy to ER shocks and, accordingly, increased the role of foreign exchange reserves to prevent real economy destabilization under external shocks. Mexico increased vulnerability from both as-pects (inflationary and real, but not as striking as Peru and Brazil) and, accordingly, it moderately increased the role of foreign exchange reserves.
Source: Authors' estimations.
Figure 4a Monetary Response via Interest Rate to ER Shocks in the Pre-Crisis Period in Advanced and Emerging IT Countries
0 10 20 30 40 50 60 70 80 90
Interest Rate Response to ER Shock: 1st Subperiod
1st 6th 12th 18th 24th
92 Kosta Josifidis, Emilija Beker Pucar, Slađana Srdić and Gabriela Ivan
Source: Authors' estimations.
Figure 4b Monetary Response via Interest Rate to ER Shocks in the (Post)Crisis Period in Advanced and Emerging IT Countries
Source: Authors' estimations.
Figure 5a Monetary Response via Foreign Reserves to ER Shocks in the Pre-Crisis Period in Advanced and Emerging IT Countries
0 10 20 30 40 50 60 70 80 90
Interest Rate Response to ER Shock: 2nd Subperiod
1st 6th 12th 18th 24th
Advanced IT economies
0 10 20 30 40 50 60 70
Foreign Reserves Response to ER Shock: 1st Subperiod
1st 6th 12th 18th 24th
93
Inflation Targeting in Advanced vs. Emerging Economies before and after the Crisis
Source: Authors' estimations.
Figure 5b Monetary Response via Foreign Reserves to ER Shocks in the (Post)Crisis Period in Advanced and Emerging IT Countries
Our results indicate that EEE didn’t increase inflationary and real vulnerability to ER shocks so strongly compared to LAE. Accordingly, EEE didn’t use indirect and direct manner to withstand the ER shocks. This finding could be interpreted in the way that EEE mostly benefited from the role of ER as a shock absorber. ER de-preciations under external shocks in the second sub-period weren’t significantly li-mited and the industrial production variations weren’t strongly increased as in the case of some LAE or even advanced economies. Contrary to EEE which successfully combine IT monetary framework with the role of ER as a shock absorber, another group of EEE with ER as a nominal anchor monetary strategy experienced the oppo-site in the crisis period. Josifidis, Allegret, and Beker Pucar (2013) explored EEE with flexible ER as a shock absorber from one side (Poland, Czech Republic, Hun-gary, Romania, Serbia), and EEE with ER as a nominal anchor (Estonia, Lithuania, Latvia, Bulgaria, and Croatia) on the other side, in the pre-crisis and the crisis period. Authors conclude that countries with flexible ER experienced ER depreciations, but avoid painful adjustment mechanism with less output and employment drop. Con-trary, countries with rigid ER arrangement suffer more in the terms of internal ad-justment with huge output and employment losses. Hence, in the crisis period ac-companied with external shocks, ER is proved to be efficient shocks absorber in the case of EEE.
“Fear of floating” was more expressed in LAE. These countries used direct way to limit ER fluctuations. Stronger role of foreign exchange interventions in the case of LAE could be connected with the boom in commodity prices in the pre-crisis period. Most of the growth phase 2003-2008 or the boom period in Latin America prior the crisis, was characterized with an increase in inflationary expectations as a result of the steady expansion in activity and rising commodity prices, especially for food and energy. After initial stage of sharp real effective exchange rate depreciation, LAE experienced quickening real appreciation (mainly due to dollar depreciation
0 10 20 30 40 50 60 70
Foreign Reserves Response to ER Shock: 2nd Subperiod
1st 6th 12th 18th 24th
94 Kosta Josifidis, Emilija Beker Pucar, Slađana Srdić and Gabriela Ivan
against other currencies, improving terms of trade, rising demand for some of the region’s export products and growing inflows of emigrant workers’ remittances), which led many of the region’s central banks to perform foreign exchange interven-tions, building up large international reserves. Increased reserves have given to LAE a stronger tool in reserve management to protect against external shocks (World Bank 2009). Post-crisis period brought depreciation tendencies following three years of appreciation and, accordingly, loss of foreign exchange reserves. For details con-cerning macroeconomic policy challenges in Latin America from the boom to crisis, see Kacef and Lopez-Monti (2010) and Cohen (2012). The role of foreign exchange interventions in coping with external shocks during the crisis in LAE was also em-phasized in Reinhart (2013).
Although “fear of floating” is phenomenon used mainly in the case of emerg-ing economies with de jure floatemerg-ing ER regime, but with de facto high extent of man-aging ER fluctuations, the results indicate that under external shocks in (post)crisis period advanced IT economies also limit ER fluctuations (although indirectly via interest rate) and express some form of “fear of floating”. This isn’t the case in the pre-crisis period where minor response of interest rate and foreign exchange reserves to ER shock was found in advanced IT countries.
4. Conclusion
Emerging economies in the phase of IT adoption decreased ERPT to consumer pric-es. IT monetary framework is not macroeconomic stabilization program and, accor-dingly, it is usually implemented after achieved macroeconomic stability and anc-hored inflationary expectations. Emerging countries at the macroeconomic stabiliza-tion phase on their development (and transistabiliza-tion) process accepted ER as a nominal anchor moving gradually towards another, more flexible ER and monetary arrange-ment. Our results indicate that there is no striking difference in ERPT between emerging and advanced economies in the pre-crisis period.
In the (post)crisis period ERPT to prices increased mainly in LAE, especially in Peru. Contrary, EEE didn’t increase inflation vulnerability to ER shocks, while in the group of advanced economies no specific changes are observable (Sweden and Iceland have kept relatively higher ERPT to prices compared to other advanced countries). ERPT to prices stagnated or kept its former levels due to weaker aggre-gate demand in crisis period. Weaker aggreaggre-gate demand is connected with lower im-port (as well as exim-port) activities and accordingly lower ERPT to consumer prices via direct and indirect channels.
95
Inflation Targeting in Advanced vs. Emerging Economies before and after the Crisis
important change. Obviously, we cannot highlight striking difference neither to this type of vulnerability.
Since EEE seems to be the least vulnerable to ER shock, these economies al-lowed more ER fluctuations. This claim is based on result of monetary reaction via interest rate and foreign exchange reserves to ER shocks in both sub-periods. This finding has another standpoint. Namely, EEE with the relatively least monetary re-sponse compared to other explored IT economies, allowed more absorbing role of ER and consequently experienced less output variations (especially Polish case which serves as an example of rare European economy without GDP drop in 2008 and 2009 due to mainly ER depreciations and shock absorbing role). Having in mind more vulnerable position of LAE concerning ERPT to industrial production, these economies more respond to ER shocks. In order to limit ER depreciations to avoid stronger contractionary effects of ER shock, LAE mainly used direct, faster and less market-friendly way to limit ER depreciations – foreign exchange reserves. This finding is expected since emerging economies use more direct way of influence via foreign exchange interventions, contrary to advanced economies.
As previous results implicate, some advanced economies experienced rise in output variability due to ER shocks and these economies (unlike emerging countries) significantly increased the role of interest rate to withstand the excessive ER fluctua-tions. Therefore, “fear of floating” shouldn’t be connected exclusively to emerging economies. Although all advanced economies weren’t analyzed (because some of them didn’t accept officially IT monetary framework), our sample of advanced econ-omies indicate that the difference in internal vulnerability to ER shocks were shrink-ing between emergshrink-ing and advanced IT countries. These differences were more ap-parent in the preparatory phase for full adoption of IT regime, but after official ac-ceptance monetary authorities in emerging economies worked on preparation for successful IT, including decreasing role of ER in monetary transmission mechanism.
96 Kosta Josifidis, Emilija Beker Pucar, Slađana Srdić and Gabriela Ivan
References
Aizenman, Joshua, Michael Hutchison, and Ilan Noy. 2011. “Inflation Targeting and Real
Exchange Rates in Emerging Markets.” World Development, 39(5): 712-724.
Ball, Christopher P., and Javier Reyes. 2004. “Inflation Targeting or Fear of Floating in Disguise? A Broader Perspective?” http://comp.uark.edu/~reyes/Files/
IT%20or%20FF%20in%20Disguise%20FINAL%20JMacro.pdf.
Barbosa-Filho, Nelson H. 2008. “Inflation Targeting in Brazil: 1999-2006.” International Review of Applied Economics, 22(2): 187-200.
Calvo, Guillermo A., and Carmen M. Reinhart. 2002. “Fear of Floating.” The Quarterly Journal of Economics, 117(2): 379-408.
Carare, Alina, and Mark R. Stone. 2006. “Inflation Targeting Regimes.” European Economic Review, 50(5): 1297-1315.
Carrasco, Carlos A., and Jesus Ferreiro. 2011. “Inflation Targeting and Economic
Performance: The Case of Mexico.” Panoeconomicus, 58(5): 675-692.
Carrasco, Carlos A., and Jesus Ferreiro. 2013. “Inflation Targeting and Inflation
Expectations in Mexico.” Applied Economics, 45(23): 3295-3304.
Cohen, Michael. 2012. The Global Economic Crisis in Latin America: Impacts and Responses. London and New York: Routledge.
Coricelli, Fabrizio, Boštjan Jazbec, and Igor Masten. 2004. “Exchange Rate Pass-Through in Acceding Countries: The Role of Exchange Rate Regimes.” http://www.hnb.hr/dub-konf/10-konferencija-radovi/coricelli-jazbec-masten.pdf.
Daianu, Daniel, and Laurian Lungu. 2007. ”Inflation Targeting, between Rhetoric and
Reality. The Case of Transition Economies.” The European Journal of Comparative
Economics, 4(1): 39-64.
Desormeaux, Jorge. 2006. “Strategies for Dedollarization: Financial Sector Development and Inflation Targeting.” The paper presented at International Conference Dedollarization: Consequences and Policy Options, Istanbul.
Edwards, Sebastian. 2006. “The Relationship between Exchange Rates and Inflation Targeting Revisited.” National Bureau of Economic Research Working Paper 12163.
Epstein, Gerald, and Enriç Yeldan. 2008. “Inflation Targeting, Employment Creation and Economic Development: Assessing the Impacts and Policy Alternatives.”
International Review of Applied Economics, 22(2): 131-144.
Genberg, Hans. 2002. “Inflation Targeting - The Holy Grail of Monetary Policy.” Hong Kong Institute for Monetary Research Working Paper 2/2002.
Golinelli, Roberto, and Riccardo Rovelli. 2001. “Interest Rate Rules and Inflation Targeting in Three Transition Economies.” http://www2.dse.unibo.it/wp/429.pdf.
Hammond, Gill. 2012. “State of the Art of Inflation Targeting - 2012.” Centre for Central Bank Studies Handbook 29.
Horská, Helena. 2004. “Inflation Targeting in Central and Eastern European Countries.” PhD thesis. University of Economics Prague, Faculty of Economics and Public
Administration.
Ibarra, Carlos A. 2008. “Disinflation and Real Currency Appreciation in Chile and Mexico:
The Role of Monetary Policy.” Investigación Económica, 67(266): 67-94.
International Monetary Fund - IMF. 2012. Annual Report on Exchange Arrangements and
97
Inflation Targeting in Advanced vs. Emerging Economies before and after the Crisis
Jonas, Jiri. 2003. Inflation Targeting in Transition Economies: Some Issues and Experience. Prague: Czech National Bank.
Jonas, Jiri, and Frederic S. Mishkin. 2003. “Inflation Targeting in Transition Countries: Experience and Prospects.” National Bureau of Economic Research Working Paper 9667.
Josifidis, Kosta, Jean-Pierre Allegret, and Emilija Beker Pucar. 2009. “Monetary and Exchange Rate Regimes Changes: The Cases of Poland, Czech Republic, Slovakia
and Republic of Serbia.” Panoeconomicus, 56(2): 199-226.
Josifidis, Kosta, Jean-Pierre Allegret, and Emilija Beker Pucar. 2013. “Adjustment Mechanisms and Exchange Rate Regimes in 2004 New EU Members during the
Financial Crisis.” Post-Communist Economies, 25(1): 1-17.
Kacef, Osvaldo, and Rafael López-Monti. 2010. “Latin America, from Boom to Crisis:
Macroeconomic Policy Challenges.” CEPAL Review, 100: 41-67.
Masson, Paul R., Miguel A. Savastano, and Sunil Sharma. 1997. “The Scope for Inflation Targeting in Developing Countries.” International Monetary Fund Working Paper 130.
Mishkin, Frederic S., and Klaus Schmidt-Hebbel. 2001. “One Decade of Inflation Targeting in the World: What Do We Know and What Do We Need to Know?” National Bureau of Economic Research Working Paper 8397.
Mishkin, Frederic S. 2004. “Can Inflation Targeting Work in Emerging Market Countries.” National Bureau of Economic Research Working Paper 10646.
Mishkin, Frederic S. 2007. Monetary Policy Strategy. Cambridge, MA: MIT Press.
Mishkin, Frederic S., and Klaus Schmidt-Hebbel. 2007. “Does Inflation Targeting Make a Difference?” National Bureau of Economic Research Working Paper 12876.
Orlowski, Lucjan T. 2000. “A Dynamic Approach to Inflation Targeting in Transition Economies.” Center for European Integration Studies Working Paper 11-2000.
Orlowski, Lucjan T. 2005. “Monetary Policy Adjustments on the Final Passage towards the Euro.” Center for Social and Economic Research, Studies and Analysis 294.
Reinhart, Carmen. 2013. “Goodbuy Inflation Targeting, Hello Fear of Floating? Latin America after the Global Financial Crisis.” Munich Personal RePEc Archive Paper 51282.
Schmidt-Hebbel, Klaus, and Alejandro Werner. 2002. “Inflation Targeting in Brazil, Chile, and Mexico: Performance, Credibility, and the Exchange Rate.” Central Bank of Chile Working Paper 171.
Sek, Siok Kun, and Wai Mun Har. 2012. “Does Inflation Targeting Work in Emerging
East-Asian Economies?” Panoeconomicus, 59(5): 599-608.
Stone, Mark, Scott Roger, Seiichi Shimizu, Anna Nordstrom, Turgut Kisinbay, and Jorge Restrepo. 2009. “The Role of the Exchange Rate in Inflation-Targeting Emerging Economies.” International Monetary Fund Ocassional Paper 267.
Svensson, Lars E. O. 2007. “Inflation Targeting.” http://www.princeton.edu/svensson/ papers/PalgraveIT.pdf.
Warburton, Peter, and Joanna Davies. 2013. “Inflation Targeting - A Child of Its Time.” http://www.centralbanking.com/central-banking-journal/feature/2153972/inflation-targeting-child.
98 Kosta Josifidis, Emilija Beker Pucar, Slađana Srdić and Gabriela Ivan
Appendix
European Emerging IT Economies
Latin American Emerging IT Economies
15 20 25 30 35 40
1997 1998 1999 2000 2001 2002 2003 2004 2005 2006 2007 2008 2009 2010 2011 2012
Czech Republic
150 170 190 210 230 250 270 290
200120022003200420052006200720082009201020112012
Hungary
2 2.5 3 3.5 4 4.5
Poland
400 450 500 550 600 650 700 750
1999 2000 2001 2002 2003 2004 2005 2006 2007 2008 2009 2010 2011 2012
Chile
1500 2000 2500 3000
1999 2000 2001 2002 2003 2004 2005 2006 2007 2008 2009 2010 2011 2012
Colombia
8 9 10 11 12 13 14 15
2001 20022003 200420052006 20072008 20092010 20112012
Mexico
2.5 2.7 2.9 3.1 3.3 3.5 3.7
2002 2003 2004 2005 2006 2007 2008 2009 2010 2011 2012
99
Inflation Targeting in Advanced vs. Emerging Economies before and after the Crisis
Advanced IT Economies
Source: International Financial Statistics (IMF 2013).
Figure 1 Nominal Exchange Rate in Selected Emerging and Advanced Economies since IT Adoption until 2013 (National Curency per Based Currency, End of Period, US dollars)
0 1 2 3 4
1990 1992 1994 1996 1998 2000 2002 2004 2006 2008 2010 2012
Brazil
0.8 1.3 1.8 2.3
1993 1995 1997 1999 2001 2003 2005 2007 2009 2011
Australia
1 1.5 2 2.5
1990 1992 1994 1996 1998 2000 2002 2004 2006 2008 2010 2012
New Zealand
0.9 1.1 1.3 1.5 1.7
1991 1993 1995 1997 1999 2001 2003 2005 2007 2009 2011
Canada
5 6 7 8 9 10
200120022003200420052006200720082009201020112012
Norway
0.45 0.5 0.55 0.6 0.65 0.7 0.75
1992 1994 1996 1998 2000 2002 2004 2006 2008 2010 2012
UK
6 7 8 9 10 11
1993 1994 1995 1996 1997 1998 1999 2000 2001 2002 2003 2004 2005 2006 2007 2008 2009 2010 2011 2012
Sweden
60 80 100 120 140
200120022003200420052006200720082009201020112012
100 Kosta Josifidis, Emilija Beker Pucar, Slađana Srdić and Gabriela Ivan
Table 1 Countries, Time Series and Sub-Periods of Empirical Research
Countries Sub-periods: pre-crisis and (post)crisis period Time series (from International Financial
Statistics, IMF) Advanced IT economies
Australia
1st sub-period: 1993:01-2007:07
2nd sub-period: 2007:08-2013:01 NEER(impulse)-IR(response)
1st sub-period: 1993:01-2007:07
2nd sub-period: 2007:08-2013:01 NEER(impulse)-FR(response)
New Zealand
1st sub-period: 1991:01-2007:07
2nd sub-period: 2007:08-2013:01 NEER(impulse)-IR(response)
1st sub-period: 1991:01-2007:07
2nd sub-period: 2007:08-2013:01 NEER(impulse)-FR(response)
Canada
1st sub-period: 1991:01-2007:07
2nd sub-period: 2007:08-2013:01 NEER(impulse)-CPI(response)
1st sub-period: 1995:01-2007:07
2nd sub-period: 2007:08-2012:11 NEER(impulse)-IP(response)
1st sub-period: 1991:01-2007:07
2nd sub-period: 2007:08-2013:01 NEER(impulse)-IR(response)
1st sub-period: 1991:01-2007:07
2nd sub-period: 2007:08-2013:01 NEER(impulse)-FR(response)
Norway
1st sub-period: 2001:01-2007:07
2nd sub-period: 2007:08-2013:01 NEER(impulse)-CPI(response)
1st sub-period: 2001:01-2007:07
2nd sub-period: 2007:08-2013:01 NEER(impulse)-IP(response)
1st sub-period: 2001:01-2007:07
2nd sub-period: 2007:08-2009:07 NEER(impulse)-IR(response)
1st sub-period: 2001:01-2007:07
2nd sub-period: 2007:08-2013:01 NEER(impulse)-FR(response)
UK
1st sub-period: 1992:01-2007:07
2nd sub-period: 2007:08-2013:01 NEER(impulse)-CPI(response)
1st sub-period: 1992:01-2007:07
2nd sub-period: 2007:08-2013:01 NEER(impulse)-IP(response)
1st sub-period: 1992:01-2007:07
2nd sub-period: 2007:08-2013:01 NEER(impulse)-IR(response)
1st sub-period: 1992:01-2007:07
2nd sub-period: 2007:08-2013:01 NEER(impulse)-FR(response)
Sweden
1st sub-period: 1993:01-2007:07
2nd sub-period: 2007:08-2013:01 NEER(impulse)-CPI(response)
1st sub-period: 1997:01-2007:07
2nd sub-period: 2007:08-2012:12 NEER(impulse)-IP(response)
1st sub-period: 1993:01-2007:07
2nd sub-period: 2007:08-2013:01 NEER(impulse)-IR(response)
1st sub-period: 1993:01-2007:07
2nd sub-period: 2007:08-2013:01 NEER(impulse)-FR(response)
Iceland
1st sub-period: 2001:01-2007:07
2nd sub-period: 2007:08-2013:01 NEER(impulse)-CPI(response)
1st sub-period: 2001:01-2007:07
2nd sub-period: 2007:08-2012:02 NEER(impulse)-IP(response)
1st sub-period: 2001:01-2007:07
2nd sub-period: 2007:08-2013:01 NEER(impulse)-IR(response)
1st sub-period: 2001:01-2007:07
2nd sub-period: 2007:08-2013:01 NEER(impulse)-FR(response)
Emerging IT economies
Czech Republic
1st sub-period: 1997:01-2007:07
2nd sub-period: 2007:08-2013:01 NEER(impulse)-CPI(response)
1st sub-period: 1997:01-2007:07
2nd sub-period: 2007:08-2012:12 NEER(impulse)-IP(response)
1st sub-period: 1997:01-2007:07
2nd sub-period: 2007:08-2013:01 NEER(impulse)-IR(response)
1st sub-period: 2000:03-2007:07
2nd sub-period: 2007:08-2013:01 NEER(impulse)-FR(response)
Hungary
1st sub-period: 2001:01-2007:07
2nd sub-period: 2007:08-2013:01 NEER(impulse)-CPI(response)
1st sub-period: 2001:01-2007:07
101
Inflation Targeting in Advanced vs. Emerging Economies before and after the Crisis
1st sub-period: 2001:01-2007:07
2nd sub-period: 2007:08-2013:01 NEER(impulse)-IR (response)
1st sub-period: 2001:01-2007:07
2nd sub-period: 2007:08-2013:01 NEER(impulse)-FR(response)
Poland
1st sub-period: 1998:01-2007:07
2nd sub-period: 2007:08-2013:01 NEER(impulse)-CPI(response)
1st sub-period: 1998:01-2007:07
2nd sub-period: 2007:08-2013:01 NEER(impulse)-IP(response)
1st sub-period: 1998:01-2007:07
2nd sub-period: 2007:08-2013:01 NEER(impulse)-IR(response)
1st sub-period: 2000:07-2007:07
2nd sub-period: 2007:08-2013:01 NEER(impulse)-FR(response)
Chile
1st sub-period: 1999:01-2007:07
2nd sub-period: 2007:08-2013:01 NEER(impulse)-CPI(response)
1st sub-period: 1999:01-2007:07
2nd sub-period: 2007:08-2011:12 NEER(impulse)-IP(response)
1st sub-period: 1999:12-2007:07
2nd sub-period: 2007:08-2013:01 NEER(impulse)-IR(response)
1st sub-period: 2000:08-2007:07
2nd sub-period: 2007:08-2013:01 NEER(impulse)-FR(response)
Colombia
1st sub-period: 1999:01-2007:07
2nd sub-period: 2007:08-2013:01 NEER(impulse)-CPI(response)
1st sub-period: 1999:01-2005:03 NEER(impulse)-IP(response)
1st sub-period: 1999:01-2007:07
2nd sub-period: 2007:08-2013:01 NEER(impulse)-IR(response)
1st sub-period: 2000:05-2007:07
2nd sub-period: 2007:08-2013:01 NEER(impulse)-FR(response)
Mexico
1st sub-period: 2001:01-2007:07
2nd sub-period: 2007:08-2013:01 NEER(impulse)-CPI(response)
1st sub-period: 2001:01-2007:07
2nd sub-period: 2007:08-2013:01 NEER(impulse)-IP(response)
1st sub-period: 2001:01-2007:07
2nd sub-period: 2007:08-2013:01 NEER(impulse)-IR(response)
1st sub-period: 2001:01-2007:07
2nd sub-period: 2007:08-2013:01 NEER(impulse)-FR(response)
Peru
1st sub-period: 2002:01-2007:07
2nd sub-period: 2007:08-2013:01 NER(impulse)-CPI(response)
1st sub-period: 2002:01-2007:07
2nd sub-period: 2007:08-2012:10 NER(impulse)-IP(response)
1st sub-period: 2002:01-2007:07
2nd sub-period: 2007:08-2013:01 NER(impulse)-IR(response)
1st sub-period: 2002:01-2007:07
2nd sub-period: 2007:08-2012:12 NER(impulse)-FR(response)
Brazil
1st sub-period: 1999:01-2007:07
2nd sub-period: 2007:08-2013:01 NEER(impulse)-CPI(response)
1st sub-period: 1999:01-2007:07
2nd sub-period: 2007:08-2013:01 NEER(impulse)-IP(response)
1st sub-period: 1999:01-2007:07
2nd sub-period: 2007:08-2013:01 NEER(impulse)-IR(response)
1st sub-period: 1999:01-2007:07
2nd sub-period: 2007:08-2013:01 NEER(impulse)-FR(response)
Note: According to the available data, we made several changes regarding the types of time series that we used for our analysis: (1) Hungary: Interest rate (IR)-Discount rate; (2) Chile: Consumer price index (CPI)-Percent change over corres-ponding period of previous year; (3) Peru: NER-Nominal exchange rate; (4) Chile, Colombia, Peru: Industrial production (IP)-Manufacturing.
102 Kosta Josifidis, Emilija Beker Pucar, Slađana Srdić and Gabriela Ivan
Table 2 Results of Stationary Testing (Level)
Time series Period ADF KPSS DF-GLS Lag Conclusion
Australia 1993:01-2013:01
NEER-
1993:01-2013:01 -1.052682 (-11.15902) -0.017824 (-5.705641) 1.262185
(0.067357) 4 I(1) IR- 1993:01-2013:02 (-5.813875) -2.718141 (-5.823783) -2.524099 (0.061522) 0.438049 4 I(1)
FR- 1993:01-2012:12 (-14.49529) -1.590237 (-6.356941) -0.267228 (0.074734) 1.663535 4 I(1) New Zealand
1990:01-2013:01
NEER- 1991:01-2013:01 (-12.37970) -1.789084 (-12.30126) -1.252708 (0.064927) 0.622838 4 I(1)
IR- 1991:01-2013:01 (-14.05875) -2.257303 (-14.03228) 0.123819 (0.068026) 0.924579 4 I(1)
FR-
1991:01-2013:02 -2.456014 (-14.21112) -1.605073 (-16.49915) 0.357867
(0.045100) 4 I(1)
Canada 1991:01-2013:01
NEER- 1991:01-2013:01 (-13.33411) -0.557205 (-11.75862) -0.356877 (0.178703) 1.454336 4 I(1)
CPI- 1991:01-2013:01 -2.448245 0.715851 0.088729 4 I(0)
IP-
(seasonally adj.) 1995:01-2012:11 -0.965350 (-14.50451) 0.421733 (-14.56254) 0.462342
(0.030128) 4 I(1) IR- 1991:01-2013:01 (-12.17393) -2.566938 (-0.185669) 0.286508 (0.191714) 1.555320 4 I(1)
FR-
1991:01-2013:02 -0.070725 (-10.89279) 0.555479 (-0.758264) 1.879236
(0.110221) 4 I(1)
Norway 2001:01-2013:01
NEER- 2001:01-2013:01 (-9.300783) -3.045299 (-9.191241) -0.976935 (0.045857) 0.700074 4 I(1)
CPI- 2001:01-2013:02 -3.613330 -2.193363 0.169444 4 I(0)
IP-
(seasonally adj.) 2001:01-2013:01 -1.341420 (-13.46821) -0.400879 (-0.735883) 1.365626
(0.382288) 4 I(1) IR-
2001:01-2009:07 -1.327237 (-5.867421) -0.322876 (-5.857654) 0.394814
(0.133077) 4 I(1) FR- 2001:01-2013:01 (-14.57938) -1.674714 (-2.790301) -0.336907 (0.172059) 0.912568 4 I(1) UK
1992:01-2013:01
NEER-
(seasonally adj.) 1992:01-2013:01 -1.405383 (-12.48028) -1.095685 (-12.48474) 0.415806
(0.124321) 4 I(1) CPI- 1992:01-2013:02 (-16.41517) -3.206952 (-16.44741) -1.007537 (0.170844) 0.543372 4 I(1)
IP-
(seasonally adj.) 1992:01-2013:01 -1.341937 (-5.098317) -0.814090 (-1.107159) 0.464031
(0.369000) 4 I(1) IR- 1992:01-2013:02 (-23.70657) -2.242944 (-1.874170) 0.555998 (0.081042) 1.434027 4 I(1)
FR- 1992:01-2013:02 (-13.84692) -0.364543 (-13.81415) -0.624546 (0.364195) 0.752675 4 I(1) Sweden
1993:01-2013:01
NEER-
(seasonally adj.)
1993:01-2013:01 -2.841773 -2.030287 0.189750 4 I(0) CPI-
1993:01-2013:02 -1.935225 1.520455 0.143763 4 I(0) IP-
(seasonally adj.) 1997:01-2012:12 -2.685148 (-2.969059) -1.055963 (-2.426597) 0.824738
103
Inflation Targeting in Advanced vs. Emerging Economies before and after the Crisis
FR- 1993:01-2013:02 (-17.79550) -0.447717 (0.006607) -0.653078 (0.450808) 1.237201 4 I(1) Iceland
2001:01-2013:01
NEER- 2001:01-2013:01 (-7.758208) -0.646262 (-7.781115) -0.060777 (0.166974) 1.057688 4 I(1)
CPI-
2001:01-2013:02 -2.431587 -2.188288 0.283022 4 I(0) IP-
(seasonally adj.) 2001:01-2012:02 0.539907 (-7.804372) 2.323324 (-7.629513) 1.404240
(0.197623) 4 I(1) IR- 2001:01-2013:02 -1.944916 -1.512022 0.295140 4 I(0)
FR- 2001:01-2013:02 (-11.85785) -1.046698 (-11.56526) 0.432128 (0.120966) 1.371236 4 I(1) Czech R.
1997:01-2013:01
NEER-
1997:01-2013:01 -0.543349 (-11.62349) 1.627371 (0.096090) 0.233193
(-5.994246) 4 I(1) CPI-
1997:01-2013:01 -2.638805 (-4.467487) 0.156508 (0.151500) -1.470687
(-3.484197) 4 I(1) IP-
(seasonally adj.) 1997:01-2012:12 -1.238258 (-8.372588) 1.549010 (0.220243) -0.027430
(-1.295496) 4 I(1) IR- 1997:01-2013:01 (-3.107321) -2.170390 (0.177735) 1.074160 (-3.080047) 0.062413 4 I(1)
FR- 2000:03-2013:01 (-14.67474) -1.413055 (0.056217) 0.311207 (-14.54198) -0.944810 4 I(1) Hungary
2001:01-2013:01
NEER-
2001:01-2013:01 -2.726568 (-9.004553) 0.585592 (0.117945) -2.112051
(-8.630705) 4 I(1) CPI- 2001:01-2013:01 -3.465501 0.097170 -3.174489 4 I(0)
IP-
(seasonally adj.) 2001:01-2013:01 -1.487072 (-19.80010) 0.978391 (0.083809) -0.455483
(-1.478427) 4 I(1) IR- 2001:01-2013:01 (-9.993212) -1.738101 (0.039178) 0.748073 (-10.01661) -0.620190 4 I(1)
FR- 2001:01-2013:01 (-12.49181) -2.656918 (0.072163) 0.128891 (-9.715176) -2.412774 4 I(1) Poland
1998:01-2013:01
NEER- 1998:01-2013:01 -3.052781 0.251231 -3.046096 4 I(0)
CPI- 1998:01-2013:01 (-8.987458) -2.534990 (0.224877) 0.195925 (-1.602216) -0.803975 4 I(1)
IP-
(seasonally adj.) 1998:01-2013:01 -1.615727 (-3.242074) 1.715892 (0.110062) 0.468541
(-1.989523) 4 I(1) IR- 1998:01-2013:01 (-5.692569) -2.545207 (0.062061) 0.304830 (-1.343745) -1.111690 4 I(1)
FR-
2000:07-2013:01 -3.243293 (-14.33863) 0.147233 (0.063712) -2.232192
(-13.87957) 4 I(1)
Chile 1999:01-2013:01
NEER- 1999:01-2013:01 (-9.789686) -2.701618 (0.148266) 0.306374 (-9.537728) -1.784491 4 I(1)
CPI- 1999:01-2013:01 -3.267826 0.076915 -3.356949 4 I(0)
IP-
(seasonally adj.) 1999:01-2011m12 -1.556637 (-14.51579) 1.342784 (0.325191) 0.616380
(-5.605768) 4 I(1) IR-
1999:12-2013:01 -2.639811 (-11.23255) 0.289314 (0.141769) -1.751336
(-2.247957) 4 I(0) FR- 2000:08-2013:01 (-13.96038) -2.011945 (0.035890) 0.318372 (-13.44261) -1.483311 4 I(1) Colombia
1999:01-2013:01
104 Kosta Josifidis, Emilija Beker Pucar, Slađana Srdić and Gabriela Ivan
CPI- 1999:01-2013:01 (-7.695764) -1.172040 (0.023000) 0.377065 (-1.923805) -1.110400 4 I(1)
IP-
(seasonally adj.)
1999:01-2005:03
-2.235639 (-11.72272)
1.074907 (0.208262)
0.957571
(0.038785) 2 I(1) IR-
1999:01-2013:01
-0.971374 (-8.646995)
0.891855 (0.466845)
0.495098
(0.368877) 4 I(1) FR- 2000:05-2013:01 (-11.30705) -1.970904 (0.049287) 0.137559 (-10.95647) -1.940377 4 I(1) Mexico
2001:01-2013:01
NEER- 2001:01-2013:01 (-8.577697) -1.583933 (0.064408) 1.220145 (-7.915955) -0.538277 4 I(1)
CPI- 2001:01-2013:01 -4.557831 0.094122 -2.568998 4 I(0)
IP-
(seasonally adj.)
2001:01-2013:01
-0.411406 (-13.75207)
1.056542 (0.091452)
0.221305
(-3.962636) 4 I(1) IR- 2001:01-2013:01 (-8.816399) -4.760108 (0.290724) 0.923655 (-1.709391) 0.067607 4 I(0)
FR- 2001:01-2013:01 (-11.40325) -2.017663 (0.061241) 0.132024 (-10.91555) -2.050692 4 I(1) Peru
2002:01-2013:01
NER- 2002:01-2013:01 (-11.53993) -0.244410 (0.066048) 1.375167 (-11.56069) 0.861259 4 I(1)
CPI- 2002:01-2013:01 (-8.071228) -2.292459 (0.051953) 0.134969 (-7.643807) -2.231579 4 I(1)
IP-
(seasonally adj.)
2002:01-2012:10
-2.601585 (-16.28207)
0.152344 (0.040159)
-2.302735
(-16.30947) 4 I(1) IR- 2002:01-2013:01 -2.637790 0.148339 -2.190985 4 I(0)
FR- 2002:01-2012:12 (-10.53462) -1.844294 (0.074325) 0.104667 (-4.265794) -1.395035 4 I(1) Brazil
1999:01-2013:01
NEER- 1999:01-2013:01 (-12.14454) -12.14454 (-1.036158) -1.036158 (0.163389) 0.163389 4 I(1)
CPI- 1999:01-2013:02 -3.094870 -0.849183 0.313064 4 I(0)
IP-
(seasonally adj.)
1999:01-2013:01
-1.362575 (-11.61528)
0.440620 (-4.734707)
1.540818
(0.040896) 4 I(1) IR-
(seasonally adj.)
1999:01-2013:02
-6.370763 (-8.412272)
-1.156911 (-1.006341)
1.333402
(0.066196) 4 I(1) FR- 1999:01-2013:02 (-13.69262) -1.969163 (-13.70569) -1.265143 (0.105727) 0.282928 4 I(1)
Note: In the model which includes both deterministic components, the critical values are: -3.43, 0.146, -2.95 for the ADF, KPSS and DF-GLS tests respectively, while the determination of stationarity about nonzero mean values is calculated by
using the following values: -2.88, 0.46 and -1.94. Label t refers to the model which includes both deterministic components,
while refers to the model which contains only constant. Values in brackets refer to the first difference of the observed
time series.
105
Inflation Targeting in Advanced vs. Emerging Economies before and after the Crisis
Table 3 Results of Johansen’s Cointegration Test
Combination of I(1) time
series Lag Trace statistics Conclusion
Australia 1993:01-2013:01
NEER and IR 1_4 11.65846 No cointegration at the 5% significance level. 0.083759
NEER and FR 1_4 6.750278 No cointegration at the 5% significance level. 1.941848
New Zealand 1990:01-2013:01
NEER and IR 1_4 10.69148 No cointegration at the 5% significance level. 2.052492
NEER and FR 1_4 7.016600 No cointegration at the 5% significance level. 0.031280
Canada 1991:01-2013:01
NEER and CPI The presence of cointegration is not tested, since the CPI is I(0).
NEER and IP 1_4 37.40364 2 cointegration equations at the 5% significance level. 6.367794
NEER and IR 1_4 13.52676 No cointegration at the 5% significance level. 0.476860
NEER and FR 1_4 3.952226 No cointegration at the 5% significance level. 0.064014
Norway 2001:01-2013:01
NEER and CPI The presence of cointegration is not tested, since the CPI is I(0).
NEER and IP 1_4 12.68778 No cointegration at the 5% significance level. 0.241325
NEER and IR 1_4 15.98129 2 cointegration equations at the 5% significance level. 5.709205
NEER and FR 1_4 12.45605 No cointegration at the 5% significance level. 2.883785
UK
1992:01-2013:01
NEER and CPI 1_4 22.33134 1 cointegration equation at the 5% significance level. 2.492182
NEER and IP 1_4 22.06677 1 cointegration equation at the 5% significance level. 1.086072
NEER and IR 1_4 8.458180 No cointegration at the 5% significance level. 3.006600
NEER and FR 1_4 9.650116 No cointegration at the 5% significance level. 0.048307
Sweden 1993:01-2013:01
NEER and CPI
The presence of cointegration is not tested, since NEER is I(0). NEER and IP
NEER and IR NEER and FR
Iceland 2001:01-2013:01
NEER and CPI The presence of cointegration is not tested, since the CPI is I(0).
NEER and IP 1_4 6.493190 No cointegration at the 5% significance level. 0.023096
NEER and IR The presence of cointegration is not tested, since the IR is I(0).
NEER and FR 1_4 6.751589 No cointegration at the 5% significance level. 0.895284
Czech Republic 1997:01-2013:01
NEER and CPI 1_4 25.43239 1 cointegration equation at the 5% significance level. 3.575973
NEER and IP 1_4 15.16425 No cointegration at the 5% significance level. 1.739095