A Work Project, presented as part of the requirements for the Award of a Masters Degree in Finance from the Faculdade de Economia da Universidade Nova de Lisboa
Stops and Bonanzas in the EU: Does Being Part of the Euro Area Make a Difference?
Maria Madalena Godinho de Sampaio Rodrigues 740
A Project carried out on the Finance course, with the supervision of: Professor Miguel Lebre de Freitas and Professor Luís Catela Nunes
Stops and Bonanzas in the EU: Does Being Part of the Euro Area Make a Difference?
Abstract
In this paper, we investigate whether being part of the euro area influences the conditional probability of going through a sudden stop or a bonanza of capital flows. Our sample period is from 1995 until 2014. We identify these two phenomena and we evaluate which push and pull factors help predict the conditional probability of experiencing one of them. We find that most countries had significant capital inflows until 2008 and that there were more sudden stops during the recent financial crisis than in any other moment in our sample. The factors that better help forecast the conditional probability of a sudden stop are global uncertainty (represented by the push factor
“Volatility Index”), and the domestic economic activity (pull factors “GDP growth” and
“consumer confidence”). An indicator of country risk (pull factor “change in credit rating”) is the most significant one for predicting bonanzas. Ultimately, we find no evidence that being part of the euro area influences the conditional probability of going through a sudden stop or a bonanza.
Contents 1. Introduction
2. A Brief Literature Review
A. Sudden Stops and Bonanzas
B. Determinants of Capital Flows: Push and Pull Factors 3. Identifying Sudden Stops and Bonanzas
4. Uncovering the Determinants of Capital Flows A. Data and Methodology
B. Empirical Results 5. Concluding Remarks
1
1. Introduction
High capital mobility creates challenges to policy makers (Calvo and Reinhart, 1999; Calvo, 2003). Bonanzas of capital flows consist in large and rapid increases of foreign capital inflows (Reinhart and Reinhart, 2008), which can lead to lending booms and a rise in asset prices. They can also be followed by a sudden stop of capital flows. These sudden stops, on the other hand, are large and unexpected reductions in international capital flows (Calvo, 2003), which can limit the financing sources and, therefore, affect the total amount of output produced by an economy (Cúrdia, 2008). Moreover, they origin bankruptcies, currency or banking crisis and decrease the productivity of the existing capital stock (Calvo and Reinhart, 1999; Caballero and Krishnamurthy, 2004; Calvo, 1998).
2 area let the countries more vulnerable and exposed to these capital flow reversals (e.g Paul de Grauwe, 2011)1. Still, none of the existing literature actually formally tested if being part of the euro area amplified these vulnerabilities. Therefore, in our paper we contribute to the literature by analyzing if being part of the euro area influences the conditional probability of a sudden stop or of a bonanza, distinguishing between euro and non-euro countries. In contrast to previous studies which focus in a broad variety of countries or only in emerging economies, we focus on all European Union countries from 1995 until 2014. We follow the methodology of Merler and Pisani-Ferry (2012) to identify these extreme capital flow movements, and we test for the most relevant push and pull factors that explain them following the approach suggested by Forbes and Warnock (2011). We then add a dummy variable for the euro area to test the hypothesis of whether being part of the euro area influences (or not) the probability of a sudden stop or of a bonanza. In line with the existing literature, we divided the determinants of capital flows into push - external variables outside the country’s control - and pull factors - related to domestic economic conditions and policies- (e.g Calvo, Leiderman and Reinhart, 1993).
We discover that there were significant capital inflows for most EU countries until 2008 and that there were more sudden stops during the recent financial crisis than in any other moment in our sample, although the precise timing in which these sudden stops occurred varied across countries. Moreover, almost all countries had a huge drop in private capital inflows at some point between 2008 and 2012, even though some of them did not reach a sudden stop. We also find evidence that proportionally, euro countries experienced more bonanzas, but also more sudden stops, than the non-euro
1“
Because of the liquidity flows triggered by changing market sentiments, member countries of a monetary union
become vulnerable to these market sentiments. These can lead to “sudden stops” in the funding of the government
3 ones. In addition, we test which push and pull factors are more important in determining the conditional probability of going through one of these phenomena. We find that
global uncertainty (represented by the push factor “Volatility Index”) and the domestic
economic activity (pull factors “GDP growth” and “consumer confidence”) are the most consistently significant factors to predict the probability of experiencing a sudden stop. On the other hand, the indicator of country risk (pull factor “change in credit rating”) is the one that better helps forecast bonanzas. Our findings are accordingly to the recent theoretical literature that argues that global risk is the main source of crises, but suggest that in this particular period global liquidity has not been a major driver of capital flows. Ultimately, we find no evidence that being part of the euro area influences the probability of going through a sudden stop or a bonanza.
As to the structure of the paper, section 2 reviews the literature on sudden stops, bonanzas and push and pull factors, as determinants of capital flows; section 3 focuses on our identification of sudden stops and bonanzas; section 4 reports the estimation strategy used to discover what are the most relevant push/pull factors, the results associated with it and the sensitivity tests performed; and section 5 presents the final remarks.
2. A Brief Literature Review A. Sudden Stops and Bonanzas
Economic theory argues that free capital movement across countries is beneficial since it leads to an efficient allocation of resources, faster capital accumulation, technological catch up and economic growth. Nevertheless, large fluctuations of capital flows can also create challenges for policy makers (Calvo and Reinhart, 1999; Calvo, 2003).
4 increase in the asset prices, lending booms and financial risks. Moreover, since they are temporary events, they can eventually end up in sudden stops (Montiel, 2003).
Calvo (2003) described sudden stops as large, clear and unexpected reductions in international capital flows. These phenomena limit the financing sources and, therefore, affect the total amount of output produced by an economy (Cúrdia, 2008). After going through a sudden stop, the country needs to adjust through a reversal of the current account (unless it receives a large balance of payments assistance), which in general comes with a contraction of the economic activity. Often, central banks are induced to raise interest rates in order to reduce the drain of capital (Caballero and Krishnamurthy, 2004). Moreover, sudden stops can origin bankruptcies, currency or banking crisis and decrease the productivity of the existing capital stock (Calvo and Reinhart, 1999; Caballero and Krishnamurthy, 2004; Calvo, 1998). These phenomena also lead to monetary policy challenges by causing higher volatility of inflation, output and interest rates (Fraga et al, 2003).
Merler and Pisani-Ferry (2012) analyzed extreme capital flow movements for Spain, Greece, Ireland, Portugal and Italy, and found that all of these countries experienced sudden stops at some point between 2002 and 2011. In particular, they showed that sudden stops were concentrated in 2008, the spring of 2010 and the second half of 2011. Alcidi and Gros (2013) considered only GIIPS (Greece, Ireland, Italy, Portugal and Spain) and BELL (Bulgaria, Estonia, Latvia and Lithuania) countries, and found that non-euro countries had a shorter and more acute adjustment after a sudden stop than the euro ones. They argued that the main possible causes for this difference were the availability of credit, and different fiscal policies and patterns of bank ownership.
B. Determinants of Capital Flows: Push and Pull Factors
5 prices. Pull factors, on the other hand, are related to domestic economic conditions,
policies and performance, as well as the country’s institutions and creditworthiness.
Calvo, Leiderman and Reinhart (1993) were pioneers in discussing the determinants of capital flows and distinguishing between push and pull factors. They believed it were push factors (such as a decrease in interest rates and recession in some industrial countries) that drove capital flows to emerging economies. Fernandez-Arias (1996) argued about the importance of push factors (in particular, low US interest rates) in the evolution of capital flows to emerging economies, stating that these low international interest rates allowed some highly-indebted countries to improve their creditworthiness and increase their capital inflows. Conversely, other authors considered that capital flows for emerging economies were instead more driven by pull factors (see for example, Mody, Taylor and Kim, 2001; Dasgupta and Ratha, 2000). Montiel and Reinhart (1999) stressed that these two factors were complementary for developing countries: push factors determined the timing and scale of the flows, while pull factors determined their geographical distribution.
6 3. Identifying Sudden Stops and Bonanzas
The first step of our investigation is to identify episodes of bonanzas and of sudden stops in our sample, which consists in all EU countries from 1995 to 2014. In doing so, we first need to define a measure of capital flows in which our calculations will be based. We follow the methodology of Merler and Pisani-Ferry (2012) who constructed a measure of “private” capital inflows which consisted in the financial account as a whole, net of official inflows from changes in Target 2 balances and assistance under IMF/EU programs (refer to table 1 in appendix for alternative measures of private capital inflows). This measure allows us to get a better understanding of the capital flows during this period and to get more realistic results. Unlike Merler and Pisani-Ferry (2012), we use quarterly data for the financial account obtained from Eurostat, since most of the sources that had this data available for all EU countries only offered this or annual frequency. The monthly values for Target 2 balances are from the
“Eurocrisis Monitor” and were adapted to quarterly data by assigning the values
available for March, June, September and December to the first, second, third and fourth quarters, respectively. We consider this data from the earliest period available, even though it is not the same for all European countries. The inflows from assistance under IMF/EU programs are from the European Commission and the IMF. They were also only available at a monthly frequency, so we adapted them to quarterly data by grouping them together. Data on IMF disbursements were on SDRs and were converted to Euros using end of period exchange rates. We take into account all the countries that
are currently part of the European Union, even though some of them weren’t at the
7
-90,0% -40,0% 10,0% 60,0% 110,0%
Figure 1 represents this for Portugal and Cyprus and also offers evidence about the sudden stops and bonanzas that they experienced. The remaining graphs are reported in appendix.
Figure 1: Total and Private Capital Inflows, Cumulated (in % of 2007 GDP)
Note: The blue line represents total inflows and the red line stands for “private” capital inflows. Source: Own calculations based on data taken from Eurostat, Euro Crisis Monitor, the IMF and the European
Commission.
These cumulative graphs show that Cyprus experienced a drop in “private” capital inflows during the second quarter of 2008, and that Portugal also suffered a tremendous decrease in these inflows in the first quarter of 2010.
Looking at the cumulative graphs of all EU countries, some of them always presented financial account surpluses between 1995 and 2014. Denmark, Germany, Luxembourg, Netherlands, Austria, Finland and Sweden had financial account deficits at some point. Our measure of “private” capital inflows suggests that most countries experimented significant capital inflows until the 2008 financial crisis and that a lot of them had sudden stops and capital outflows afterwards, as a result of the economic environment. The outflows were particularly large for southern European countries such as Portugal, Greece, Ireland, Italy, Spain and Cyprus. The outflows were also significant, although smaller, for countries like Bulgaria, Estonia, Lithuania, Latvia, Hungary and Romania. The exact time in which the reversals occur, though, differs across countries. In Greece,
Cyprus
8 Ireland, Latvia and Hungary outflows started earlier (2008/2009), while in Portugal, Spain and Italy outflows began in 2010/2011.
Note that some of the bonanzas and sudden stops that we identify are a reflection of what was going on in other countries. That is, some countries (like Sweden,
Netherlands, Germany, Finland, Belgium, Austria, Luxembourg) experienced “surges”
during the 2008 financial crisis because the capital that was flowing out of some countries went to these ones that were not in such bad conditions. Similarly, in 2013,
Germany, Netherlands and Finland had a “sudden stop” due to the improved conditions
that were felt in the periphery countries and that made capital flow from the former to these ones.
Having defined a measure of “private” capital flows, we now use the methodology
proposed by Calvo et. al (2004) to identify the episodes of bonanzas and of sudden stops in our sample. Although, there are many alternative definitions of sudden stops and bonanzas (see table 2 in appendix for a detailed description of these definitions), we choose Calvo et. al’s (2004) approach because it allows us to detect the moment in which a sudden stop or surge occurred and their duration, (Merler and Pisani-Ferry, 2012), and also because it captures the “unexpected” and “persistent” part of these phenomena (Calvo et. al, 2004).
Following Calvo et al. (2004), we define a criterion to identify surges and sudden stops based on a threshold: a sudden stop starts when the year-over-year change in “private” capital inflows goes through the one standard deviation (bellow its historical rolling
mean) line (“unexpected” part of a sudden stop) and it ends when it crosses back that
9 standard deviation above the historical rolling mean. Although Calvo et al.(2004) used monthly data, we adapted it to fit our quarterly data, following Forbes and Warnock (2011). First, we compute a 4-quarter moving sum of St and year-over-year changes in St. Then, we calculate historical rolling means and standard deviations of these year-over-year changes in St over the last twenty quarters. Since we compute historical rolling means and standard deviations over the last twenty quarters, we can only identify these phenomena from the third quarter of 2001 until 2014. For some countries, however, the identification starts a bit after 2001 because the necessary data to calculate private capital inflows is only available after 1999 (refer to table 3 in appendix for a thorough description of the period representation).
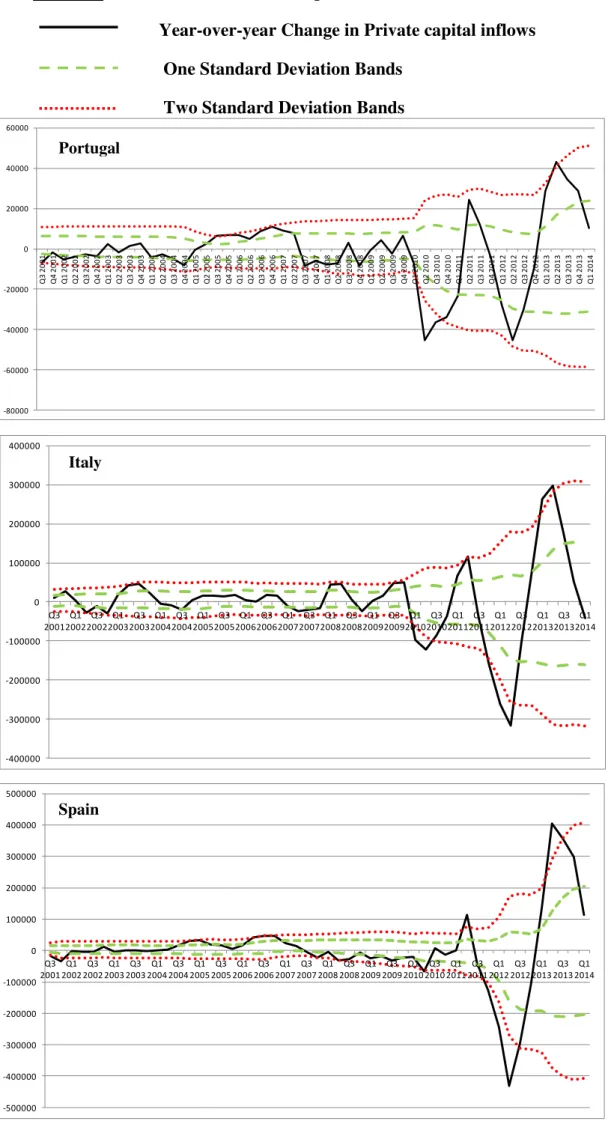
Figure 2 shows the year-over-year changes in “private” capital inflows and the corresponding thresholds for Spain and Latvia, using Calvo et. al’s (2004) approach. The remaining graphs are presented in appendix.
Figure 2: Construction of Sudden Stops and Bonanzas
Spain
10 These graphs suggest that during the recent financial crisis, Spain experienced a sudden stop from the fourth quarter of 2011 until the third quarter of 2012, and a “bonanza” between the first quarter of 2013 and the fourth quarter of 2013. Latvia, on the other hand, had a sudden stop from the second quarter of 2008 until the first quarter of 2010. Through the analysis of these graphs and the ones in appendix it is evident that almost all countries had a huge drop in “private” capital inflows at some point between 2008 and 2012, even though some of them did not reach a sudden stop. Moreover, the graphs show that “private” capital inflows were much less volatile before the 2008 financial crisis.
Besides the previously mentioned measure of “private” capital inflows (baseline
measure), we computed one which excludes foreign direct investment (FDI), since it is argued that this type of capital flow is driven by long term profit opportunities and, hence, less likely to be disturbed by short term changes in market sentiment (Levchenko and Mauro, 2006). When we took FDI from our measure of “private” capital inflows, the periods of sudden stop and bonanza changed significantly for several countries, and we identified much more periods of bonanzas than with the baseline measure.
Taking into account the baseline measure of “private” inflows, figure 3 represents the number of countries that experienced sudden stops (red bars) and surges (green bars) in each quarter.
Note: The black line represents the year-over-year change in “private” capital inflows, the red line stands for the two standard deviation threshold and the green one for the one standard deviation threshold.
11 Figure 3: Countries in Sudden Stop and Bonanza
This figure shows that there was a tremendous increase in sudden stops during the 2008 crisis. Moreover, there were more countries experiencing sudden stops in the first quarter of 2010 and more experiencing surges in the second and fourth quarters of 2006 and second quarter of 2007. The graph for the measure of “private” capital inflows without FDI was similar to this one. Figure 4 shows two analogous charts in which we separated the EU between euro and non-euro countries.
Figure 4: Euro and Non-Euro Countries in Sudden Stop and in Bonanza (in % of total EU countries)
Euro Countries
12 These last two graphs show that there were more euro countries experiencing bonanzas, but also more sudden stops than the non-euro ones between 2001 and 2014.
Table 3 in appendix presents an exhaustive list of all sudden stops, surges and respective dates for each country between 2001 and 2014. From this table, we are able to distinguish a number of “waves” in terms of capital inflows and capital flow reversals. These “waves” were 2001 and 2002: The terrorist attacks to the US, the increase in oil prices, and the burst of the dot-com bubble in 2000 deeply affected the EU countries. As a result, capital started flowing out of some EU countries; 2003 to 2006: In May 2004, ten new members (Estonia, Latvia, Lithuania, Poland, Czech Republic, Hungary, Slovakia, Slovenia, Cyprus, Malta) joined the EU. Due to the positive expectations from this adhesion and the favorable economic environment, they experienced bonanzas.2 Also, countries like Bulgaria and Romania had a surge of capital inflows due to successful economic policies that were implemented and an increasingly secure EU accession in the near future; 2007: Given the attractive economic conditions, some countries were experiencing a boom by 2007, with surges of
2
Although we aren’t able to identify surges for all of these countries through Calvo et. al’s (2004)
method, we observe in the cumulative graphs that private capital inflows continue to rise during this period.
Non- Euro Countries
Source: Own calculations based on data taken from Eurostat, Euro crisis monitor, the IMF and the European
13 capital flows, unsustainable growth, strong leveraging and the development of bubbles in the real estate sector. This started to give rise to large imbalances, financial vulnerabilities and overheating; 2008 and 2009: After the Lehman-Brothers bank filed for bankruptcy, many EU countries experienced a sharp reversion of capital flows due to a decrease in demand and output; 2010: From 2009 to 2010, financial market conditions improved and a small and uneven recovery started to take place due to exceptional crisis measures that were implemented. Nevertheless, Greece, Portugal and Ireland asked for external help; 2011 and 2012: The international economic conditions deteriorated and the sovereign debt crisis aggravated, causing more capital outflows; 2013: Some of the periphery countries of the EU that had entered a recession in 2008 started to show signs of recovery and, consequently, experienced a “surge” in capital flows.
4. Uncovering the Determinants of Capital Flows A. Data and Methodology
After discovering the sudden stops and surges that occurred between 2001 and 2014, we assess which push and pull factors better help forecast the conditional probability of going through one of these phenomena and, ultimately, if being part of the euro area influenced it.
We decide to choose Germany, the United Kingdom and the United States as the
“center economies”, where capital is flowing from. Hence, these are the countries
considered for the push factors.
14 and strength of the financial system (Forbes, 2010); financial market liberalization (Milesi-Ferretti and Tille, 2010); growth and productivity (Broner et al., 2010). In order to capture some of these different factors, we selected the following variables as push factors: the Volatility Index (VIX) from the Chicago Board Options Exchange as a measure of global risk, and the year-over-year growth in money and quasi-money (M2) as a measure of global liquidity. Although many authors include interest rates among the push factors, we decide not to because they can be a cause but also an effect of sudden stops or bonanzas. In addition, the large interest rate cuts made by Central Banks in response to the 2008 financial crisis would change the expected sign for the
regression’s coefficient.
As for the pull factors, we focus on a consumer confidence index; the change in sovereign credit rating, which reflects the issuer’s creditworthiness and its ability to meet its debt obligations; public debt to GDP ratio, as an indicator of the country’s fiscal position and leverage; and the real GDP growth.
15 also use the change in public debt because the original variable had a unit root (not stationary). Moreover, in order measure if we have a multicollinearity problem in our regressions, we calculate the correlations between independent variables (see figure 5 in appendix). In our calculations, we assume that the conditional probability of being in a sudden stop or surge today does not depend on being in sudden stop or surge in the previous period.
After having all the necessary data, we initially estimate a probit model following Forbes and Warnock (2011):
(1)
where eit is a dummy variable, equal to one if the country is experiencing a surge or a stop phenomenon in quarter t; θt-1 is a measure of the push factor in the previous quarter; and αi are country dummy variables. At this point, we consider only one push factor at a time and leave the pull factors to be captured in the country dummies. Again following Forbes and Warnock (2011), we estimate equation (1) using a complementary logarithmic since sudden stops and bonanzas do not occur in a regular, but in a skewed way and, therefore, the cumulative distribution function is not symmetric. Moreover, in order to be able to correctly interpret the coefficient results, we compute the marginal effects of the explanatory variables. We can’t simply interpret the coefficients as in a linear regression because in a complementary logarithmic model they are exponential. Afterwards, we use a similar model but with more push and pull factors, to find out specifically which ones are more relevant to explain the probability of going through a
sudden stop or bonanza. That is, we estimate the equation:
(2)
16 Instead of estimating a probit model, Fratzscher (2011), for example, used a factor model with a set of push and pull factors and a financial crisis dummy variable, and Hernández and Rudolph (1997) estimated a model in which the dependent variable was the total long-term private flows in percentage of GNP and the independent variables were economic indicators such as the volatility of the real effective exchange rate and US interest rates.
Note that the number of observations varies between regressions because we have to
exclude from our calculations the countries that don’t have any sudden stops or
bonanzas (the dependent variable is always equal to zero) during the period under analysis. We also perform several sensitivity analysis applying a different estimation method (probit instead of the complementary logarithmic); using additional
“interaction” variables; focusing only in the countries that experienced sudden stops
17
Baseline Without FDI
Sudden Stops Bonanzas Sudden Stops Bonanzas
VIX (risk) 0.0660***
(0.0101)
-0.0267 (0.0389)
0.0527*** (0.0130)
-0.0374 (0.0280)
Country dummies χ2 *** χ2 *** χ2 *** χ2 ***
Observations 1300 1144 1144 1144
M2 growth (liquidity) -0.2032***
(0.0649)
0.1240 (0.1076)
-0.1856** (0.0804)
0.1577* (0.0841)
Country dummies χ2 *** χ2 *** χ2 *** χ2 ***
Observations 1300 1144 1144 1144
B. Empirical Results
The table below shows the results obtained for regression (1) for both phenomena.
It reports the respective marginal effects, standard deviations (in brackets) and
significance levels for each variable. We also compute a joint significance test for the country dummies. Considering our baseline measure of “private” capital inflows, VIX and M2 growth are highly significant when predicting sudden stops, but not significant for surges. VIX presents a marginal effect of 0,0660 for sudden stops, which indicates that for each unit increase in VIX, the conditional probability of going through a sudden stop goes up by an estimated 6,6%, ceteris paribus. That is, in periods of high volatility and uncertainty, capital is more likely to stop flowing to countries. M2 growth, on the other hand, is negatively correlated with the probability of sudden stops: if there is a one unit increase in the year-over-year growth in M2, the probability of experiencing a sudden stop decreases by 20,32%, ceteris paribus. Since this variable is a measure of global liquidity, it is expected that when it increases (through quantitative
18 Baseline Without FDI
Sudden Stops Bonanzas Sudden Stops Bonanzas
Push Factors
VIX (risk) 0.0285*
(0.0168)
-0.0180 (0.0341)
0.0301* (0.0160)
-0.0302 (0.0275)
M2 growth (liquidity) -0.1529
(0.0935)
0.1206921 (0.1044275)
-0.1480 (0.0927)
0.1624** (0.0769)
Pull Factors
GDP growth (activity) -0.2702**
(0.1209)
0.0702 (0.1841)
-0.2402** (0.1137)
0.0793 (0.1756)
Change in public debt (fiscal position and leverage)
0.0598* (0.0313)
0.0353 (0.0544)
0.0563** (0.0282)
0.0490 (0.0607)
Change in credit rating
(creditworthiness)
-0.0467 (0.1120)
0.4557** (0.1835)
-0.2450** (0.1238)
0.2964* (0.1747)
Euro Area Dummy 0.0474
(0.2931)
-0.2872 (0.2969)
-0.0467 (0.2170)
0.1530 (0.1648)
Observations 1272 1122 1119 1122
easing or an equivalent measure), sudden stops of capital flows to other countries become less frequent. Furthermore, the tests for the country dummies indicate that they are jointly statistically significant in the two regressions. For our “private” capital inflows’ measure “without FDI”, the variable “growth in M2” becomes significant when forecasting bonanzas.
19 Baseline Without FDI
Sudden Stops Bonanzas Sudden Stops Bonanzas
Push Factors
VIX (risk) 0.0321**
(0.0162)
-0.0178 (0.0362)
0.0329** (0.0159)
-0.0316 (0.0342)
M2 growth (liquidity) -0.1127 (0.0998)
0.1139 (0.0974)
-0.1074 (0.0987)
0.1545** (0.0720)
Pull Factors
Consumer confidence
index (activity) -0.0338**
(0.0159)
0.0089 (0.0260)
-0.0304** (0.0159)
0.0111 (0.0277)
Change in public debt (fiscal position and
leverage) 0.0498*** (0.0262) (0.0512)0.0367 (0.0249)0.0474* (0.0594)0.0548
Change in credit rating
(creditworthiness) (0.1061)-0.0641 0.4690** (0.1902) -0.2596** (0.1167) (0.17402)0.3028*
Euro Area Dummy -0.0577
(0.2818)
-0.2935 (0.2863)
-0.0563 (0.1989)
0.1403 (0.1741)
Observations 1241 1116 1088 1116
Considering the baseline measure of “private” capital inflows, we estimate regression (A) and find that VIX, GDP growth and change in public debt are significant in predicting the probability of sudden stops. However, only the change in credit rating is meaningful for bonanzas. The results for regression (B) are similar, with the alternative
variable “consumer confidence index” also being statistically significant for sudden
stops. For both regressions, higher levels of risk are positively associated with sudden stops. On the contrary, higher GDP growth and consumer confidence are negatively connected to them. That is, when there is more growth in the economy or the consumer confidence rises, sudden stops are less likely to occur. We also find evidence that when a country is more publicly indebted, sudden stops’ conditional probability goes up. For the “private” capital inflows’ measure “without FDI”, VIX, GDP growth (or consumer
20 confidence) and the change in public debt remain significant for sudden stops, and the change in credit rating becomes relevant for both types of phenomena, reporting a positive coefficient for bonanzas and a negative one for sudden stops. Therefore, when the change in credit rating decreases by one unit, there is a higher risk of default which discourages capital flows to that country and makes sudden stops more likely. Moreover, for this particular measure, M2 growth is a significant push factor for bonanzas in regressions (A) and (B). We find no evidence that being part of the euro area influences the probability of experiencing a sudden stop or a surge since the “euro
area dummy variable” is never significant.
In order to have a more thorough empirical analysis, we conduct a series of sensitivity tests on the results, to determine if that would modify our conclusions. We discover that forecasting the regressions with a probit (instead of a complementary logarithmic) model gives identical results. In addition, we estimate the regressions with additional
“interaction terms” between the euro area dummy and the pull factors to see if being
part of the euro area along with one of these variables would be significant to predict these two phenomena. We find that in the baseline measure the “interaction” term with
the variable “growth in M2” and the one with “GDP growth” (or “consumer
confidence” for regression B) are highly significant for bonanzas and have a negative coefficient. This negative correlation indicates that if one these indicators varies x, the probability of going through a surge varies less x than compared to the situation in which the country does not belong to the euro area (dummy variable is equal to zero).
Also, the “interaction” with the change in public debt is relevant for forecasting
21 part of the euro area. Furthermore, when focusing exclusively in the crisis period and in the countries that experienced sudden stops during that time, we find no evidence that the euro area dummy variable is significant for predicting these phenomena. This last sensitivity analysis allows us to distinguish between the countries that actually suffered unexpected drops of capital inflows and the ones that only did because they functioned as a “refuge” of capital flows from other countries during the financial crisis.
Finally, we estimate a regression considering only Greece, Ireland, Italy, Portugal, Spain (GIIPS) and Bulgaria, Estonia, Latvia and Lithuania (BELL) following the same approach as Alcidi and Gros (2013). In their paper, they argued that the ECB let the euro countries maintain current account deficits for longer periods, allowing a slower and less sharp correction of the imbalances in the euro area. Hence, they believed that the ECB was the main difference between the adjustment of the euro countries and the non-euro area ones, who didn’t have a similar institution. Our results do not give support to their claim since in this regression, the euro area dummy variable remains insignificant for forecasting the conditional probability of experiencing sudden stops and bonanzas.
5. Concluding Remarks
The recent financial crisis was accompanied by a tremendous increase in capital flow volatility and an exceptional number of sudden stops. There was a reawakening of the debate about these extreme capital flow movements and the factors behind them, with some authors addressing the particular case of the EU. Some of them believed that being part of the euro area let the countries more vulnerable and exposed to these capital flow reversals, but none formally tested it.
22 we estimate which push or pull factors are more important to predict the probability of going through one of these phenomena, following Forbes and Warnock’s (2011). We then add a dummy variable for the euro area to test the hypothesis of whether being part of the euro area influences (or not) the probability of a sudden stop or of a bonanza. Our analysis finds that almost all countries experienced considerable capital inflows from until 2008. Afterwards, they decreased sharply and a lot of countries went through a sudden stop during the financial crisis. The outflows were substantial for periphery countries such as Portugal, Greece, Ireland, Italy and Spain, and for Eastern countries like Bulgaria, Estonia, Latvia, Lithuania, Hungary and Romania. Moreover, through our method we identify several episodes in which most sudden stops and bonanzas are clustered and are able to relate them to the economic environment of that particular moment. As for the push and pull factors, global uncertainty (represented by the push
factor “Volatility Index”) and the domestic economic activity (pull factors “GDP
growth” and “consumer confidence”) are the most consistently significant ones to predict the probability of experiencing a sudden stop. The indicator of country risk (pull
factor “change in credit rating”) is the one that better helps forecast bonanzas. Hence,
23 References
Alberola, Enrique, Aitor Erce, and José María Serena. 2012. “International Reserves and Gross Capital Flows, Dynamics During Financial Stress,” Bank of Spain Working Paper 1211
Alcidi, Cinzia, and Daniel Gros. 2013. “Country Adjustment to a Sudden Stop: Does the
Euro Make a Difference?” European Comission Economic Papers 492
Alfaro, Laura, Sebnem Kalemli-Ozcan, and Vadym Volosovych .2005. “Capital Flows in a Globalized World: The Role of Policies and Institutions,” NBER Working Paper, No 11696
Bacchetta, Philippe, and Eric Van Wincoop. 2010. “On the Global Spread of Risk
Panics.” Mimeo. Paper presented at European Central Bank conference, “What Future
for Financial Globalization” on 09/09/10
Broner, Fernando, Tatiana Didier, Aitor Erçe, and Sergio Schmukler. 2010. “Financial
Crises and International Portfolio Dynamics,” Mimeo
Brunnermeier, Markus. (2009). “Deciphering the Liquidity and Credit Crunch 2007-8,”
Journal of Economic Perspectives 23(1): 77-100
Caballero. Ricardo J., and Arvind Krishnamurthy. 2003. “Inflation Targeting and
Sudden Stops,” NBER Working Paper, No 9599
Caballero, Julian. 2012. “Do Surges in International Capital flows Influence the Likelihood of Banking Crises,” IDB Working Paper Series No. 305
Calderón, César, and Megumi Kubota. 2011. “Sudden stops: Are Global and Local
Investors Alike?” The World Bank Policy Research Working Paper, No 5569
Calvo, Guillermo A., Leonardo Leiderman, and Carmen M. Reinhart. 1993. “Capital Inflows and Real Exchange Rate Appreciation in Latin America: The Role of External
Factors,” IMF Staff Papers, Vol. 40, No. 1
Calvo, Guillermo A. 1998. “Capital Flows and Capital-Market Crises: The Simple Economics of Sudden Stops,” Journal of Applied Economics, Vol. I, No. 1, 35-54 Calvo, Guillermo A., and Carmen M. Reinhart. 1999. “Capital Flow Reversals, the
Exchange Rate Debate and Dollarization,” IMF Staff Papers, Vol 36, Number 3
Calvo, Guillermo A. 2003. “Explaining Sudden Stop, Growth Collapse, and BOP Crisis: The Case of Distortionary Output Taxes,” IMF Staff Papers, Vol 50 Special Issue
24 Calvo, Guillermo A., Alejandro Izquierdo, and Luis-Fernando Mejía. 2008. “Systemic Sudden Stops: The Relevance of Balance-Sheet Effects and Financial Integration,” NBER Working Paper 14026
Chuhan, Punam, Stijn Claessens, and Nlandu Mamingi. 1993. “Equity and Bond Flows to Asia and Latin America,” The World Bank, Policy Research Working Paper, No. 1160
Cuadra, Gabriel, Manuel Ramos-Francia, and José Sidaoui. 2011. “Global Liquidity, Capital Flows and Challenges for Policymakers: the Mexican Experience,” BIS Working Papers No. 57.239
Cúrdia, Vasco. 2008. “Optimal Monetary Policy Under Sudden Stops,” Federal Reserve Bank of New York Staff Reports: 323
Dasgupta, Dipak, and Dilip Ratha. 2000. “What Factors Appear to Drive Private capital inflows to Developing Countries? And How Does Official Lending Respond?” The World Bank, Policy Research Working Papers, No. 2392
Dedola, Luca, and Giovanni Lombardo. 2009. “Financial Frictions, Financial Integration and the International Propagation of Shocks,” Mimeo
De Grauwe, Paul. 2011. “The Governance of a Fragile Eurozone,” CEPS Working Document No. 346
Edwards, Sebastian. 2007, “Capital Controls, Capital Flow Contractions, and Macroeconomic Vulnerability,” NBER Working Paper 12852
Fraga, Arminio, Ilan Goldfajn, and André Minella. 2003. “Inflation Targeting in Emerging Market Economies,” NBER Working Paper 10019
Fratzscher, Marcel. 2011. “Capital Flows, Push Versus Pull Factors and the Global Financial Crisis,” European Central Bank Working Paper Series: 1364
Fernandez-Arias, E. 1996. “The New Wave of Private Capital Inflows: Push or Pull?”
Journal of Development Economics, Vol. 48.
Fernandez-Arias, Eduardo, and Peter J. Montiel. 1996. “The Surge in Capital Flows: An
Analytical Review,” The World Bank Economic Review, Vol. 10, No. 1
Forbes, Kristin. 2010. “Why do Foreigners Invest in the United States?” Journal of International Economics 80(1): 3-21
Forbes, Kristin J., and Francis E. Warnock. 2011. “Capital Flow Waves: Surges, Stop, Flight, and Retrenchment,” NBER Working Paper 17351
García, Pablo, and Claudio Soto. 2004. “Large Hoardings of International Reserves: Are
They Worth It?” Central Bank of Chile Working Papers Nr 299
25 Hernández, Leonardo, and Heinz Rudolph. 1997. “Sustainability of Private capital inflows to Developing Countries: Is a Generalized Reversal Likely?” The World Bank Policy Research Working Paper 1518
Hutchison, Michael M., and Ilan Noy. 2004. “Sudden stops and the Mexican Wave: Currency Crises, Capital Flow Reversals and Output Loss in Emerging Markets,”
Journal of Development Economics 79, 225-248
Kim, Jung Yeon, Ashoka Mody, and Mark P. Taylor. 2001. “Modelling Fundamentals
for Forecasting Capital Flows to Emerging Economies,” International Journal of Finance and Economics 6: 201-216
Kim, Yoonbai. 2000. “Causes of Capital Flows in Developing Countries,” Journal of International Money and Finance 19:235-253
Levchenko, Andrei, and Paolo Mauro. 2006. “Do Some Forms of Financial Flows Help Protect from Sudden Stops?” IMF Working Paper, No. 06/202
López-Mejía, Alejandro. 1999. “Large Capital Flows: A Survey of the Causes, Consequences, and Policy Responses,” IMF Working Paper, No. 99/17
Merler, Silvia, and Jean Pisani-Ferry. 2012. “Sudden Stops in the Euro Area,” Review of Economics and Institutions, Vol. 3 – No. 3
Milesi-Ferretti, Gian Maria and Cédric Tille. 2010. “The Great Retrenchment: International Capital Flows during the Global Financial Crisis,” Mimeo
Montiel, Peter J. 2013. “Capital Flows: Issues and Policies,” IDB Working Paper Series 411
Montiel, Peter J., and Carmen M. Reinhart. 1999. “Do Capital Controls and
Macroeconomic Policies Influence the Volume and Composition of Capital Flows?
Evidence From the 1990s” Journal of International Money and Finance 18: 619-635
Qureshi, Mahvash S., Jonathan D. Ostry, Atish R. Ghosh, and Marcos Chamon. 2011.
“Managing Capital Inflows: The Role of Capital Controls and Prudential Policies,” NBER Working Paper 17363
Reinhart, Carmen R., and Vincent R. Reinhart. 2008. “Capital Flow Bonanzas: An Encompassing View of the Past and Present,” NBER Working Paper 14321
Sula, Ozan. 2006. “Surges and Sudden Stops of Capital Flows to Emerging Markets,” Open Economies Review Vol 21, Issue 4: 589-605
Tayebi, Seyed Komail, and Mehdi Yazdani. 2012. “Determinants of Bonanza
Phenomena and Related Effects on Financial Crises in Emerging Market Countries,”
26
Study Measures
"Capital Flow Bonanzas: An Encompassing View of the Past and Present", Carmen M. Reinhart and Vincent R. Reinhart (2008)
Reserve accumulation minus the current account balance
"Capital Flow Waves: Surges, Stops, Flight and Retrenchment", Kristin J. Forbes and Francis E. Warnock (2011)
Quarterly current account balance minus monthly changes in international reserves
"Private Capital Inflows and the Role of Economic Fundamentals", Vittorio Corbo and Leonardo Hernández (1998)
Sum of foreign direct investment, portfolio equity flows and long-term private debt flows; or consider each of one of them separately
Appendix
27
Study Criteria
"On the Empirics of Sudden Stops", Calvo, Izquierdo, and Mejía (2004)
A sudden stop starts when the year-over-year change in capital flows is one standard deviation bellow its mean, and it ends when it is one standard deviation above its mean. Moreover, the year-over-year change in capital flows must be at least two standard deviations bellow the mean at some point within that interval for the episode to be considered a sudden stop.
"On the Consequences of Sudden Stops", Guidotti, Sturzenegger, and Villar (2004)
This approach states that sudden stops occur when the change in the capital account (divided by GDP) is one standard deviation bellow the mean and bellow 5% of GDP.
"Do Some Forms of Financial Flows Help Protect From Sudden Stops", Levchenko and Mauro (2006)
A sudden stop episode takes place when the financial account balance gets worse by more than 5 percentage points of GDP compared to the period before.
"Capital Flow Bonanzas", Reinhart and Reinhart (2008)
This study identifies bonanzas using a threshold: cutoff of 20th percentile of total net capital flows in percentage of GDP.
"Surges and Sudden Stops of Capital Flows to Emerging Markets", Sula (2006)
There is a period of bonanza when the increase in capital inflows as a percentage of GDP over a 3-year period is greater than 3% and the value of inflows as a percentage of GDP in that year is greater than 3%.
"Overreaction in Capital Flows to Emerging Markets: Booms and Sudden Stops", Agosin and Huaita (2010)
This paper recognizes a surge when the inflows exceed the sample mean by at least one standard deviation and the ratio of capital inflows to GDP is greater than 3%.
28
Baseline Without FDI Countries Start Date Countries Start Date
Austria 1995 Q1 Austria 1995 Q1
Belgium 2002 Q1 Belgium 2002 Q1
Bulgaria 1995 Q1 Bulgaria 1995 Q1
Croatia 1999 Q1 Croatia 1999 Q1
Cyprus 2001 Q1 Cyprus 2001 Q1
Czech Republic 1995 Q1 Czech Republic 1995 Q1
Denmark 1995 Q1 Denmark 1997 Q1
Estonia 1995 Q1 Estonia 1995 Q1
Finland 1995 Q1 Finland 1995 Q1
France NA France NA
Germany 1995 Q1 Germany 1995 Q1
Greece 1995 Q1 Greece 1995 Q1
Hungary 1995 Q1 Hungary 1995 Q1
Ireland 1995 Q1 Ireland 1995 Q1
Italy 1995 Q1 Italy 1995 Q1
Latvia 1995 Q1 Latvia 1995 Q1
Lithuania 1995 Q1 Lithuania 1995 Q1 Luxembourg 2002 Q1 Luxembourg 2002 Q1
Malta 1995 Q1 Malta 1995 Q1
Netherlands 1995 Q1 Netherlands 1995 Q1
Poland 2000 Q1 Poland 2000 Q1
Portugal 1995 Q1 Portugal 1995 Q1
Romania 1995 Q1 Romania 1996 Q1
Slovakia 1995 Q1 Slovakia 1995 Q1 Slovenia 1995 Q1 Slovenia 1995 Q1
Spain 1995 Q1 Spain 1995 Q1
Sweden 1995 Q1 Sweden 1995 Q1
United Kingdom 1995 Q1 United Kingdom 1995 Q1 Table 3: Country and Period Representation
29
Baseline Without FDI
Sudden Stops Bonanzas Sudden Stops Bonanzas
Countries Start Date End Date Start Date End Date Start Date End Date Start Date End Date
Austria
Q3 2008 Q4 2008 Q3 2001 Q3 2009
Q4 2001
Q4 2009 Q2 2003 Q3 2003 Q3 2001 Q2 2008 Q4 2009 Q4 2001 Q2 2008 Q4 2009 Belgium
Q3 2008 Q3 2008 Q1 2009 Q1 2010 -
-Q3 2009 Q4 2012
Q4 2009 Q2 2013
Bulgaria
Q4 2008 Q3 2010 Q1 2005 Q3 2008
Q3 2005 Q3 2009 Q3 2005 Q3 2010 Q4 2005 Q4 2007 Q4 2005 Q4 2008 Croatia
Q2 2009 Q4 2010 - - Q1 2010 Q2 2010 -
-Cyprus
Q4 2008 Q2 2009 Q4 2009 Q2 2010 Q4 2008 Q2 2009
Q4 2007 Q1 2010
Q3 2008 Q2 2010
Czech Republic Q3 2005
Q4 2011
Q2 2006
Q3 2012 Q4 2010 Q2 2011
Q2 2005 Q1 2012
Q1 2006
Q1 2013 Q2 2003 Q1 2004
Denmark Q3 2001 Q4 2011 Q2 2012 Q1 2002 Q4 2011
Q3 2012 -
-Q3 2009 Q3 2011
Q4 2009
Q2 2012 Q3 2005 Q2 2006
Estonia Q2 2005
Q2 2008
Q4 2005
Q1 2010 Q2 2006 Q3 2007 Q1 2005 Q4 2005
Q2 2006 Q1 2012
Q1 2007 Q2 2013
Finland
Q4 2012 Q3 2013 Q1 2009 Q3 2011
Q3 2009
Q2 2012 Q4 2012 Q3 2013
Q3 2008 Q3 2011
Q3 2009 Q2 2012
France NA NA NA NA NA NA NA NA
Germany
Q1 2013 Q4 2013 Q1 2009 Q1 2012 Q3 2009 Q2 2012 Q2 2011 Q1 2013 Q4 2011 Q4 2013 Q3 2001 Q4 2010 Q1 2012 Q4 2001 Q4 2010 Q2 2012 Greece Q3 2001 Q2 2008 Q4 2008 Q2 2010 Q3 2001 Q2 2008 Q3 2009
Q1 2011 Q1 2013 Q4 2013
Q3 2001 Q2 2008 Q2 2010
Q1 2002 Q1 2009
Q1 2011 Q1 2013 Q4 2013
Hungary Q1 2007
Q4 2008
Q4 2007
Q4 2009 -
-Q4 2001 Q4 2008
Q2 2002
Q3 2009 Q4 2002 Q4 2003
Ireland Q3 2008
Q4 2010
Q2 2009
Q2 2011 Q1 2010 Q2 2010
Q4 2002 Q1 2009 Q4 2010 Q3 2003 Q2 2009 Q2 2011 Q1 2004 Q1 2010 Q1 2005 Q2 2010
Italy Q1 2010
Q4 2011 Q3 2010 Q2 2012 Q1 2011 Q4 2012 Q2 2011 Q3 2013 Q2 2002 Q1 2010 Q4 2011 Q2 2002 Q3 2010 Q2 2012 Q1 2008 Q1 2013 Q3 2008 Q3 2013 Latvia
Q2 2008 Q1 2010 Q2 2004 Q4 2005
Q1 2005
Q3 2007 Q2 2008 Q1 2010 Q1 2006 Q3 2007
Lithuania
Q4 2008 Q1 2010 Q1 2006 Q3 2007 Q1 2009 Q1 2010 Q2 2003 Q2 2004
Luxembourg Q3 2010 Q2 2011 Q4 2012 Q3 2010 Q2 2011 Q3 2013 Q2 2009 Q4 2011 Q3 2009
Q2 2012 - - -
-Malta Q3 2001 Q3 2008 Q4 2009 Q1 2014 Q1 2002 Q3 2008 Q3 2010
Q1 2014 Q1 2009 Q3 2009
Q2 2006 Q1 2010
Q1 2007
Q3 2010 Q4 2002 Q1 2003
Netherlands
Q1 2009 Q3 2012
Q3 2009
Q2 2013 Q1 2008 Q4 2008
Q2 2002 Q4 2007 Q3 2012 Q2 2002 Q4 2007 Q2 2013 Q3 2005 Q4 2008 Q2 2006 Q4 2008
Poland Q3 2009 Q2 2010 Q2 2007 Q1 2008 Q4 2009 Q2 2010 Q2 2007 Q1 2009
Portugal
Q1 2010 Q1 2011 Q3 2005 Q1 2013
Q2 2007
Q4 2013 Q1 2010 Q1 2011
Q1 2005 Q1 2013
Q3 2005 Q1 2013
Romania
Q1 2009 Q1 2010 Q3 2005 Q4 2006 Q2 2006 Q4 2007 Q3 2004 Q1 2009 Q2 2005
Q1 2010 Q1 2007 Q3 2008
Slovakia Q1 2007
Q4 2009
Q4 2007
Q2 2010 Q1 2008 Q1 2009 Q1 2012 Q4 2012 Q4 2013 Q1 2014
Slovenia Q3 2001 Q2 2009 Q4 2011 Q4 2001 Q1 2010
Q3 2012 Q2 2008 Q3 2008
Q2 2009 Q3 2011 Q1 2010 Q3 2012 Q3 2003 Q1 2013 Q3 2004 Q1 2014 Spain Q3 2001 Q2 2008 Q2 2010 Q4 2011 Q4 2001 Q3 2008 Q2 2010 Q3 2012 Q2 2006 Q2 2011 Q1 2013 Q4 2006 Q2 2011 Q4 2013 Q3 2001 Q2 2008 Q4 2011 Q2 2002 Q1 2009 Q3 2012 Q3 2004 Q2 2006 Q2 2011 Q1 2013 Q3 2005 Q4 2006 Q2 2011 Q4 2013
Sweden Q3 2009 Q1 2010 Q4 2007 Q1 2009 - - -
-United Kingdom Q1 2003 Q2 2003 Q3 2012 Q1 2013 - - Q1 2007 Q4 2007
34 -9 0 ,0 % -4 0 ,0 % 1 0 ,0 % 6 0 ,0 % 1 1 0 ,0 % Q1 1995 Q4 1995 Q3 1996 Q2 1997 Q1 1998 Q4 1998 Q3 1999 Q2 2000 Q1 2001 Q4 2001 Q3 2002 Q2 2003 Q1 2004 Q4 2004 Q3 2005 Q2 2006 Q1 2007 Q4 2007 Q3 2008 Q2 2009 Q1 2010 Q4 2010 Q3 2011 Q2 2012 Q1 2013 Q4 2013 -9 0 ,0 % -4 0 ,0 % 1 0 ,0 % 6 0 ,0 % 1 1 0 ,0 % Q1 2000 Q3 2000 Q1 2001 Q3 2001 Q1 2002 Q3 2002 Q1 2003 Q3 2003 Q1 2004 Q3 2004 Q1 2005 Q3 2005 Q1 2006 Q3 2006 Q1 2007 Q3 2007 Q1 2008 Q3 2008 Q1 2009 Q3 2009 Q1 2010 Q3 2010 Q1 2011 Q3 2011 Q1 2012 Q3 2012 Q1 2013 Q3 2013 Q1 2014 -9 0 ,0 % -4 0 ,0 % 1 0 ,0 % 6 0 ,0 % 1 1 0 ,0 % Q1 1995 Q4 1995 Q3 1996 Q2 1997 Q1 1998 Q4 1998 Q3 1999 Q2 2000 Q1 2001 Q4 2001 Q3 2002 Q2 2003 Q1 2004 Q4 2004 Q3 2005 Q2 2006 Q1 2007 Q4 2007 Q3 2008 Q2 2009 Q1 2010 Q4 2010 Q3 2011 Q2 2012 Q1 2013 Q4 2013 -9 0 ,0 % -4 0 ,0 % 1 0 ,0 % 6 0 ,0 % 1 1 0 ,0 % -9 0 ,0 % -4 0 ,0 % 1 0 ,0 % 6 0 ,0 % 1 1 0 ,0 % Q1 1995 Q4 1995 Q3 1996 Q2 1997 Q1 1998 Q4 1998 Q3 1999 Q2 2000 Q1 2001 Q4 2001 Q3 2002 Q2 2003 Q1 2004 Q4 2004 Q3 2005 Q2 2006 Q1 2007 Q4 2007 Q3 2008 Q2 2009 Q1 2010 Q4 2010 Q3 2011 Q2 2012 Q1 2013 Q4 2013 Slovak ia Slove n ia S w eden Finl and Not e: Th e b lu e li n e r ep re se n ts t o tal in flo w s an d t h e r ed li n e stand s f or p rivate c ap ital in flows. P rivate c ap ital in flows ar e t h e fin a n cial ac cou n t net of c h an ge s in T ar ge t2 bal an ce s an d IM F /E U prog ra m d isb u rse m en ts. S ou rc e: Ow n c alcul at io n s b ased on d at
a taken f
35 -80000 -60000 -40000 -20000 0 20000 40000 60000 Q 3 2 0 0 1 Q 4 2 0 0 1 Q 1 2 0 0 2 Q 2 2 0 0 2 Q 3 2 0 0 2 Q 4 2 0 0 2 Q 1 2 0 0 3 Q 2 2 0 0 3 Q 3 2 0 0 3 Q 4 2 0 0 3 Q 1 2 0 0 4 Q 2 2 0 0 4 Q 3 2 0 0 4 Q 4 2 0 0 4 Q 1 2 0 0 5 Q 2 2 0 0 5 Q 3 2 0 0 5 Q 4 2 0 0 5 Q 1 2 0 0 6 Q 2 2 0 0 6 Q 3 2 0 0 6 Q 4 2 0 0 6 Q 1 2 0 0 7 Q 2 2 0 0 7 Q 3 2 0 0 7 Q 4 2 0 0 7 Q 1 2 0 0 8 Q 2 2 0 0 8 Q 3 2 0 0 8 Q 4 2 0 0 8 Q 1 2 0 0 9 Q 2 2 0 0 9 Q 3 2 0 0 9 Q 4 2 0 0 9 Q 1 2 0 1 0 Q 2 2 0 1 0 Q 3 2 0 1 0 Q 4 2 0 1 0 Q 1 2 0 1 1 Q 2 2 0 1 1 Q 3 2 0 1 1 Q 4 2 0 1 1 Q 1 2 0 1 2 Q 2 2 0 1 2 Q 3 2 0 1 2 Q 4 2 0 1 2 Q 1 2 0 1 3 Q 2 2 0 1 3 Q 3 2 0 1 3 Q 4 2 0 1 3 Q 1 2 0 1 4 -400000 -300000 -200000 -100000 0 100000 200000 300000 400000 Q3 2001 Q1 2002 Q3 2002 Q1 2003 Q3 2003 Q1 2004 Q3 2004 Q1 2005 Q3 2005 Q1 2006 Q3 2006 Q1 2007 Q3 2007 Q1 2008 Q3 2008 Q1 2009 Q3 2009 Q1 2010 Q3 2010 Q1 2011 Q3 2011 Q1 2012 Q3 2012 Q1 2013 Q3 2013 Q1 2014 -500000 -400000 -300000 -200000 -100000 0 100000 200000 300000 400000 500000 Q3 2001 Q1 2002 Q3 2002 Q1 2003 Q3 2003 Q1 2004 Q3 2004 Q1 2005 Q3 2005 Q1 2006 Q3 2006 Q1 2007 Q3 2007 Q1 2008 Q3 2008 Q1 2009 Q3 2009 Q1 2010 Q3 2010 Q1 2011 Q3 2011 Q1 2012 Q3 2012 Q1 2013 Q3 2013 Q1 2014
Figure 2: Construction of sudden stops and bonanzas
Year-over-year Change in Private capital inflows One Standard Deviation Bands
Two Standard Deviation Bands
Portugal
37
-150000 -100000 -50000 0 50000 100000 150000
Q3 2008
Q4 2008
Q1 2009
Q2 2009
Q3 2009
Q4 2009
Q1 2010
Q2 2010
Q3 2010
Q4 2010
Q1 2011
Q2 2011
Q3 2011
Q4 2011
Q1 2012
Q2 2012
Q3 2012
Q4 2012
Q1 2013
Q2 2013
Q3 2013
Q4 2013
Q1 2014
-15000,00 -10000,00 -5000,00 0,00 5000,00 10000,00
-10000,00 -8000,00 -6000,00 -4000,00 -2000,00 0,00 2000,00 4000,00 6000,00 8000,00
Bulgaria Belgium
41
-250000,00 -200000,00 -150000,00 -100000,00 -50000,00 0,00 50000,00 100000,00 150000,00 200000,00
Q3 2001
Q1 2002
Q3 2002
Q1 2003
Q3 2003
Q1 2004
Q3 2004
Q1 2005
Q3 2005
Q1 2006
Q3 2006
Q1 2007
Q3 2007
Q1 2008
Q3 2008
Q1 2009
Q3 2009
Q1 2010
Q3 2010
Q1 2011
Q3 2011
Q1 2012
Q3 2012
Q1 2013
Q3 2013
Q1 2014
-30000,00 -20000,00 -10000,00 0,00 10000,00 20000,00 30000,00 40000,00 50000,00
Q3 2001
Q1 2002
Q3 2002
Q1 2003
Q3 2003
Q1 2004
Q3 2004
Q1 2005
Q3 2005
Q1 2006
Q3 2006
Q1 2007
Q3 2007
Q1 2008
Q3 2008
Q1 2009
Q3 2009
Q1 2010
Q3 2010
Q1 2011
Q3 2011
Q1 2012
Q3 2012
Q1 2013
Q3 2013
Q1 2014
-25000,00 -20000,00 -15000,00 -10000,00 -5000,00 0,00 5000,00 10000,00 15000,00 20000,00
Netherlands
43 -150000,00 -100000,00 -50000,00 0,00 50000,00 100000,00 150000,00 Q3 2001 Q1 2002 Q3 2002 Q1 2003 Q3 2003 Q1 2004 Q3 2004 Q1 2005 Q3 2005 Q1 2006 Q3 2006 Q1 2007 Q3 2007 Q1 2008 Q3 2008 Q1 2009 Q3 2009 Q1 2010 Q3 2010 Q1 2011 Q3 2011 Q1 2012 Q3 2012 Q1 2013 Q3 2013 Q1 2014 -50000,00 -40000,00 -30000,00 -20000,00 -10000,00 0,00 10000,00 20000,00 30000,00 40000,00 50000,00 Q3 2001 Q1 2002 Q3 2002 Q1 2003 Q3 2003 Q1 2004 Q3 2004 Q1 2005 Q3 2005 Q1 2006 Q3 2006 Q1 2007 Q3 2007 Q1 2008 Q3 2008 Q1 2009 Q3 2009 Q1 2010 Q3 2010 Q1 2011 Q3 2011 Q1 2012 Q3 2012 Q1 2013 Q3 2013 Q1 2014 -80000,00 -60000,00 -40000,00 -20000,00 0,00 20000,00 40000,00 60000,00 80000,00 Q3 2001 Q1 2002 Q3 2002 Q1 2003 Q3 2003 Q1 2004 Q3 2004 Q1 2005 Q3 2005 Q1 2006 Q3 2006 Q1 2007 Q3 2007 Q1 2008 Q3 2008 Q1 2009 Q3 2009 Q1 2010 Q3 2010 Q1 2011 Q3 2011 Q1 2012 Q3 2012 Q1 2013 Q3 2013 Q1 2014
Source: Own calculations based on data taken from Eurostat, Euro crisis monitor, the IMF and the European Commission
Finland
Sweden
44
lvix lm2 lgdpgrowth lconsumerconfidence lchangerating lchangepublicdebt
lvix 1,0000
lm2 -0,0062 1,0000
lgdpgrowth -0,2851 0,1503 1,0000
lconsumerconfidence -0,3143 0,3278 0,6825 1,0000
lchangerating -0,0735 0,1336 0,1954 0,1562 1,0000
lchangepublicdebt 0,1902 -0,2248 -0,2350 -0,2994 -0,0523 1,0000